Green
The Tourist Beaches Predicted to Shrink the Most
Article/Editing:
The Tourist Beaches Predicted to Shrink the Most
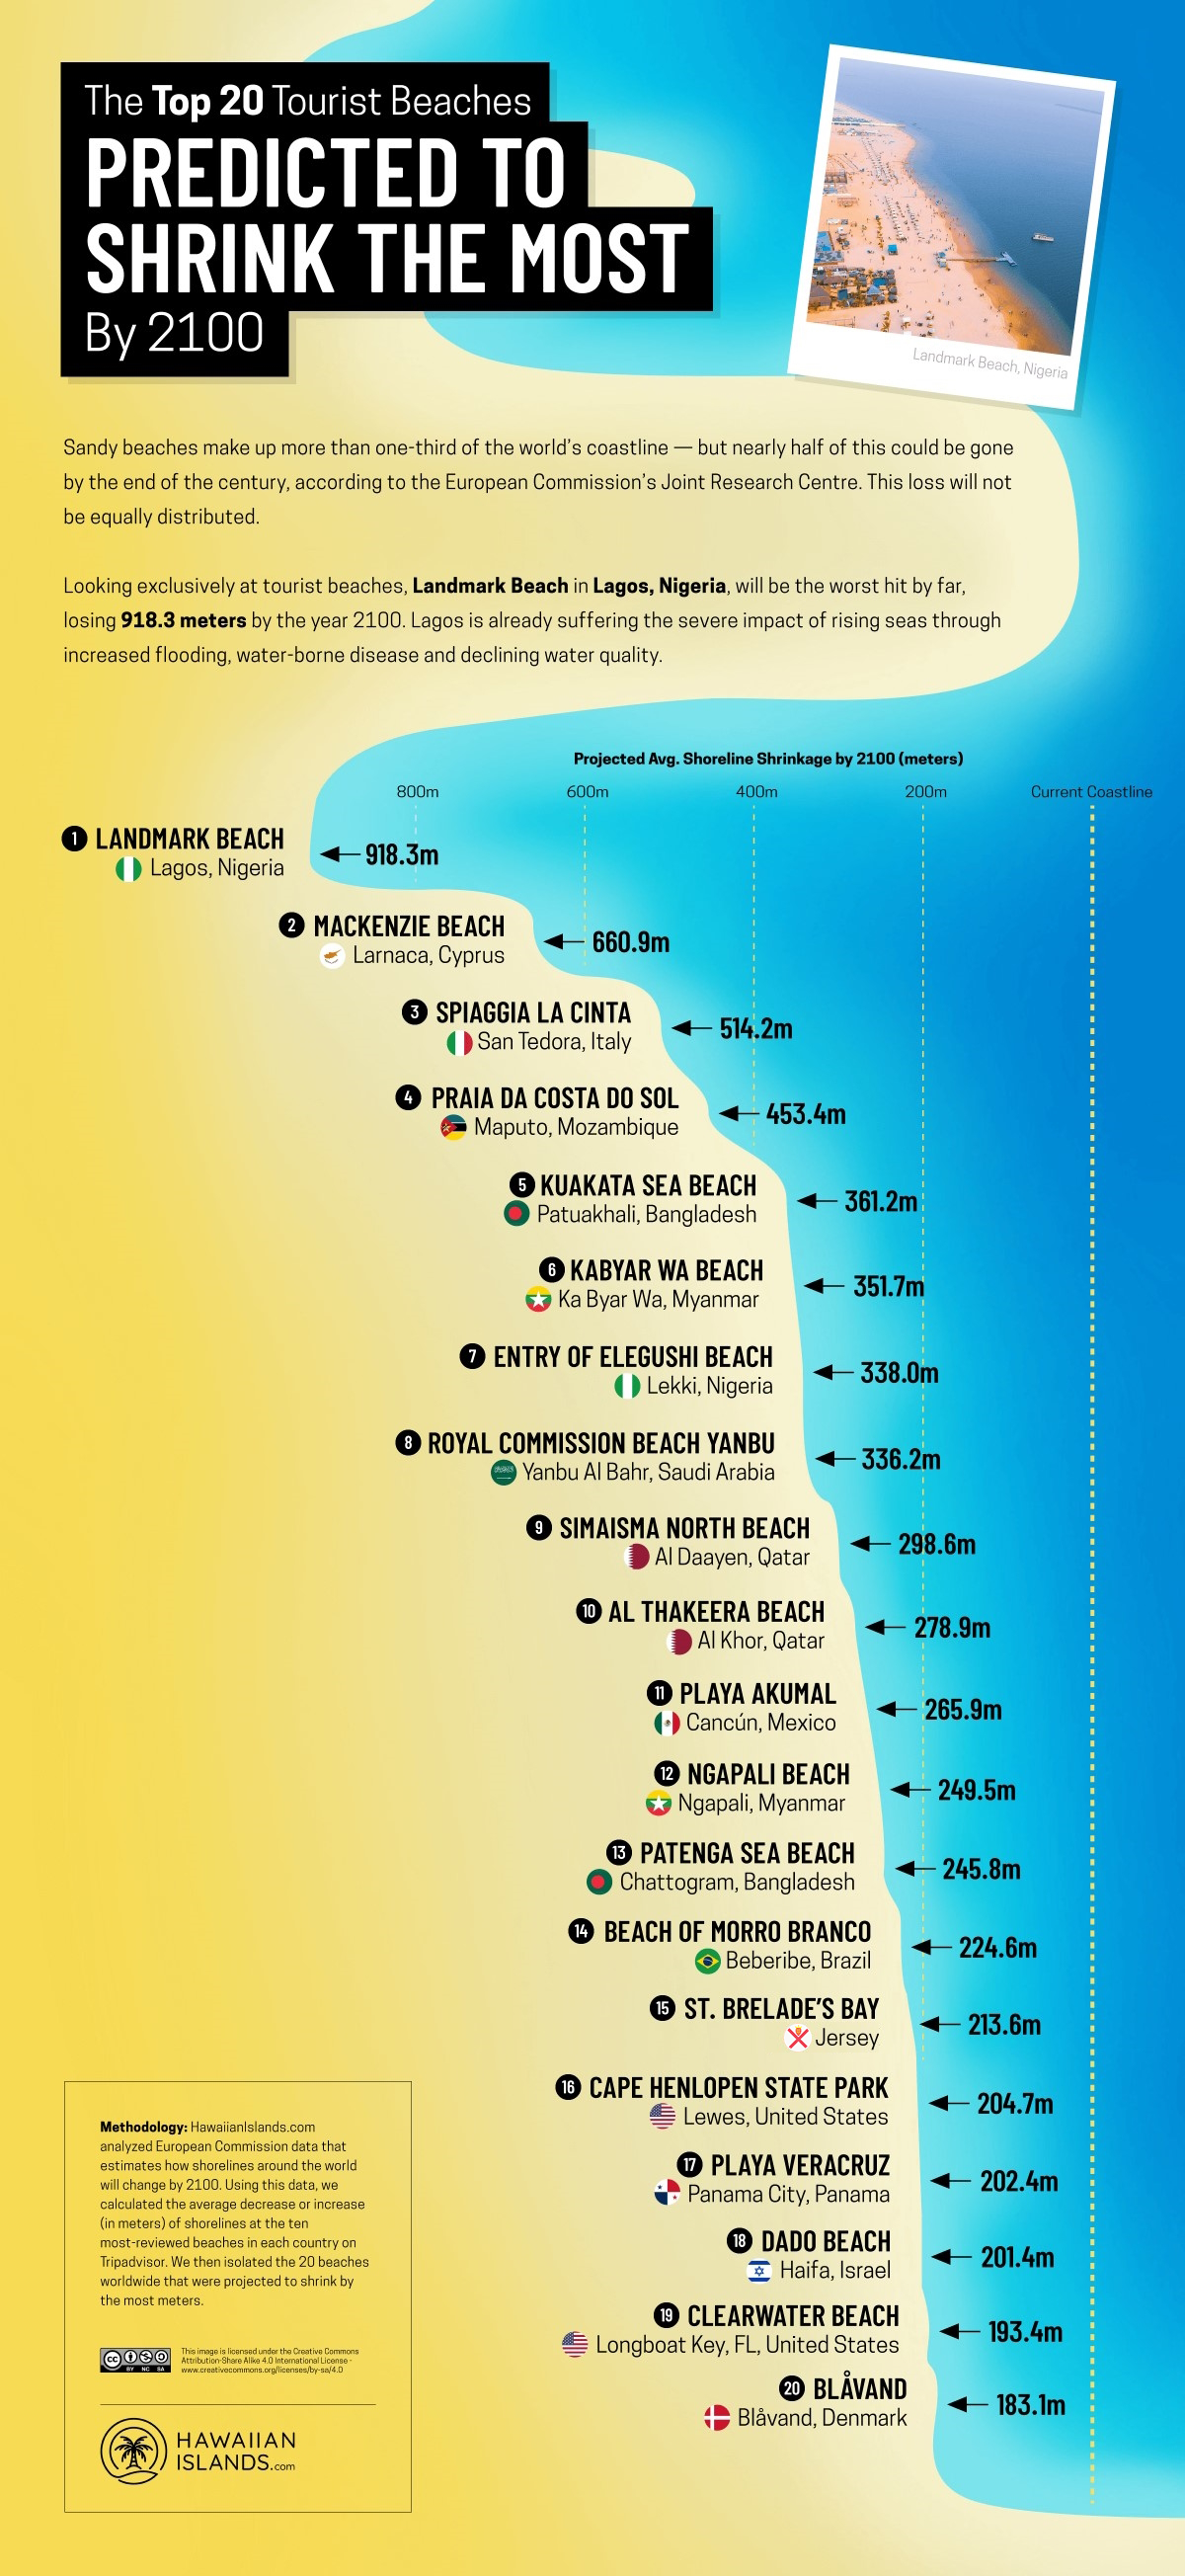
Sandy beaches comprise more than one-third of the world’s coastline —but nearly half of this could be gone by 2100.
This graphic by HawaiianIslands.com uses European Commission data that estimates how shorelines worldwide will change over the next decades.
How this Graphic Works
The source conducted an analysis using European Commission data, estimating global shoreline changes by 2100.
Utilizing this data, they calculated the average decrease or increase (in meters) for the shorelines of the 10 most-reviewed beaches in each country on TripAdvisor.
Subsequently, they identified the top 20 tourist beaches projected to experience the most significant reduction in size. The beach boundaries were delineated using the Google Maps API.
Beaches Shrinking by 2100
According to various research, climate change is the main cause of sea levels rising across the globe. In the 20th century alone, it’s estimated that the mean global sea level rose by 11-16 cm.
Typically, beaches might naturally shift inland in response to higher water levels. However, over the last few decades, beaches, caught between rising seas and structures such as buildings and roads, have found themselves with nowhere to go.
Landmark Beach in Lagos, Nigeria, is expected to be the worst hit by 2100, losing 918.3 m of shoreline due to rising sea levels.
Lagos is already suffering the severe impact of rising seas through increased flooding, water-borne disease, and declining water quality.
| Beach | Country | Shoreline Shrinkage (2100P) |
|---|---|---|
| Landmark | 🇳🇬 Nigeria | 918.3m |
| Mackenzie | 🇨🇾 Cyprus | 660.9m |
| Spiaggia La Cinta | 🇮🇹 Italy | 514.2m |
| Costa do Sol | 🇲🇿 Mozambique | 453.4m |
| Kuakata Sea | 🇧🇩 Bangladesh | 361.2m |
| Kabyar Wa | 🇲🇲 Myanmar | 351.7m |
| Entry of Elegushi | 🇳🇬 Nigeria | 338.0m |
| Royal Comission Yanbu | 🇸🇦 Saudi Arabia | 336.2m |
| Simaisma North | 🇶🇦 Qatar | 298.6m |
| Al Thakeera | 🇶🇦 Qatar | 278.9m |
| Akumal | 🇲🇽 Mexico | 265.9m |
| Ngapali | 🇲🇲 Myanmar | 249.5m |
| Patenga Sea | 🇧🇩 Bangladesh | 245.8m |
| Morro Branco | 🇧🇷 Brazil | 224.6m |
| St. Brelade's Bay | 🇯🇪 Jersey | 213.6m |
| Cape Henlopen | 🇺🇸 U.S. | 204.7m |
| Veracruz | 🇵🇦 Panama | 202.4m |
| Dado | 🇮🇱 Israel | 201.4m |
| Clearwater | 🇺🇸 U.S. | 193.4m |
| Blåvand | 🇩🇰 Denmark | 183.1m |
Playa Akumal in Cancún, Mexico, is the North American tourist beach that is expected to shrink the most (265.9 m). Parts of the Quintana Roo coast, where Akumal is found, are already losing up to 4.9 m a year.
Meanwhile, Clearwater Beach in Longboat Key, Florida, is the American beach that is anticipated to shrink the most (193.4 m). Rising sea levels in Clearwater pose an additional concern since the local aquifers, critical for the water supply of millions, are vulnerable to saltwater intrusion.
What’s Causing Sea Levels to Rise?
Since the 1970s, the world has experienced an average temperature increase of 0.15 to 0.20°C per decade, as indicated by NASA research.
This global warming phenomenon has triggered the melting of polar ice caps, resulting in the loss of approximately 28 trillion tonnes of ice within a little over two decades.
Concurrently, global sea levels have escalated by an average of 34.6 mm during the same period.
In the face of the challenge, solutions such as creating dunes along the backshore of beaches, increasing shoreline setbacks, and planting submerged aquatic vegetation to reduce erosion have been studied to mitigate the impact of rising sea levels.


This article was published as a part of Visual Capitalist's Creator Program, which features data-driven visuals from some of our favorite Creators around the world.


Green
The Carbon Footprint of Major Travel Methods
Going on a cruise ship and flying domestically are the most carbon-intensive travel methods.


The Carbon Footprint of Major Travel Methods
This was originally posted on our Voronoi app. Download the app for free on iOS or Android and discover incredible data-driven charts from a variety of trusted sources.
Did you know that transport accounts for nearly one-quarter of global energy-related carbon dioxide (CO₂) emissions?
This graphic illustrates the carbon footprints of major travel methods measured in grams of carbon dioxide equivalent (CO₂e) emitted per person to travel one kilometer. This includes both CO₂ and other greenhouse gases.
Data is sourced from Our World in Data, the UK Government’s Department for Energy Security and Net Zero, and The International Council on Clean Transportation, as of December 2022.
These figures should be interpreted as approximations, rather than exact numbers. There are many variables at play that determine the actual carbon footprint in any individual case, including vehicle type or model, occupancy, energy mix, and even weather.
Cruise Ships are the Most Carbon-Intensive Travel Method
According to these estimates, taking a cruise ship, flying domestically, and driving alone are some of the most carbon-intensive travel methods.
Cruise ships typically use heavy fuel oil, which is high in carbon content. The average cruise ship weighs between 70,000 to 180,000 metric tons, meaning they require large engines to get moving.
These massive vessels must also generate power for onboard amenities such as lighting, air conditioning, and entertainment systems.
Short-haul flights are also considered carbon-intensive due to the significant amount of fuel consumed during initial takeoff and climbing altitude, relative to a lower amount of cruising.
| Transportation method | CO₂ equivalent emissions per passenger km |
|---|---|
| Cruise Ship | 250 |
| Short-haul flight (i.e. within a U.S. state or European country) | 246 |
| Diesel car | 171 |
| Gas car | 170 |
| Medium-haul flight (i.e. international travel within Europe, or between U.S. states) | 151 |
| Long-haul flight (over 3,700 km, about the distance from LA to NY) | 147 |
| Motorbike | 113 |
| Bus (average) | 96 |
| Plug-in hybrid | 68 |
| Electric car | 47 |
| National rail | 35 |
| Tram | 28 |
| London Underground | 27 |
| Ferry (foot passenger) | 19 |
| Eurostar (International rail) | 4.5 |
Are EVs Greener?
Many experts agree that EVs produce a lower carbon footprint over time versus traditional internal combustion engine (ICE) vehicles.
However, the batteries in electric vehicles charge on the power that comes straight off the electrical grid—which in many places may be powered by fossil fuels. For that reason, the carbon footprint of an EV will depend largely on the blend of electricity sources used for charging.
There are also questions about how energy-intensive it is to build EVs compared to a comparable ICE vehicle.

-

 Science7 days ago
Visualizing the Average Lifespans of Mammals
-

 Markets2 weeks ago
The Top 10 States by Real GDP Growth in 2023
-

 Demographics2 weeks ago
The Smallest Gender Wage Gaps in OECD Countries
-

 United States2 weeks ago
Where U.S. Inflation Hit the Hardest in March 2024
-

 Green2 weeks ago
Top Countries By Forest Growth Since 2001
-

 United States2 weeks ago
Ranked: The Largest U.S. Corporations by Number of Employees
-

 Maps2 weeks ago
The Largest Earthquakes in the New York Area (1970-2024)
-

 Green2 weeks ago
Ranked: The Countries With the Most Air Pollution in 2023