Datastream
‘Tis the Season: U.S. Holiday Spending Projected to Reach All-Time High in 2020


The Briefing
- U.S. consumers are expected to spend up to $767 billion this holiday season
- Online and non-store sales are projected to account for $218 billion of that
- On Black Friday alone, U.S. consumers spent $9 billion online—a 22% increased compared to 2019
U.S. Holiday Spending Projected to Reach All-Time High in 2020
Despite the economic uncertainty caused by COVID-19, Americans are still willing to shell out some serious cash this holiday season.
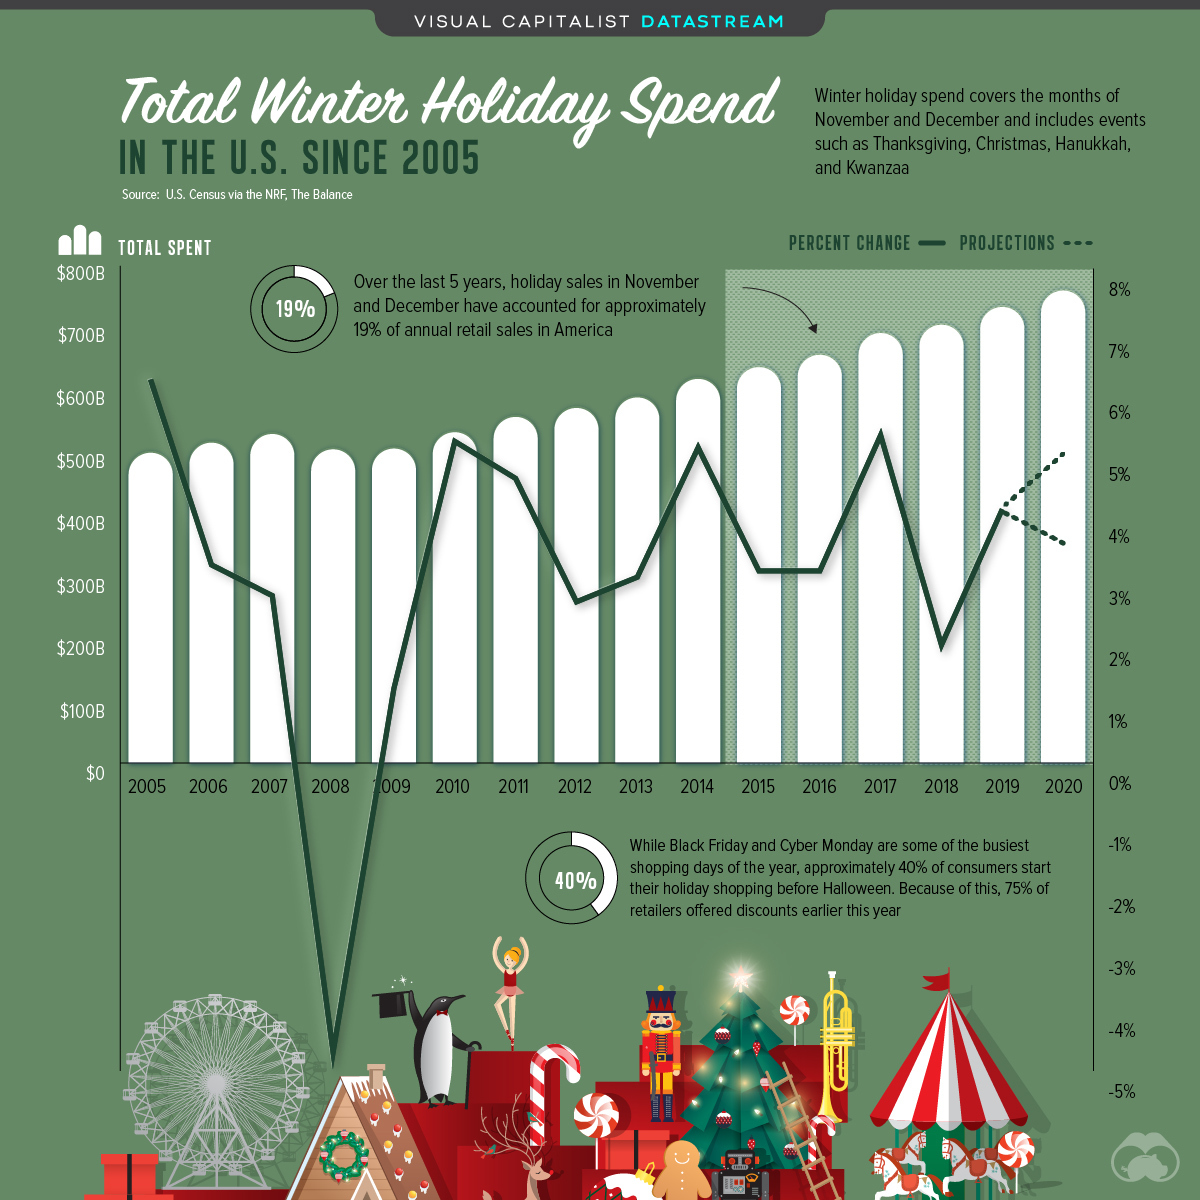
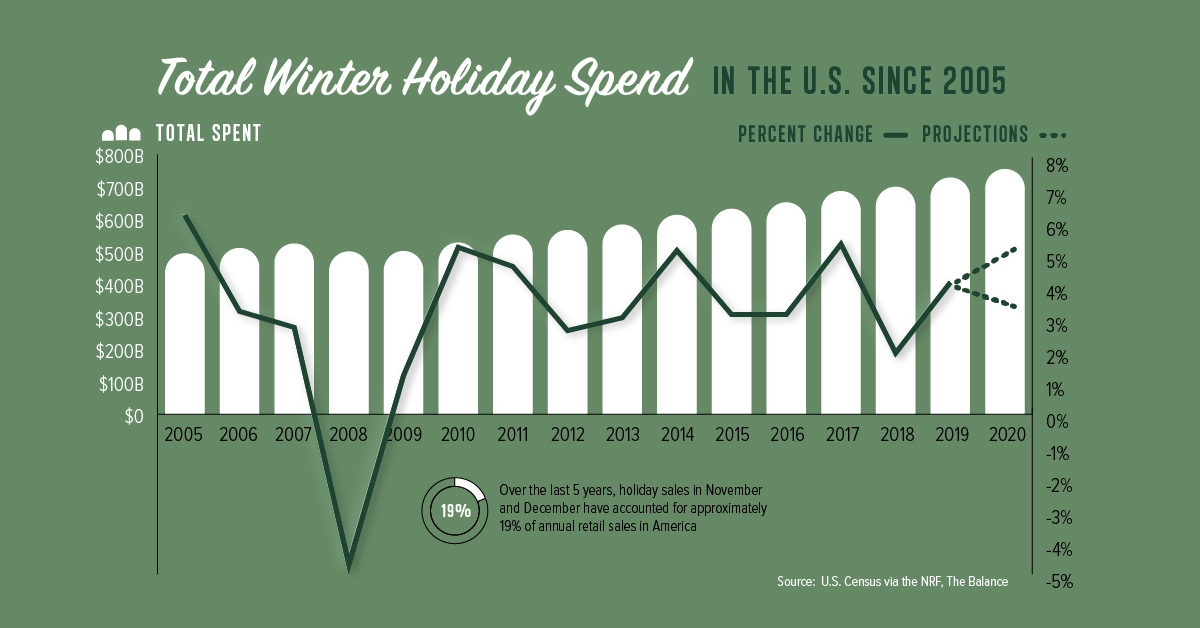
This year, the National Retail Federation (NRF) expects U.S. consumers to spend up to $767 billion through the months of November and December—a 5.2% increase compared to 2019.
Why the increase, given 2020’s economic turmoil? The NRF cites recent job growth, low energy costs, and reduced spending on travel and entertainment as a few key factors driving this year’s projected spending growth.
15 Years of U.S. Holiday Spending
In America, November and December are generally the busiest retail months of the year. Here’s how much U.S. consumers have spent during the holidays since 2005:
| Year | U.S. Retail Spending During Holiday Season (Billions) | YoY Change |
|---|---|---|
| 2005 | $496.0 | 6.2% |
| 2006 | $512.1 | 3.2% |
| 2007 | $526.0 | 2.7% |
| 2008 | $501.5 | -4.7% |
| 2009 | $502.7 | 1.2% |
| 2010 | $528.8 | 5.2% |
| 2011 | $553.3 | 4.6% |
| 2012 | $567.6 | 2.6% |
| 2013 | $584.4 | 3.0% |
| 2014 | $614.1 | 5.1% |
| 2015 | $632.9 | 3.1% |
| 2016 | $652.6 | 3.1% |
| 2017 | $687.4 | 5.3% |
| 2018 | $700.7 | 1.9% |
| 2019 | $729.1 | 4.1% |
While this year’s spending is set to break records, the shopping experience will likely look different for many consumers. For instance, 59% of U.S. shoppers plan to do more shopping online this year, in an attempt to stay safe during the pandemic.
»What about other major retail holidays? Read our full article How Holiday Spending Compares Around the World
Where does this data come from?
Source: U.S. Census via National Retail Federation
Note: NRF holiday spending is defined as the months of November and December. NRF’s forecast excludes automobile dealers, gasoline stations, and restaurants.


Datastream
Can You Calculate Your Daily Carbon Footprint?
Discover how the average person’s carbon footprint impacts the environment and learn how carbon credits can offset your carbon footprint.


The Briefing
- A person’s carbon footprint is substantial, with activities such as food consumption creating as much as 4,500 g of CO₂ emissions daily.
- By purchasing carbon credits from Carbon Streaming Corporation, you can offset your own emissions and fund positive climate action.
Your Everyday Carbon Footprint
While many large businesses and countries have committed to net-zero goals, it is essential to acknowledge that your everyday activities also contribute to global emissions.
In this graphic, sponsored by Carbon Streaming Corporation, we will explore how the choices we make and the products we use have a profound impact on our carbon footprint.
Carbon Emissions by Activity
Here are some of the daily activities and products of the average person and their carbon footprint, according to Clever Carbon.
| Household Activities & Products | CO2 Emissions (g) |
|---|---|
| 💡 Standard Light Bulb (100 watts, four hours) | 172 g |
| 📱 Mobile Phone Use (195 minutes per day)* | 189 g |
| 👕 Washing Machine (0.63 kWh) | 275 g |
| 🔥 Electric Oven (1.56 kWh) | 675 g |
| ♨️ Tumble Dryer (2.5 kWh) | 1,000 g |
| 🧻 Toilet Roll (2 ply) | 1,300 g |
| 🚿 Hot Shower (10 mins) | 2,000 g |
| 🚙 Daily Commute (one hour, by car) | 3,360 g |
| 🍽️ Average Daily Food Consumption (three meals of 600 calories) | 4,500 g |
| *Phone use based on yearly use of 69kg per the source, Reboxed | |
Your choice of transportation plays a crucial role in determining your carbon footprint. For instance, a 15 km daily commute to work on public transport generates an average of 1,464 g of CO₂ emissions. Compared to 3,360 g—twice the volume for a journey the same length by car.
By opting for more sustainable modes of transport, such as cycling, walking, or public transportation, you can significantly reduce your carbon footprint.
Addressing Your Carbon Footprint
One way to compensate for your emissions is by purchasing high-quality carbon credits.
Carbon credits are used to help fund projects that avoid, reduce or remove CO₂ emissions. This includes nature-based solutions such as reforestation and improved forest management, or technology-based solutions such as the production of biochar and carbon capture and storage (CCS).
While carbon credits offer a potential solution for individuals to help reduce global emissions, public awareness remains a significant challenge. A BCG-Patch survey revealed that only 34% of U.S. consumers are familiar with carbon credits, and only 3% have purchased them in the past.
About Carbon Streaming
By financing the creation or expansion of carbon projects, Carbon Streaming Corporation secures the rights to future carbon credits generated by these sustainable projects. You can then purchase these carbon credits to help fund climate solutions around the world and compensate for your own emissions.
Ready to get involved?
>> Learn more about purchasing carbon credits at Carbon Streaming

-

 Real Estate2 weeks ago
Visualizing America’s Shortage of Affordable Homes
-

 Technology1 week ago
Ranked: Semiconductor Companies by Industry Revenue Share
-

 Money1 week ago
Which States Have the Highest Minimum Wage in America?
-

 Real Estate1 week ago
Ranked: The Most Valuable Housing Markets in America
-

 Business2 weeks ago
Charted: Big Four Market Share by S&P 500 Audits
-

 AI2 weeks ago
The Stock Performance of U.S. Chipmakers So Far in 2024
-

 Misc2 weeks ago
Almost Every EV Stock is Down After Q1 2024
-

 Money2 weeks ago
Where Does One U.S. Tax Dollar Go?