Business
The 20 Most and Least Profitable Companies, Per Employee
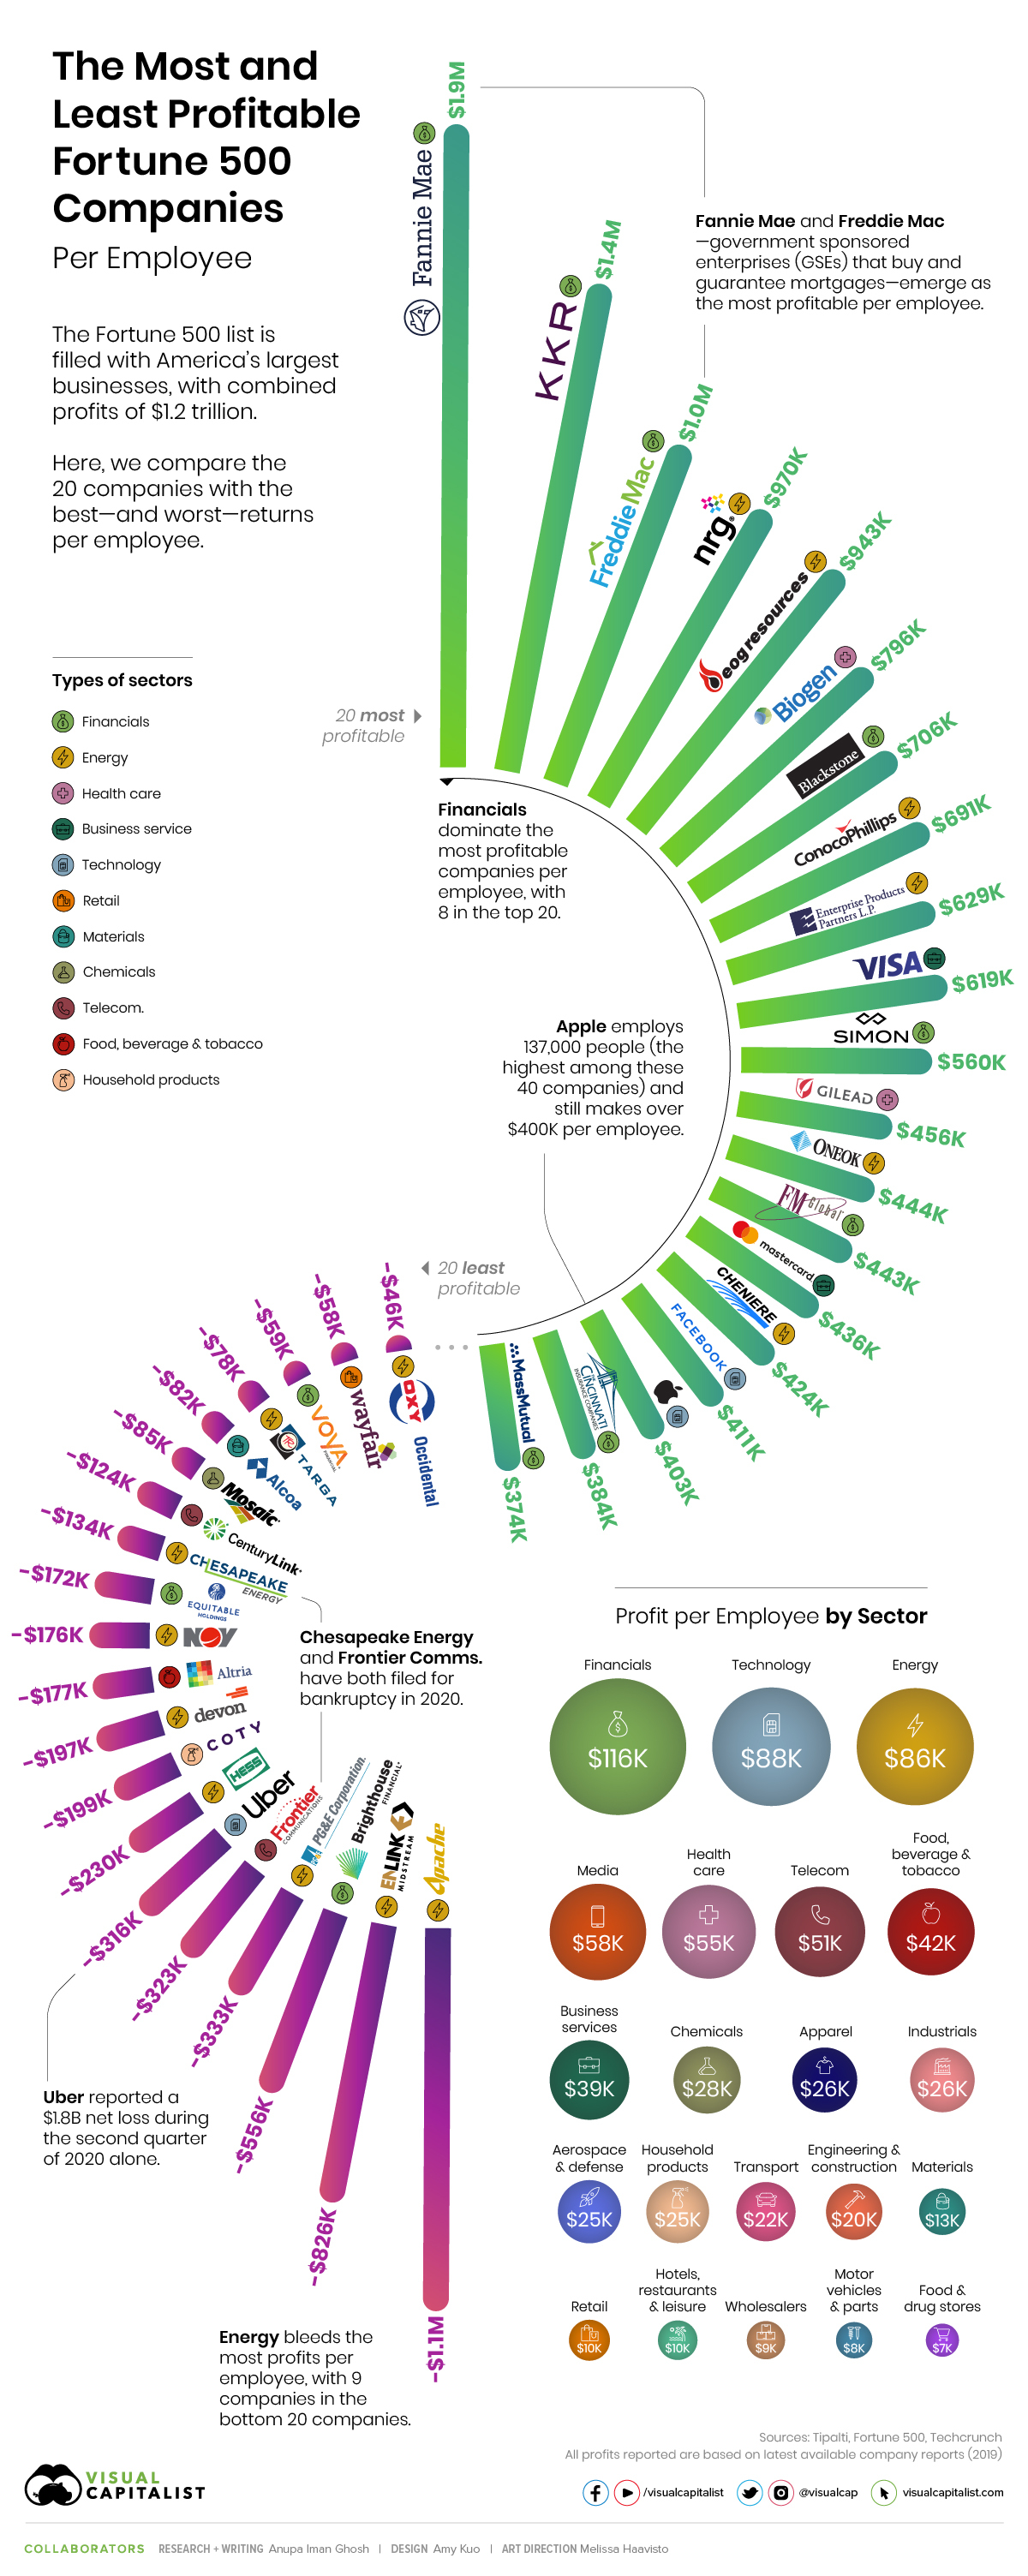
The Fortune 500 is an elite club of the biggest American businesses, which combined to generate profits of over $1.2 trillion in 2019.
But how much profit do these companies make on a per employee basis?
This visualization uncovers the answer by comparing the 20 companies with the most and least returns per employee, using calculations from Tipalti (based on the Fortune 500 list).
Top 20: Most Profit per Employee
Diving right in, the companies that make the most money per employee may surprise you.
Housing giants Fannie Mae and Freddie Mac take two of the top three spots, bringing in $1.9 million and $1.0 million per employee respectively in 2019.
The two U.S. government sponsored enterprises (GSEs) are major players in the secondary mortgage market, buying and repackaging nearly half the mortgages in the country. The duo was allowed to retain their profits as of October 2019, instead of returning them to the U.S. Treasury.
Company | Sector | Profit per Employee | Profits ($M) | Employees |
---|---|---|---|---|
Fannie Mae (Federal National Mortgage Association) | Financials | $1,888,000 | $14,160 | 7,500 |
KKR | Financials | $1,448,699 | $2,005 | 1,384 |
Freddie Mac (Federal Home Loan Mortgage Corporation) | Financials | $1,046,721 | $7,214 | 6,892 |
NRG Energy | Energy | $969,631 | $4,438 | 4,577 |
EOG Resources | Energy | $943,103 | $2,735 | 2,900 |
Biogen | Health Care | $795,811 | $5,889 | 7,400 |
Blackstone Group | Financials | $705,680 | $2,050 | 2,905 |
ConocoPhillips | Energy | $691,250 | $7,189 | 10,400 |
Enterprise Products Partners | Energy | $628,904 | $4,591 | 7,300 |
Visa | Business Services | $619,487 | $12,080 | 19,500 |
Simon Property Group | Financials | $560,533 | $2,102 | 3,750 |
Gilead Sciences | Health Care | $456,441 | $5,386 | 11,800 |
Oneok | Energy | $443,789 | $1,279 | 2,882 |
FM Global | Financials | $443,391 | $2,479 | 5,591 |
Mastercard | Business Services | $436,452 | $8,118 | 18,600 |
Cheniere Energy | Energy | $423,529 | $648 | 1,530 |
Technology | $411,308 | $18,485 | 44,942 | |
Apple | Technology | $403,328 | $55,256 | 137,000 |
Cincinnati Financial | Financials | $384,038 | $1,997 | 5,200 |
Massachusetts Mutual Life Insurance | Financials | $373,989 | $3,701 | 9,896 |
Apple employs 137,000 people—the largest workforce by far among the 40 companies profiled—but still makes $403,328 per employee. Facebook is the only other tech giant to bring in more money per employee at $411,308.
Bottom 20: Least Profit per Employee
On the other end of the spectrum, Uber is one of the most well-known companies currently bleeding profits, losing $316K per employee. In fact, the ride-hailing service lost approximately $1.8 billion in the second quarter of 2020 alone.
Company | Sector | Profit per Employee | Profits ($M) | Employees |
---|---|---|---|---|
Apache | Energy | -$1,123,301 | -$3,553 | 3,163 |
EnLink Midstream | Energy | -$825,830 | -$1,119 | 1,355 |
Brighthouse Financial | Financials | -$556,391 | -$740 | 1,330 |
PG&E | Energy | -$332,870 | -$7,656 | 23,000 |
Frontier Communications | Telecommunications | -$322,706 | -$5,911 | 18,317 |
Uber Technologies | Technology | -$316,208 | -$8,506 | 26,900 |
Hess | Energy | -$229,859 | -$408 | 1,775 |
Coty | Household Products | -$199,158 | -$3,784 | 19,000 |
Devon Energy | Energy | -$197,222 | -$355 | 1,800 |
Altria Group | Food, Beverages & Tobacco | -$177,123 | -$1,293 | 7,300 |
National Oilwell Varco | Energy | -$175,927 | -$6,095 | 34,645 |
Equitable Holdings | Financials | -$171,584 | -$1,733 | 10,100 |
Chesapeake Energy | Energy | -$133,913 | -$308 | 2,300 |
CenturyLink | Telecommunications | -$123,976 | -$5,269 | 42,500 |
Mosaic | Chemicals | -$84,683 | -$1,067 | 12,600 |
Alcoa | Materials | -$81,522 | -$1,125 | 13,800 |
Targa Resources | Energy | -$77,985 | -$209 | 2,680 |
Voya Financial | Financials | -$58,500 | -$351 | 6,000 |
Wayfair | Retailing | -$57,992 | -$985 | 16,985 |
Occidental Petroleum | Energy | -$46,319 | -$667 | 14,400 |
COVID-19 has also had an intense effect on some of the companies at the bottom end of the profit per employee spectrum. Chesapeake Energy and Frontier Communications are just two examples that have filed for Chapter 11 bankruptcy in recent months—they each lost $134K and $322K per employee in 2019 respectively.
I’m pretty confident we will see more bankruptcies than in any business person’s lifetime.
—James Hammond, CEO of BankruptcyData
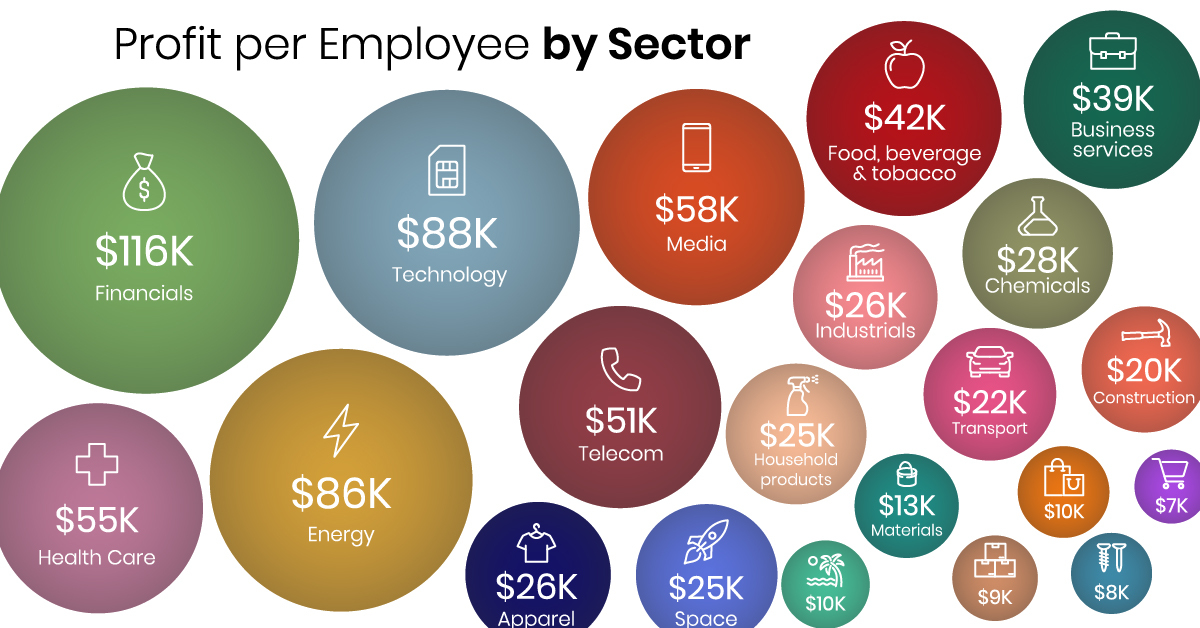
Profit per Employee by Sector
When all the companies in the Fortune 500 are taken into account, sector-specific numbers reveal interesting trends.
Financials bring in the most profit per employee at $116K, while Food and Drug Stores see 17 times less profit at $6.7K per employee. In fact, eight out of the top 20 most profitable companies are found in the financial sector.
Sector | Profits per Employee | Profits ($M) | Employees |
---|---|---|---|
Financials | $116,228 | $378,445 | 3,256,067 |
Technology | $87,532 | $252,836 | 2,888,490 |
Energy | $85,547 | $75,410 | 881,505 |
Media | $57,947 | $21,634 | 373,333 |
Health Care | $54,679 | $145,166 | 2,654,872 |
Telecommunications | $50,636 | $38,251 | 755,417 |
F&B incl. Tobacco | $41,946 | $42,924 | 1,023,317 |
Business Services | $39,354 | $36,835 | 936,000 |
Chemicals | $27,977 | $11,328 | 404,888 |
Apparel | $26,154 | $7,776 | 297,300 |
Industrials | $25,827 | $27,006 | 1,045,675 |
Aerospace & Defence | $24,793 | $23,903 | 964,100 |
Household Products | $24,504 | $10,415 | 425,038 |
Transportation | $21,762 | $32,454 | 1,491,358 |
Engineering & Construction | $19,648 | $6,773 | 344,716 |
Materials | $13,408 | $6,024 | 449,252 |
Retailing | $10,373 | $67,318 | 6,489,923 |
Hotels, Restaurants & Leisure | $9,653 | $16,880 | 1,748,714 |
Wholesalers | $9,025 | $5,842 | 647,312 |
Motor Vehicles & Parts | $8,113 | $7,108 | 876,123 |
Food & Drug Stores | $6,746 | $8,355 | 1,238,645 |
Interestingly, as a whole, the energy sector comes in third place in terms of profit per employee at $86K—that said, nine out of the bottom 20 least profitable companies are also found in this highly volatile industry.
Though the vast majority of businesses impacted by COVID-19 have been small to mid-sized companies, the above calculations also show that Fortune 500 companies are not safe, either.
Support the Future of Data Storytelling
Sorry to interrupt your reading, but we have a favor to ask. At Visual Capitalist we believe in a world where data can be understood by everyone. That’s why we want to build the VC App - the first app of its kind combining verifiable and transparent data with beautiful, memorable visuals. All available for free.
As a small, independent media company we don’t have the expertise in-house or the funds to build an app like this. So we’re asking our community to help us raise funds on Kickstarter.
If you believe in data-driven storytelling, join the movement and back us on Kickstarter!
Thank you.

Markets
30 Years of Gun Manufacturing in America
The U.S. has produced nearly 170 million firearms over the past three decades. Here are the numbers behind America’s gun manufacturing sector.

30 Years of Gun Manufacturing in America
While gun sales have been brisk in recent years, the uncertainty surrounding COVID-19 was a boon for the gun industry.
From 2010-2019, an average of 13 million guns were sold legally in the U.S. each year. In 2020 and 2021, annual gun sales sharply increased to 20 million.
While the U.S. does import millions of weapons each year, a large amount of firearms sold in the country were produced domestically. Let’s dig into the data behind the multi-billion dollar gun manufacturing industry in America.
Gun Manufacturing in the United States
According to a recent report from the Bureau of Alcohol, Tobacco, Firearms and Explosives (ATF), the U.S. has produced nearly 170 million firearms over the past three decades, with production increasing sharply in recent years.
America’s gunmakers produce a wide variety of firearms, but they’re generally grouped into five categories; pistols, rifles, shotguns, revolvers, and everything else.
Below is a breakdown of firearms manufactured in the country over the past 30 years, by type:
Year | Pistols | Rifles | Revolvers | Shotguns | Misc. Firearms | Total Firearms |
---|---|---|---|---|---|---|
1989 | 1,404,753 | 1,407,400 | 628,573 | 935,541 | 42,126 | 4,418,393 |
1990 | 1,371,427 | 1,211,664 | 470,495 | 848,948 | 57,434 | 3,959,968 |
1991 | 1,378,252 | 883,482 | 456,966 | 828,426 | 15,980 | 3,563,106 |
1992 | 1,669,537 | 1,001,833 | 469,413 | 1,018,204 | 16,849 | 4,175,836 |
1993 | 2,093,362 | 1,173,694 | 562,292 | 1,144,940 | 81,349 | 5,055,637 |
1994 | 2,004,298 | 1,316,607 | 586,450 | 1,254,926 | 10,936 | 5,173,217 |
1995 | 1,195,284 | 1,411,120 | 527,664 | 1,173,645 | 8,629 | 4,316,342 |
1996 | 987,528 | 1,424,315 | 498,944 | 925,732 | 17,920 | 3,854,439 |
1997 | 1,036,077 | 1,251,341 | 370,428 | 915,978 | 19,680 | 3,593,504 |
1998 | 960,365 | 1,535,690 | 324,390 | 868,639 | 24,506 | 3,713,590 |
1999 | 995,446 | 1,569,685 | 335,784 | 1,106,995 | 39,837 | 4,047,747 |
2000 | 962,901 | 1,583,042 | 318,960 | 898,442 | 30,196 | 3,793,541 |
2001 | 626,836 | 1,284,554 | 320,143 | 679,813 | 21,309 | 2,932,655 |
2002 | 741,514 | 1,515,286 | 347,070 | 741,325 | 21,700 | 3,366,895 |
2003 | 811,660 | 1,430,324 | 309,364 | 726,078 | 30,978 | 3,308,404 |
2004 | 728,511 | 1,325,138 | 294,099 | 731,769 | 19,508 | 3,099,025 |
2005 | 803,425 | 1,431,372 | 274,205 | 709,313 | 23,179 | 3,241,494 |
2006 | 1,021,260 | 1,496,505 | 385,069 | 714,618 | 35,872 | 3,653,324 |
2007 | 1,219,664 | 1,610,923 | 391,334 | 645,231 | 55,461 | 3,922,613 |
2008 | 1,609,381 | 1,734,536 | 431,753 | 630,710 | 92,564 | 4,498,944 |
2009 | 1,868,258 | 2,248,851 | 547,195 | 752,699 | 138,815 | 5,555,818 |
2010 | 2,258,450 | 1,830,556 | 558,927 | 743,378 | 67,929 | 5,459,240 |
2011 | 2,598,133 | 2,318,088 | 572,857 | 862,401 | 190,407 | 6,541,886 |
2012 | 3,487,883 | 3,168,206 | 667,357 | 949,010 | 306,154 | 8,578,610 |
2013 | 4,441,726 | 3,979,570 | 725,282 | 1,203,072 | 495,142 | 10,844,792 |
2014 | 3,633,454 | 3,379,549 | 744,047 | 935,411 | 358,165 | 9,050,626 |
2015 | 3,557,199 | 3,691,799 | 885,259 | 777,273 | 447,131 | 9,358,661 |
2016 | 4,720,075 | 4,239,335 | 856,291 | 848,617 | 833,123 | 11,497,441 |
2017 | 3,691,010 | 2,504,092 | 720,917 | 653,139 | 758,634 | 8,327,792 |
2018 | 3,881,158 | 2,880,536 | 664,835 | 536,126 | 1,089,973 | 9,052,628 |
2019 | 3,046,013 | 1,957,667 | 580,601 | 480,735 | 946,929 | 7,011,945 |
Total | 60,804,840 | 59,796,760 | 15,826,964 | 26,241,134 | 6,298,415 | 168,968,113 |
Pistols (36%) and rifles (35%) are the dominant categories, and over time, the former has become the most commonly produced firearm type.
In 2001, pistols accounted for 21% of firearms produced. Today, nearly half of all firearms produced are pistols.
Who is Producing America’s Firearms?
There are a wide variety of firearm manufacturing companies in the U.S., but production is dominated by a few key players.
Here are the top 10 gunmakers in America, which collectively make up 70% of production:
Rank | Firearm Manufacturer | Guns Produced (2016-2020) | Share of total |
---|---|---|---|
1 | Smith & Wesson Corp | 8,218,199 | 17.2% |
2 | Sturm, Ruger & Company, Inc | 8,166,448 | 17.1% |
3 | Sig Sauer Inc | 3,660,629 | 7.7% |
4 | Freedom Group | 3,045,427 | 6.4% |
5 | 0 F Mossberg & Sons Inc | 2,223,241 | 4.7% |
6 | Taurus International Manufacturing | 1,996,121 | 4.2% |
7 | WM C Anderson Inc | 1,816,625 | 3.8% |
8 | Glock Inc | 1,510,437 | 3.2% |
9 | Henry RAC Holding Corp | 1,378,544 | 2.9% |
10 | JIE Capital Holdings / Enterprises | 1,258,969 | 2.6% |
Total | 33,274,640 | 69.7% |
One-third of production comes from two publicly-traded parent companies: Smith & Wesson (NASDAQ: SWBI), and Sturm, Ruger & Co. (NYSE: RGR)
Some of these players are especially dominant within certain types of firearms. For example:
- 58% of pistols were made by Smith & Wesson, Ruger, and SIG SAUER (2008–2018)
- 45% of rifles were made by Remington*, Ruger, and Smith & Wesson (2008–2018)
*In 2020, Remington filed for Chapter 11 bankruptcy protection, and its assets were divided and sold to various buyers. The Remington brand name is now owned by Vista Outdoor (NYSE: VSTO)
The Geography of Gun Manufacturing
Companies that manufacture guns hold a Type 07 license from the ATF. As of 2020, there are more than 16,000 Type 07 licensees across the United States.
Below is a state-level look at where the country’s licensees are located:
State | Licenses (2000) | Licenses (2020) | Population | Licenses per 100,000 pop. (2020) |
---|---|---|---|---|
Alaska | 8 | 117 | 733,391 | 16.0 |
Alabama | 40 | 276 | 5,039,877 | 5.5 |
Arkansas | 28 | 302 | 3,011,524 | 10.0 |
Arizona | 100 | 959 | 7,276,316 | 13.2 |
California | 159 | 620 | 39,237,836 | 1.6 |
Colorado | 27 | 481 | 5,812,069 | 8.3 |
Connecticut | 71 | 194 | 3,605,944 | 5.4 |
Delaware | 0 | 10 | 989,948 | 1.0 |
Florida | 131 | 1,009 | 21,781,128 | 4.6 |
Georgia | 52 | 510 | 10,799,566 | 4.7 |
Hawaii | 0 | 11 | 1,455,271 | 0.8 |
Iowa | 11 | 187 | 3,190,369 | 5.9 |
Idaho | 38 | 358 | 1,839,106 | 19.5 |
Illinois | 40 | 263 | 12,671,469 | 2.1 |
Indiana | 39 | 280 | 6,805,985 | 4.1 |
Kansas | 17 | 229 | 2,937,880 | 7.8 |
Kentucky | 22 | 211 | 4,505,836 | 4.7 |
Louisiana | 20 | 258 | 4,657,757 | 5.5 |
Massachusetts | 67 | 263 | 6,984,723 | 3.8 |
Maryland | 36 | 146 | 6,165,129 | 2.4 |
Maine | 13 | 107 | 1,362,359 | 7.9 |
Michigan | 43 | 386 | 10,050,811 | 3.8 |
Minnesota | 63 | 254 | 5,707,390 | 4.5 |
Missouri | 62 | 401 | 6,168,187 | 6.5 |
Mississippi | 12 | 190 | 2,961,279 | 6.4 |
Montana | 24 | 240 | 1,084,225 | 22.1 |
North Carolina | 52 | 628 | 10,551,162 | 6.0 |
North Dakota | 3 | 46 | 779,094 | 5.9 |
Nebraska | 15 | 91 | 1,961,504 | 4.6 |
New Hampshire | 25 | 188 | 1,377,529 | 13.6 |
New Jersey | 10 | 26 | 9,267,130 | 0.3 |
New Mexico | 18 | 179 | 2,117,522 | 8.5 |
Nevada | 45 | 276 | 3,104,614 | 8.9 |
New York | 35 | 299 | 19,835,913 | 1.5 |
Ohio | 80 | 644 | 11,780,017 | 5.5 |
Oklahoma | 37 | 423 | 3,959,353 | 10.7 |
Oregon | 55 | 226 | 4,237,256 | 5.3 |
Pennsylvania | 87 | 519 | 12,964,056 | 4.0 |
Rhode Island | 1 | 20 | 1,097,379 | 1.8 |
South Carolina | 25 | 284 | 5,190,705 | 5.5 |
South Dakota | 14 | 79 | 886,667 | 8.9 |
Tennessee | 76 | 352 | 6,975,218 | 5.0 |
Texas | 150 | 2,022 | 29,527,941 | 6.8 |
Utah | 33 | 478 | 3,271,616 | 14.6 |
Virginia | 48 | 412 | 8,642,274 | 4.8 |
Vermont | 15 | 85 | 643,077 | 13.2 |
Washington | 49 | 351 | 7,738,692 | 4.5 |
Wisconsin | 38 | 306 | 5,895,908 | 5.2 |
West Virginia | 20 | 115 | 1,793,716 | 6.4 |
Wyoming | 20 | 147 | 576,851 | 25.5 |
These manufacturers are located all around the country, so these numbers are somewhat reflective of population. Unsurprisingly, large states like Texas and Florida have the most licensees.
Sorting by the number of licensees per 100,000 people offers a different point of view. By this measure, Wyoming, Montana, and Idaho come out on top.
If recent sales and production trends are any indication, these numbers may only continue to grow.
Business
The World’s Largest Real Estate Investment Trusts (REITs)
Real estate investment trusts (REITS) are a simple alternative for investors looking to gain exposure to real estate.

The World’s Largest Real Estate Investment Trusts (REITs)
Real estate is widely regarded as an attractive asset class for investors.
This is because it offers several benefits like diversification (due to less correlation with stocks), monthly income, and protection from inflation. The latter is known as “inflation hedging”, and stems from real estate’s tendency to appreciate during periods of rising prices.
Affordability, of course, is a major barrier to investing in most real estate. Property markets around the world have reached bubble territory, making it incredibly difficult for people to get their foot in the door.
Thankfully, there are easier ways of gaining exposure. One of these is purchasing shares in a real estate investment trust (REIT), a type of company that owns and operates income-producing real estate, and is most often publicly-traded.
What Qualifies as REIT?
To qualify as a REIT in the U.S., a company must meet several criteria:
- Invest at least 75% of assets in real estate, cash , or U.S. Treasuries
- Derive at least 75% of gross income from rents, interest on mortgages, or real estate sales
- Pay at least 90% of taxable income in the form of shareholder dividends
- Be a taxable corporation
- Be managed by a board of directors or trustees
- Have at least 100 shareholders after one year of operations
- Have no more than half its shares held by five or fewer people
Investing in a REIT is similar to purchasing shares of any other publicly-traded company. There are also exchange-traded funds (ETFs) and mutual funds which may hold a basket of REITs. Lastly, note that some REITs are private, meaning they aren’t traded on stock exchanges.
The Top 10 by Market Cap
Here are the world’s 10 largest publicly-traded REITs, as of March 25, 2022.
REIT | Market Cap | Dividend Yield | Property Type |
---|---|---|---|
Prologis (NYSE: PLD) | $116.4B | 2.03% | Industrial |
American Tower (NYSE: AMT) | $109.8B | 2.38% | Communications |
Crown Castle (NYSE: CCI | $76.8B | 3.35% | Communications |
Public Storage (NYSE: PSA) | $65.9B | 2.14% | Self-storage |
Equinix (NYSE: EQIX) | $64.4B | 1.74% | Data centers |
Simon Property Group (NYSE: SPG) | $48.9B | 5.07% | Malls |
Welltower (NYSE: WELL) | $43.0B | 2.58% | Healthcare |
Digital Realty (NYSE: DLR) | $40.1B | 3.55% | Data centers |
Realty Income (NYSE: O) | $40.1B | 4.44% | Commercial |
AvalonBay Communities (NYSE: AVB) | $34.6B | 2.62% | Residential |
As shown above, REITs focus on different sectors of the market. Understanding their differences is an important step to consider before making an investment.
For example, Prologis manages the world’s largest portfolio of logistics real estate. This includes warehouses, distribution centers, and other supply chain facilities around the globe. It’s reasonable to assume that this REIT would benefit from further growth in ecommerce—more on this near the end.
Realty Income, on the other hand, owns a portfolio of over 11,100 commercial real estate properties in the U.S. and Europe. It rents these properties out to major brands like Walgreens and 7-Eleven, which together account for 8.1% of the REIT’s annual income.
More Than Just Buildings
Cell towers and data centers may not seem like “real estate”, but they are both critical pieces of modern infrastructure that take up land.
REITs that focus on these sectors include American Tower and Crown Castle, which own wireless communications assets in the U.S. and abroad. They are likely to benefit from the increased adoption of 5G networks and the Internet of Things (IoT).
On the other hand, Equinix and Digital Realty are focused on data centers, a fast growing industry that is benefitting from digitalization. Both of these REITs work with major tech firms such as Amazon and Google.
Trends to Watch
The demand for real estate can be heavily influenced by overarching trends found around the world. One of these is population growth and urbanization, which has drastically pushed up the cost of housing in many cities around the world.
There’s also the rising prevalence of ecommerce, which has triggered a boom in demand for warehouse space. This is best captured by Amazon’s massive growth during the COVID-19 pandemic, during which the company doubled the number of its warehouse facilities.
Globally, ecommerce accounts for just 19.6% of total retail sales. Should that figure continue to rise, industrial real estate prices could be in store for robust, long-term growth.
-
Money2 weeks ago
Mapping the Migration of the World’s Millionaires
-
Markets2 weeks ago
Visualizing the Coming Shift in Global Economic Power (2006-2036p)
-
Datastream3 weeks ago
Ranked: These Are 10 of the World’s Least Affordable Housing Markets
-
Demographics1 week ago
Mapped: A Decade of Population Growth and Decline in U.S. Counties
-
Misc3 weeks ago
Visualizing Well-Known Airlines by Fleet Composition
-
Politics4 weeks ago
Which Countries Trust Their Government, and Which Ones Don’t?
-
Markets4 weeks ago
Ranked: Visualizing the Largest Trading Partners of the U.S.
-
Misc1 week ago
Iconic Infographic Map Compares the World’s Mountains and Rivers