Green
Visualized: The Power of a Sustainable Investment Dollar
Visualizing the Power of a Sustainable Investment Dollar
Sustainable investments are booming.
Between January and November 2020 alone, investments in sustainable ETF and mutual funds grew 96%. The UN Principles of Responsible Investment now has over 3,000 signatories representing over $100 trillion in assets. The U.S. Commodity Futures Trading Commission established a Climate Risk Unit to analyze climate risk across derivative markets, and as of March 2021, new sustainability disclosures have come into effect in Europe.
But how do we know if sustainable investments have made a difference?
To answer this question, the above infographic from MSCI examines the effect of a sustainable investment dollar by looking at real-world examples.
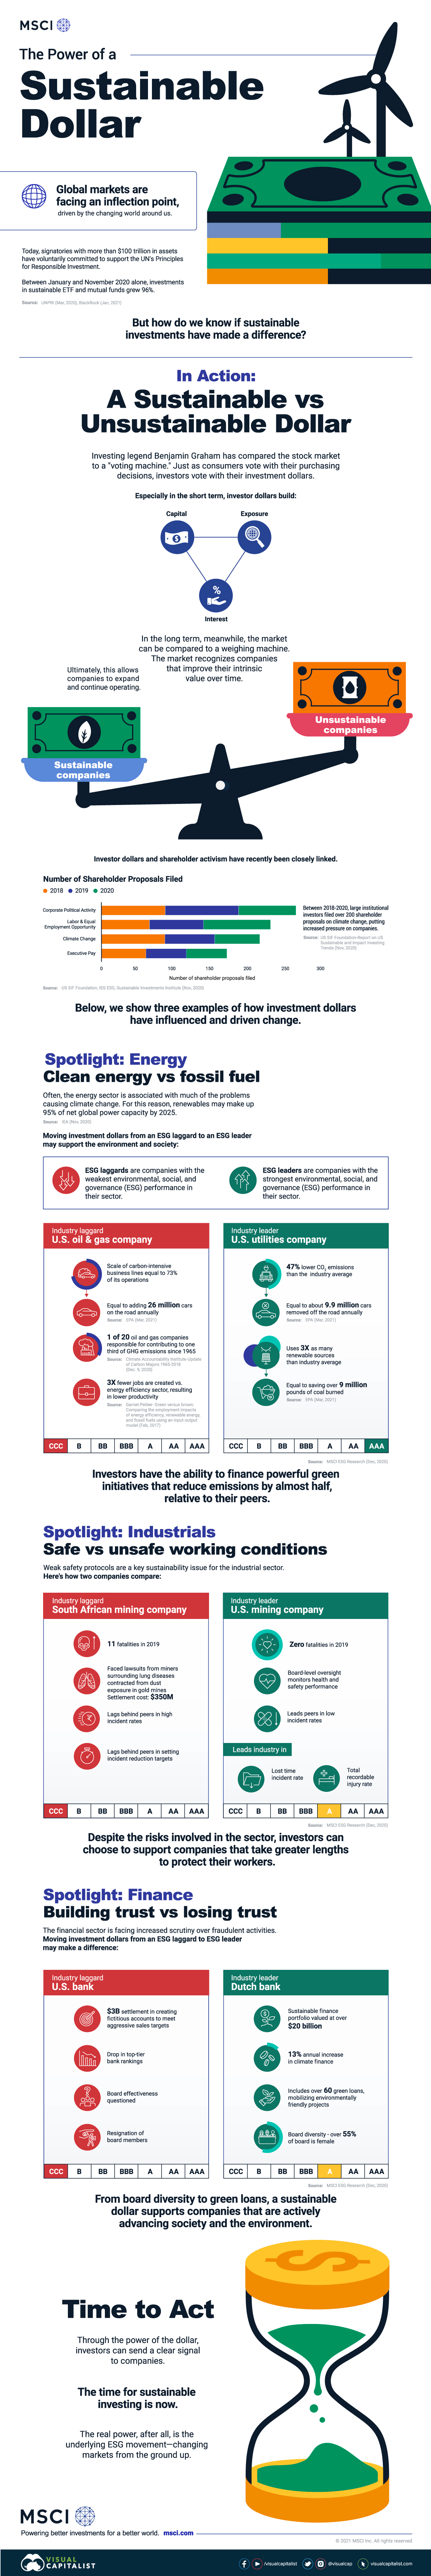
A Sustainable vs. Unsustainable Dollar
To start, investing legend Benjamin Graham has compared the stock market to a “voting machine.” Just as consumers vote with their purchasing decisions, investors vote with their investment dollars. Especially in the short term, as more dollars flow to sustainable companies, this builds their exposure and access to capital.
In the long term, meanwhile, the market can be compared to a weighing machine. The market recognizes companies with profitable business models that improve their intrinsic value over time. Ultimately, this allows sustainable companies to expand and continue operating.
Given the rising momentum in both green assets and climate targets, here is how investment dollars have influenced and driven change across three industries.
1. Clean Energy vs. Fossil Fuel
Over the last several years, the energy sector has been associated with many of the problems causing climate change. For this reason, many investors are seeking out greener energy alternatives. But how does moving investment dollars from an ESG laggard to an ESG leader support the environment and society?
First, here is a brief explainer of ESG laggards and leaders:
- ESG laggards: companies with the weakest environmental, social, and governance (ESG) performance in their sector.
- ESG leaders: companies with the strongest environmental, social, and governance (ESG) performance in their sector.
| Industry laggard: U.S. oil & gas company | Industry leader: U.S. utilities company |
|---|---|
| Scale of carbon-intensive business lines equal to 73% of its operation | 47% lower CO2 emissions than the industry average |
| This is the equivalent of adding 26 million cars on the road annually | This is the equivalent of removing 9.9 million cars off the road annually |
| 1 of 20 oil and gas companies are responsible for contributing to one third of GHG emissions since 1965 | Uses 3X as many renewable sources than industry average |
| 3X fewer jobs are created vs. energy efficient sector, resulting in lower productivity | This is roughly the same as saving over 9 million pounds of coal burned |
| MSCI ESG Rating: CCC | MSCI ESG Rating: AAA |
Source: MSCI ESG Research
Based on the above example, investors have the ability to finance powerful green initiatives that reduce emissions by almost half, relative to their peers.
2. Safe vs. Unsafe Working Conditions
Weak safety protocols are a key sustainability issue for the industrial sector. Here’s how two companies compare:
| Industry laggard: South African mining company | Industry leader: U.S. mining company |
|---|---|
| 11 fatalities in 2019 | Zero fatalities in 2019 |
| Faced lawsuits from miners surrounding lung diseases contracted from dust exposure in gold mines Settlement cost: $350 million | Board-level oversight monitors health and safety performance |
| Lags behind peers in high incident rates | Leads peers in low incident rates |
| Lags behind peers in setting incident reduction targets | Leads industry in lost time incident rate & total recordable injury rate |
| MSCI ESG Rating: CCC | MSCI ESG Rating: A |
Source: MSCI ESG Research
Despite the risks involved in the sector, investors can choose to support companies that take greater precautions to protect their workers.
3. Building Trust vs. Losing Trust
Over the last several years, the financial sector has faced increased scrutiny over fraudulent activities. Moving investment dollars from an ESG laggard to ESG leader may make a difference:
| Industry laggard: U.S. bank | Industry leader: Dutch bank |
|---|---|
| $3 billion settlement in creating fictitious accounts to meet aggressive sales targets | Sustainable finance portfolio valued at over $20 billion |
| Drop in top-tier bank ratings | 13% annual increase in climate finance |
| Board effectiveness questioned | Includes over 60 green loans, mobilizing environmentally friendly projects |
| Resignation of board members | Over 55% of board is female |
| MSCI ESG Rating: CCC | MSCI ESG Rating: A |
Source: MSCI ESG Research
From board diversity to green loans, a sustainable investment dollar supports companies that are actively advancing society and the environment.
Sustainable Investment: The Time to Act
Recently, investor dollars and shareholder activism have been closely linked.
Between 2018 and 2020, large institutional investors filed 217 shareholder proposals on climate change alone, putting increased pressure on companies. Meanwhile, 270 proposals were filed on corporate political activity and 228 on fair labor and equal employment opportunity over the same timeframe. Across all ESG proposals, $2 trillion in assets were pushing for more equitable corporate action.
Through the power of a dollar, investors can send a clear signal to companies: the time for sustainable investing is now.


Green
The Carbon Footprint of Major Travel Methods
Going on a cruise ship and flying domestically are the most carbon-intensive travel methods.


The Carbon Footprint of Major Travel Methods
This was originally posted on our Voronoi app. Download the app for free on iOS or Android and discover incredible data-driven charts from a variety of trusted sources.
Did you know that transport accounts for nearly one-quarter of global energy-related carbon dioxide (CO₂) emissions?
This graphic illustrates the carbon footprints of major travel methods measured in grams of carbon dioxide equivalent (CO₂e) emitted per person to travel one kilometer. This includes both CO₂ and other greenhouse gases.
Data is sourced from Our World in Data, the UK Government’s Department for Energy Security and Net Zero, and The International Council on Clean Transportation, as of December 2022.
These figures should be interpreted as approximations, rather than exact numbers. There are many variables at play that determine the actual carbon footprint in any individual case, including vehicle type or model, occupancy, energy mix, and even weather.
Cruise Ships are the Most Carbon-Intensive Travel Method
According to these estimates, taking a cruise ship, flying domestically, and driving alone are some of the most carbon-intensive travel methods.
Cruise ships typically use heavy fuel oil, which is high in carbon content. The average cruise ship weighs between 70,000 to 180,000 metric tons, meaning they require large engines to get moving.
These massive vessels must also generate power for onboard amenities such as lighting, air conditioning, and entertainment systems.
Short-haul flights are also considered carbon-intensive due to the significant amount of fuel consumed during initial takeoff and climbing altitude, relative to a lower amount of cruising.
| Transportation method | CO₂ equivalent emissions per passenger km |
|---|---|
| Cruise Ship | 250 |
| Short-haul flight (i.e. within a U.S. state or European country) | 246 |
| Diesel car | 171 |
| Gas car | 170 |
| Medium-haul flight (i.e. international travel within Europe, or between U.S. states) | 151 |
| Long-haul flight (over 3,700 km, about the distance from LA to NY) | 147 |
| Motorbike | 113 |
| Bus (average) | 96 |
| Plug-in hybrid | 68 |
| Electric car | 47 |
| National rail | 35 |
| Tram | 28 |
| London Underground | 27 |
| Ferry (foot passenger) | 19 |
| Eurostar (International rail) | 4.5 |
Are EVs Greener?
Many experts agree that EVs produce a lower carbon footprint over time versus traditional internal combustion engine (ICE) vehicles.
However, the batteries in electric vehicles charge on the power that comes straight off the electrical grid—which in many places may be powered by fossil fuels. For that reason, the carbon footprint of an EV will depend largely on the blend of electricity sources used for charging.
There are also questions about how energy-intensive it is to build EVs compared to a comparable ICE vehicle.

-

 Sports1 week ago
The Highest Earning Athletes in Seven Professional Sports
-

 Countries2 weeks ago
Population Projections: The World’s 6 Largest Countries in 2075
-

 Markets2 weeks ago
The Top 10 States by Real GDP Growth in 2023
-

 Demographics2 weeks ago
The Smallest Gender Wage Gaps in OECD Countries
-

 United States2 weeks ago
Where U.S. Inflation Hit the Hardest in March 2024
-

 Green2 weeks ago
Top Countries By Forest Growth Since 2001
-

 United States2 weeks ago
Ranked: The Largest U.S. Corporations by Number of Employees
-

 Maps2 weeks ago
The Largest Earthquakes in the New York Area (1970-2024)