Green
Visualizing the Climate Targets of Fortune 500 Companies
View the full-resolution version of this infographic


Visualized: The Climate Targets of Fortune 500 Companies
View the high-resolution version of this infographic by clicking here
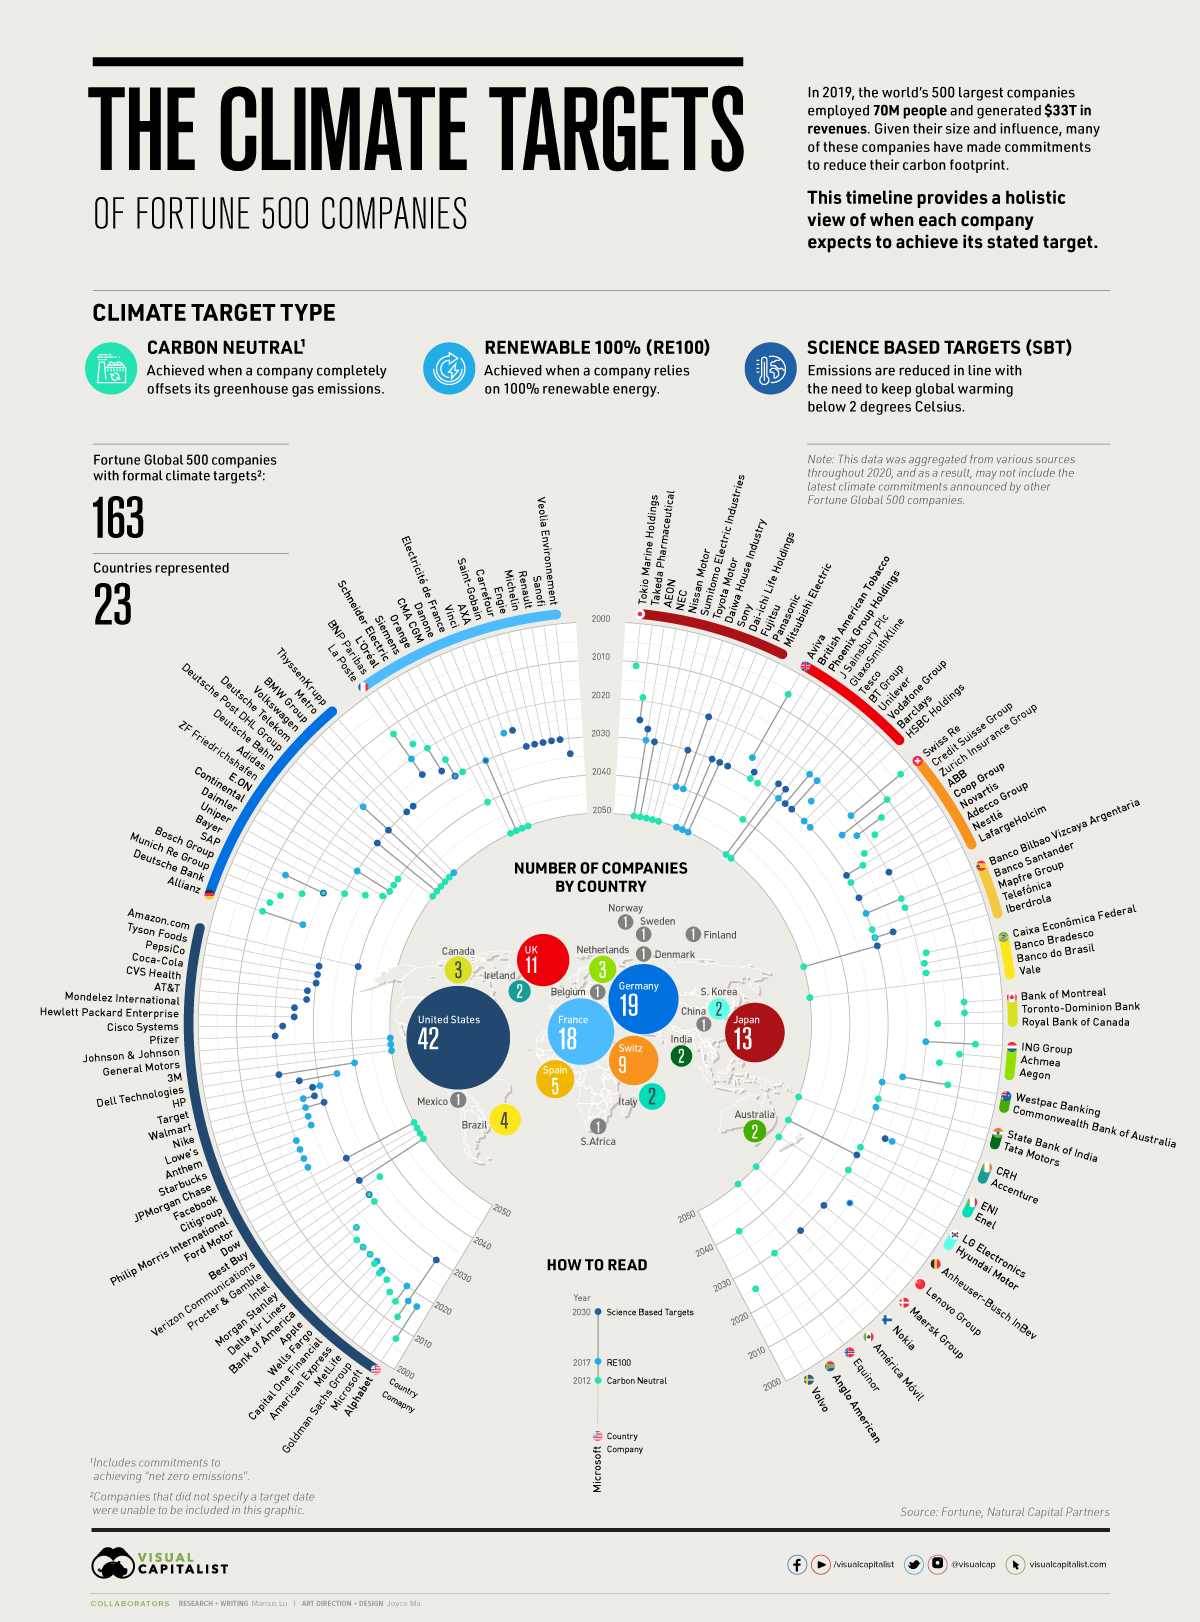
The Fortune Global 500 is a ranking of the world’s 500 largest companies by revenue. In 2019, this influential group employed 70 million people and generated revenues of over $33 trillion.
Given their size and influence, many of these companies are taking climate action quite seriously. For example, 30% of the group have either achieved a climate goal or are publicly committed to doing so by 2030—a significant increase from just 6% in 2016.
In this infographic, we’ve used data from Natural Capital Partners to provide a holistic view of when Fortune Global 500 companies plan to meet their stated climate goals.
Climate Action Takes Several Forms
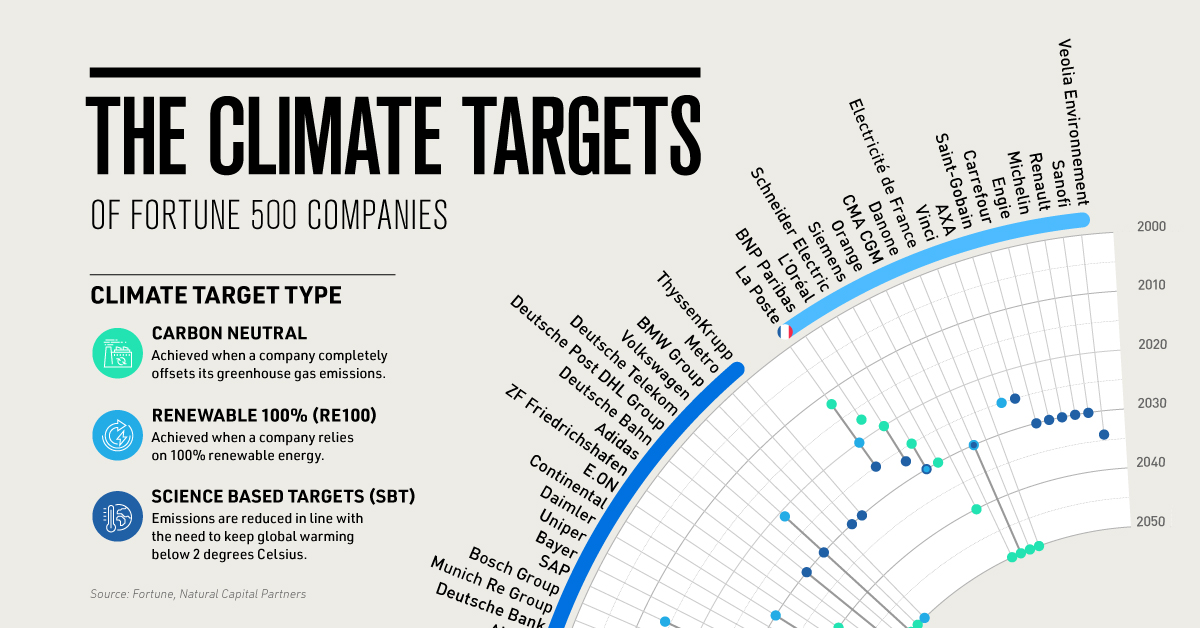
When taking climate action, businesses have a variety of targets they can pursue. Three of the most common ones include carbon neutrality, RE100, and science based targets (SBT).
| Climate target type | Description |
|---|---|
| Carbon neutral | Achieved when a company completely offsets its greenhouse gas (GHG) emissions. |
| RE100 | Achieved when a company relies on 100% renewable energy. |
| Science based targets (SBT) | Emissions are reduced in line with the need to keep global warming below 2ºC. |
After choosing a target, businesses can also set a date for when they intend to achieve it. As the above graphic shows, many companies are targeting 2030, a year that is frequently touted as a deadline for meeting the goals of the Paris Agreement.
A fourth target known as “net zero emissions” is also used, though its exact definition tends to vary. For the purposes of this infographic, we’ve considered a commitment to net zero emissions to be the same as achieving carbon neutrality.
A Complete Overview
The following table summarizes the climate actions of Fortune Global 500 companies. Firms that made commitments without a target date have been noted in the table with a “C”.
| Company Name | Headquarters | Carbon Neutral (target date) | RE100 (target date) | SBT (target date) |
|---|---|---|---|---|
| Commonwealth Bank of Australia | 🇦🇺Australia | 2030 | ||
| Westpac Banking | 🇦🇺Australia | 2013 | 2025 | |
| Woolworths Group | 🇦🇺Australia | C | ||
| Anheuser-Busch InBev | 🇧🇪Belgium | 2025 | 2025 | |
| Banco Bradesco | 🇧🇷Brazil | 2019 | ||
| Banco do Brasil | 🇧🇷Brazil | 2019 | ||
| Caixa Econômica Federal | 🇧🇷Brazil | 2018 | ||
| Vale | 🇧🇷Brazil | 2050 | ||
| Bank of Montreal | 🇨🇦Canada | 2010 | ||
| Royal Bank of Canada | 🇨🇦Canada | 2017 | ||
| Toronto-Dominion Bank | 🇨🇦Canada | 2010 | ||
| Lenovo Group | 🇨🇳China | 2030 | ||
| Xiamen ITG Holding Group | 🇨🇳China | C | ||
| Maersk Group | 🇩🇰Denmark | 2050 | ||
| Nokia | 🇫🇮Finland | 2030 | ||
| Auchan Holding | 🇫🇷France | |||
| AXA | 🇫🇷France | 2025 | ||
| BNP Paribas | 🇫🇷France | 2017 | ||
| Carrefour | 🇫🇷France | 2030 | ||
| CMA CGM | 🇫🇷France | 2050 | ||
| Crédit Agricole | 🇫🇷France | C | ||
| Danone | 🇫🇷France | 2050 | 2030 | 2030 |
| Electricité de France | 🇫🇷France | 2050 | ||
| Engie | 🇫🇷France | 2030 | ||
| L'Oréal | 🇫🇷France | 2020 | 2027 | |
| La Poste | 🇫🇷France | 2012 | 2020 | 2025 |
| Michelin | 🇫🇷France | 2030 | ||
| Orange | 🇫🇷France | 2040 | ||
| Renault | 🇫🇷France | 2030 | ||
| Saint-Gobain | 🇫🇷France | 2025 | ||
| Sanofi | 🇫🇷France | 2030 | ||
| Schneider Electric | 🇫🇷France | 2025 | 2030 | 2030 |
| Siemens | 🇫🇷France | 2030 | ||
| Société Générale | 🇫🇷France | C | ||
| Veolia Environnement | 🇫🇷France | 2034 | ||
| Vinci | 🇫🇷France | 2050 | ||
| Adidas | 🇩🇪Germany | 2050 | ||
| Allianz | 🇩🇪Germany | 2012 | 2023 | |
| Bayer | 🇩🇪Germany | 2030 | ||
| BMW Group | 🇩🇪Germany | 2050 | ||
| Bosch Group | 🇩🇪Germany | 2020 | ||
| Continental | 🇩🇪Germany | 2040 | 2030 | |
| Daimler | 🇩🇪Germany | 2039 | ||
| Deutsche Bahn | 🇩🇪Germany | 2050 | 2030 | |
| Deutsche Bank | 🇩🇪Germany | 2013 | ||
| Deutsche Post DHL Group | 🇩🇪Germany | 2050 | ||
| Deutsche Telekom | 🇩🇪Germany | 2050 | 2021 | 2030 |
| E.ON | 🇩🇪Germany | 2040 | ||
| Metro | 🇩🇪Germany | 2030 | ||
| Munich Re Group | 🇩🇪Germany | 2015 | ||
| SAP | 🇩🇪Germany | 2025 | 2014 | 2025 |
| ThyssenKrupp | 🇩🇪Germany | 2030 | ||
| Uniper | 🇩🇪Germany | 2035 | ||
| Volkswagen | 🇩🇪Germany | 2050 | ||
| ZF Friedrichshafen | 🇩🇪Germany | 2040 | ||
| State Bank of India | 🇮🇳India | 2030 | ||
| Tata Motors | 🇮🇳India | 2030 | ||
| Accenture | 🇮🇪Ireland | 2023 | 2025 | |
| CRH | 🇮🇪Ireland | 2050 | ||
| Johnson Controls International | 🇮🇪Ireland | C | ||
| Enel | 🇮🇹Italy | 2050 | 2030 | |
| ENI | 🇮🇹Italy | 2030 | ||
| AEON | 🇯🇵Japan | 2050 | 2030 | 2027 |
| Dai-ichi Life Holdings | 🇯🇵Japan | 2050 | ||
| Daiwa House Industry | 🇯🇵Japan | 2040 | 2030 | |
| Fujitsu | 🇯🇵Japan | 2050 | 2030 | |
| Hitachi | 🇯🇵Japan | C | ||
| Mitsubishi Electric | 🇯🇵Japan | 2030 | ||
| NEC | 🇯🇵Japan | 2050 | 2030 | |
| Nissan Motor | 🇯🇵Japan | 2050 | ||
| Panasonic | 🇯🇵Japan | 2050 | 2030 | |
| Sompo Holdings | 🇯🇵Japan | C | ||
| Sony | 🇯🇵Japan | 2040 | 2020 | |
| Sumitomo Electric Industries | 🇯🇵Japan | 2050 | ||
| Takeda Pharmaceutical | 🇯🇵Japan | 2019 | 2025 | |
| Tokio Marine Holdings | 🇯🇵Japan | 2011 | ||
| Toshiba | 🇯🇵Japan | |||
| Toyota Motor | 🇯🇵Japan | 2050 | ||
| América Móvil | 🇲🇽Mexico | 2050 | ||
| Achmea | 🇳🇱Netherlands | 2011 | ||
| Aegon | 🇳🇱Netherlands | 2016 | ||
| Heineken Holding | 🇳🇱Netherlands | C | ||
| ING Group | 🇳🇱Netherlands | 2007 | 2020 | |
| Equinor | 🇳🇴Norway | 2030 | ||
| Anglo American | 🇿🇦South Africa | 2040 | ||
| Hyundai Motor | 🇰🇷South Korea | 2050 | ||
| LG Electronics | 🇰🇷South Korea | 2030 | ||
| Banco Bilbao Vizcaya Argentaria | 🇪🇸Spain | 2020 | 2030 | |
| Banco Santander | 🇪🇸Spain | 2020 | ||
| Iberdrola | 🇪🇸Spain | 2050 | 2030 | |
| Inditex | 🇪🇸Spain | C | ||
| Mapfre Group | 🇪🇸Spain | 2030 | ||
| Naturgy Energy Group | 🇪🇸Spain | C | ||
| Telefónica | 🇪🇸Spain | 2030 | 2030 | 2025 |
| Volvo | 🇸🇪Sweden | 2025 | ||
| ABB | 🇨🇭Switzerland | 2018 | ||
| Adecco Group | 🇨🇭Switzerland | 2030 | ||
| Coop Group | 🇨🇭Switzerland | 2023 | ||
| Credit Suisse Group | 🇨🇭Switzerland | 2010 | 2025 | |
| LafargeHolcim | 🇨🇭Switzerland | 2030 | ||
| Migros Group | 🇨🇭Switzerland | C | ||
| Nestlé | 🇨🇭Switzerland | 2020 | ||
| Novartis | 🇨🇭Switzerland | 2025 | 2030 | |
| Swiss Re | 🇨🇭Switzerland | 2003 | 2020 | |
| Zurich Insurance Group | 🇨🇭Switzerland | 2014 | 2022 | |
| Fubon Financial Holding | 🇹🇼Taiwan | C | ||
| PTT | 🇹🇭Thailand | C | ||
| Aviva | 🇬🇧UK | 2006 | 2025 | |
| Barclays | 🇬🇧UK | 2030 | ||
| British American Tobacco | 🇬🇧UK | 2030 | 2028 | |
| BT Group | 🇬🇧UK | 2020 | 2030 | |
| Compass Group | 🇬🇧UK | C | ||
| GlaxoSmithKline | 🇬🇧UK | 2050 | 2027 | |
| HSBC Holdings | 🇬🇧UK | 2030 | ||
| J. Sainsbury | 🇬🇧UK | 2040 | ||
| Linde | 🇬🇧UK | C | ||
| Phoenix Group Holdings | 🇬🇧UK | 2030 | ||
| Tesco | 🇬🇧UK | 2050 | 2030 | 2027 |
| Unilever | 🇬🇧UK | 2020 | 2030 | |
| Vodafone Group | 🇬🇧UK | 2025 | ||
| 3M | 🇺🇸USA | 2050 | ||
| Alphabet | 🇺🇸USA | 2007 | 2017 | |
| Amazon.com | 🇺🇸USA | 2040 | 2025 | 2040 |
| American Express | 🇺🇸USA | 2018 | ||
| Anthem | 🇺🇸USA | 2025 | ||
| Apple | 🇺🇸USA | 2020 | 2020 | |
| AT&T | 🇺🇸USA | 2028 | ||
| Bank of America | 🇺🇸USA | 2020 | 2020 | |
| Best Buy | 🇺🇸USA | 2050 | 2030 | |
| Capital One Financial | 🇺🇸USA | 2018 | 2019 | |
| Cisco Systems | 🇺🇸USA | 2022 | ||
| Citigroup | 🇺🇸USA | 2020 | ||
| Coca-Cola | 🇺🇸USA | 2030 | ||
| CVS Health | 🇺🇸USA | 2028 | ||
| Dell Technologies | 🇺🇸USA | 2040 | 2020 | |
| Delta Air Lines | 🇺🇸USA | 2020 | ||
| Dow | 🇺🇸USA | 2050 | ||
| 🇺🇸USA | 2020 | |||
| Ford Motor | 🇺🇸USA | 2050 | ||
| General Motors | 🇺🇸USA | 2050 | ||
| Goldman Sachs Group | 🇺🇸USA | 2015 | 2020 | |
| Hewlett Packard Enterprise | 🇺🇸USA | 2025 | ||
| HP | 🇺🇸USA | 2035 | 2025 | |
| Intel | 🇺🇸USA | 2030 | ||
| Johnson & Johnson | 🇺🇸USA | 2050 | ||
| JPMorgan Chase | 🇺🇸USA | 2020 | ||
| Lowe's | 🇺🇸USA | 2025 | ||
| MetLife | 🇺🇸USA | 2016 | ||
| Microsoft | 🇺🇸USA | 2012 | 2017 | 2030 |
| Mondelez International | 🇺🇸USA | 2025 | ||
| Morgan Stanley | 🇺🇸USA | 2022 | 2022 | |
| Nike | 🇺🇸USA | 2025 | 2030 | |
| PepsiCo | 🇺🇸USA | 2030 | ||
| Pfizer | 🇺🇸USA | 2020 | ||
| Philip Morris International | 🇺🇸USA | 2050 | 2030 | |
| Procter & Gamble | 🇺🇸USA | 2030 | 2030 | 2030 |
| Schlumberger | 🇺🇸USA | C | ||
| Starbucks | 🇺🇸USA | 2020 | ||
| Target | 🇺🇸USA | 2030 | 2028 | |
| Tyson Foods | 🇺🇸USA | 2030 | ||
| Verizon Communications | 🇺🇸USA | 2035 | ||
| Walmart | 🇺🇸USA | 2025 | 2027 | |
| Wells Fargo | 🇺🇸USA | 2019 | 2020 |
Note: This data was aggregated from various sources throughout 2020, and as a result, may not include the latest climate commitments announced by companies within the Fortune Global 500.
As of October 2020, 163 companies from the Fortune Global 500 have publicly committed to achieving at least one of these climate targets. That represents 32.6% of the total group.
The most common target is carbon neutrality, which has 91 companies on board. In second place is science based targets (SBT), which has 74 companies committed—of those, 16 have not declared a target date. RE100 was the least common, with 56 companies committed. Because some companies are committed to multiple targets, these figures add to more than 163.
Climate Action is on the Rise
Private-sector awareness around climate change and other sustainability issues has gained strong momentum in recent years.
Since 2011, the number of S&P 500 companies publishing sustainability reports increased from 20% in 2011, to 90% in 2019. This was likely due to investor demand and a broader acceptance of environmental, social, and governance (ESG) criteria.
Governments around the world are also taking a more proactive approach to climate action. The Biden administration, for example, seeks to make a $2 trillion investment to help a variety of U.S. industries become more sustainable.
“We have the opportunity to build a more resilient, sustainable economy – one that will put the United States on an irreversible path to achieve net-zero emissions…by no later than 2050.”
– Biden-Harris campaign
America’s goal of reaching net-zero emissions by 2050 is shared with a handful of other advanced economies, including Japan and the EU. The UK has taken these pledges one step further, becoming the first G7 country to pass a law that requires itself to bring emissions to net zero by 2050.


Green
The Carbon Footprint of Major Travel Methods
Going on a cruise ship and flying domestically are the most carbon-intensive travel methods.


The Carbon Footprint of Major Travel Methods
This was originally posted on our Voronoi app. Download the app for free on iOS or Android and discover incredible data-driven charts from a variety of trusted sources.
Did you know that transport accounts for nearly one-quarter of global energy-related carbon dioxide (CO₂) emissions?
This graphic illustrates the carbon footprints of major travel methods measured in grams of carbon dioxide equivalent (CO₂e) emitted per person to travel one kilometer. This includes both CO₂ and other greenhouse gases.
Data is sourced from Our World in Data, the UK Government’s Department for Energy Security and Net Zero, and The International Council on Clean Transportation, as of December 2022.
These figures should be interpreted as approximations, rather than exact numbers. There are many variables at play that determine the actual carbon footprint in any individual case, including vehicle type or model, occupancy, energy mix, and even weather.
Cruise Ships are the Most Carbon-Intensive Travel Method
According to these estimates, taking a cruise ship, flying domestically, and driving alone are some of the most carbon-intensive travel methods.
Cruise ships typically use heavy fuel oil, which is high in carbon content. The average cruise ship weighs between 70,000 to 180,000 metric tons, meaning they require large engines to get moving.
These massive vessels must also generate power for onboard amenities such as lighting, air conditioning, and entertainment systems.
Short-haul flights are also considered carbon-intensive due to the significant amount of fuel consumed during initial takeoff and climbing altitude, relative to a lower amount of cruising.
| Transportation method | CO₂ equivalent emissions per passenger km |
|---|---|
| Cruise Ship | 250 |
| Short-haul flight (i.e. within a U.S. state or European country) | 246 |
| Diesel car | 171 |
| Gas car | 170 |
| Medium-haul flight (i.e. international travel within Europe, or between U.S. states) | 151 |
| Long-haul flight (over 3,700 km, about the distance from LA to NY) | 147 |
| Motorbike | 113 |
| Bus (average) | 96 |
| Plug-in hybrid | 68 |
| Electric car | 47 |
| National rail | 35 |
| Tram | 28 |
| London Underground | 27 |
| Ferry (foot passenger) | 19 |
| Eurostar (International rail) | 4.5 |
Are EVs Greener?
Many experts agree that EVs produce a lower carbon footprint over time versus traditional internal combustion engine (ICE) vehicles.
However, the batteries in electric vehicles charge on the power that comes straight off the electrical grid—which in many places may be powered by fossil fuels. For that reason, the carbon footprint of an EV will depend largely on the blend of electricity sources used for charging.
There are also questions about how energy-intensive it is to build EVs compared to a comparable ICE vehicle.

-

 Education1 week ago
How Hard Is It to Get Into an Ivy League School?
-

 Technology2 weeks ago
Ranked: Semiconductor Companies by Industry Revenue Share
-

 Markets2 weeks ago
Ranked: The World’s Top Flight Routes, by Revenue
-

 Demographics2 weeks ago
Population Projections: The World’s 6 Largest Countries in 2075
-

 Markets2 weeks ago
The Top 10 States by Real GDP Growth in 2023
-

 Demographics2 weeks ago
The Smallest Gender Wage Gaps in OECD Countries
-

 Economy2 weeks ago
Where U.S. Inflation Hit the Hardest in March 2024
-

 Green2 weeks ago
Top Countries By Forest Growth Since 2001