Markets
China’s Economy: 40 Years of Soaring Exports
Animated Chart: 40 Years of Soaring Exports in China
China has the second highest GDP in the world, and it exports 15% of all the world’s goods. But how did this come to be?
A mere 40 years ago, China’s economy was in an entirely different situation, making up less than 1% of global exports and still in the infancy stages of building its economy. The above animated chart from the UNCTAD showcases China’s rise to global trade dominance over time.
Timeline: The Rise to Power
The China of the mid-20th century looks remarkably different when compared to the modern-day nation. Prior to the 1980s, China was going through a period of social upheaval, poverty, and dictatorship under Mao Zedong.
The 1970s
Beginning in the late 1970s, China’s share of global exports stood at less than 1%. The country had few trade hubs and little industry. In 1979, for example, Shenzhen was a city of just around 30,000 inhabitants.
In fact, China (excluding Taiwan* and Hong Kong) did not even show up in the top 10 global exporters until 1997 when it hit a 3.3% share of global exports.
| Year | Share of Global Exports | Rank |
|---|---|---|
| 2000 | 4.0% | #7 |
| 2005 | 7.3% | #3 |
| 2010 | 10.3% | #1 |
| 2015 | 13.7% | #1 |
| 2020 | 14.7% | #1 |
*Editor’s note: The above data comes from the UN, which lists Taiwan as a separate region of China for political reasons.
The 1980s
In the 1980s, several cities and regions, like the Pearl River Delta, were designated as Special Economic Zones. These SEZs had tax incentives that worked to attract foreign investment.
Additionally, in 1989, the Coastal Development Strategy was implemented to use strategic regions along the country’s coast as catalysts for economic development.
The 1990s and Onwards
By the 1990s, the world saw the rise of global value chains and transnational production lines, with China offering a cheap manufacturing hub due to low labor costs.
Rounding out the ‘90s, the Western Development Strategy was implemented in 1999, dubbed the “Open Up the West” program. This program worked to build up infrastructure and education to retain talent in China’s economy, with the goal of attracting further foreign investment.
Finally, China officially joined the World Trade Organization in 2001 which allowed the country to progress full steam ahead.
Made in China
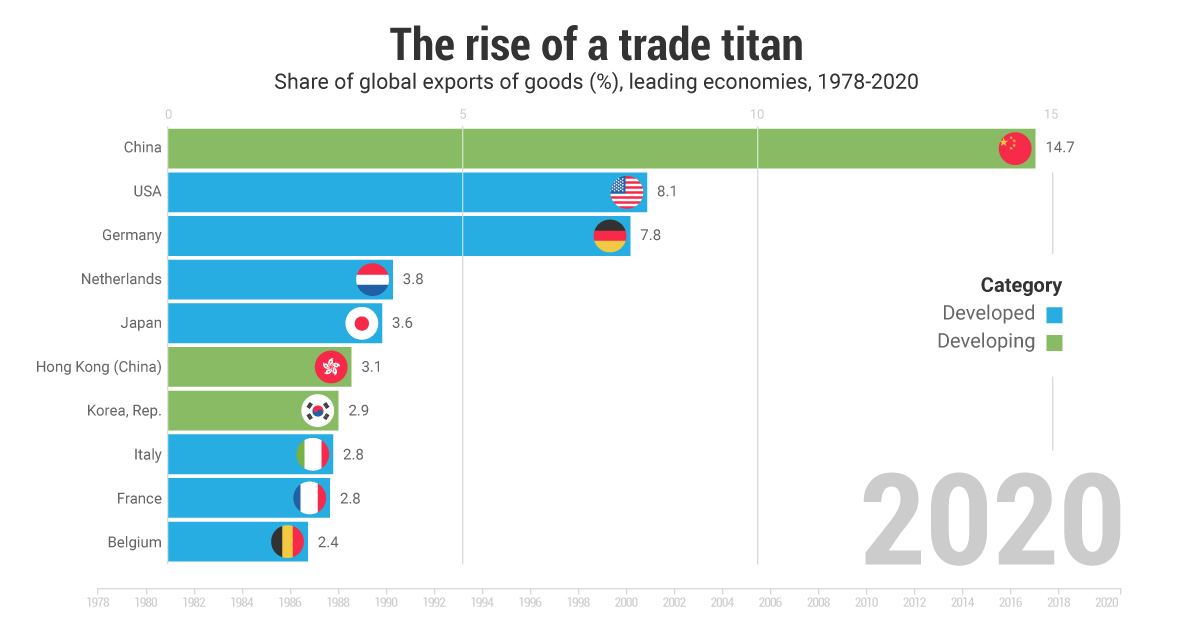
Today China is a trade giant and manufacturing behemoth. Only the U.S. and Germany come close to its share of global exports, sitting at 8.1% and 7.8% respectively.
| Rank | Country | Share of Global Exports (2020) |
|---|---|---|
| #1 | 🇨🇳 China | 14.7% |
| #2 | 🇺🇸 U.S. | 8.1% |
| #3 | 🇩🇪 Germany | 7.8% |
| #4 | 🇳🇱 Netherlands | 3.8% |
| #5 | 🇯🇵 Japan | 3.6% |
| #6 | 🇭🇰 Hong Kong SAR | 3.1% |
| #7 | 🇰🇷 South Korea | 2.9% |
| #8 | 🇮🇹 Italy | 2.8% |
| #9 | 🇫🇷 France | 2.8% |
| #10 | 🇧🇪 Belgium | 2.4% |
China’s manufacturing industry has become dominant in producing just about anything from commonplace household items to integral pieces in automotive manufacturing. Some staples of Chinese manufacturing are:
- Precision instruments
- Semiconductors
- Industrial machinery for computers and smartphones
COVID-19 made China’s integral role in the global economy even more visceral, as major delays in the supply chain occurred when the virus hit the country.
An Economic Superpower
In 2021, China’s trade recovery from the crisis has bested most other countries—in Q1 2021, its exports grew by almost 50% compared to the previous year’s quarter, to around $710 billion.
And the country is not slowing down any time soon. Further plans for economic development are well under way, like Made in China 2025, with the goal of becoming a dominant player in global high-tech manufacturing. Additionally, the famous One Belt, One Road initiative has been funding infrastructure projects globally over the past decade, and the country is also a founding member of the RCEP—which is soon to be the world’s biggest trading bloc.
However, China still faces a series of challenges, such as:
- Population decline
- The onset of labor saving technology
- Trade wars with U.S. and sanctions from other trade partners, like Europe
- The emergence of ASEAN trade powers, like Vietnam
A declining population has many implications like a shrinking workforce and domestic market. Additionally, many companies are setting up shop in less costly manufacturing hubs like Vietnam.
Furthermore, inexpensive innovations in labor-saving technologies, such as robotics and automation, have already begun to undermine the cheap manual labor that has made China the world’s manufacturer.
All of these elements and more could potentially spell a slowing of growth in China’s export dominance. However, while the future for China may not be certain, currently, global trade and production could not function without it.


Markets
The European Stock Market: Attractive Valuations Offer Opportunities
On average, the European stock market has valuations that are nearly 50% lower than U.S. valuations. But how can you access the market?


European Stock Market: Attractive Valuations Offer Opportunities
Europe is known for some established brands, from L’Oréal to Louis Vuitton. However, the European stock market offers additional opportunities that may be lesser known.
The above infographic, sponsored by STOXX, outlines why investors may want to consider European stocks.
Attractive Valuations
Compared to most North American and Asian markets, European stocks offer lower or comparable valuations.
| Index | Price-to-Earnings Ratio | Price-to-Book Ratio |
|---|---|---|
| EURO STOXX 50 | 14.9 | 2.2 |
| STOXX Europe 600 | 14.4 | 2 |
| U.S. | 25.9 | 4.7 |
| Canada | 16.1 | 1.8 |
| Japan | 15.4 | 1.6 |
| Asia Pacific ex. China | 17.1 | 1.8 |
Data as of February 29, 2024. See graphic for full index names. Ratios based on trailing 12 month financials. The price to earnings ratio excludes companies with negative earnings.
On average, European valuations are nearly 50% lower than U.S. valuations, potentially offering an affordable entry point for investors.
Research also shows that lower price ratios have historically led to higher long-term returns.
Market Movements Not Closely Connected
Over the last decade, the European stock market had low-to-moderate correlation with North American and Asian equities.
The below chart shows correlations from February 2014 to February 2024. A value closer to zero indicates low correlation, while a value of one would indicate that two regions are moving in perfect unison.
| EURO STOXX 50 | STOXX EUROPE 600 | U.S. | Canada | Japan | Asia Pacific ex. China |
|
|---|---|---|---|---|---|---|
| EURO STOXX 50 | 1.00 | 0.97 | 0.55 | 0.67 | 0.24 | 0.43 |
| STOXX EUROPE 600 | 1.00 | 0.56 | 0.71 | 0.28 | 0.48 | |
| U.S. | 1.00 | 0.73 | 0.12 | 0.25 | ||
| Canada | 1.00 | 0.22 | 0.40 | |||
| Japan | 1.00 | 0.88 | ||||
| Asia Pacific ex. China | 1.00 |
Data is based on daily USD returns.
European equities had relatively independent market movements from North American and Asian markets. One contributing factor could be the differing sector weights in each market. For instance, technology makes up a quarter of the U.S. market, but health care and industrials dominate the broader European market.
Ultimately, European equities can enhance portfolio diversification and have the potential to mitigate risk for investors.
Tracking the Market
For investors interested in European equities, STOXX offers a variety of flagship indices:
| Index | Description | Market Cap |
|---|---|---|
| STOXX Europe 600 | Pan-regional, broad market | €10.5T |
| STOXX Developed Europe | Pan-regional, broad-market | €9.9T |
| STOXX Europe 600 ESG-X | Pan-regional, broad market, sustainability focus | €9.7T |
| STOXX Europe 50 | Pan-regional, blue-chip | €5.1T |
| EURO STOXX 50 | Eurozone, blue-chip | €3.5T |
Data is as of February 29, 2024. Market cap is free float, which represents the shares that are readily available for public trading on stock exchanges.
The EURO STOXX 50 tracks the Eurozone’s biggest and most traded companies. It also underlies one of the world’s largest ranges of ETFs and mutual funds. As of November 2023, there were €27.3 billion in ETFs and €23.5B in mutual fund assets under management tracking the index.
“For the past 25 years, the EURO STOXX 50 has served as an accurate, reliable and tradable representation of the Eurozone equity market.”
— Axel Lomholt, General Manager at STOXX
Partnering with STOXX to Track the European Stock Market
Are you interested in European equities? STOXX can be a valuable partner:
- Comprehensive, liquid and investable ecosystem
- European heritage, global reach
- Highly sophisticated customization capabilities
- Open architecture approach to using data
- Close partnerships with clients
- Part of ISS STOXX and Deutsche Börse Group
With a full suite of indices, STOXX can help you benchmark against the European stock market.
Learn how STOXX’s European indices offer liquid and effective market access.

-

 Economy3 days ago
Economic Growth Forecasts for G7 and BRICS Countries in 2024
The IMF has released its economic growth forecasts for 2024. How do the G7 and BRICS countries compare?
-

 Markets2 weeks ago
U.S. Debt Interest Payments Reach $1 Trillion
U.S. debt interest payments have surged past the $1 trillion dollar mark, amid high interest rates and an ever-expanding debt burden.
-

 United States2 weeks ago
Ranked: The Largest U.S. Corporations by Number of Employees
We visualized the top U.S. companies by employees, revealing the massive scale of retailers like Walmart, Target, and Home Depot.
-

 Markets2 weeks ago
The Top 10 States by Real GDP Growth in 2023
This graphic shows the states with the highest real GDP growth rate in 2023, largely propelled by the oil and gas boom.
-

 Markets3 weeks ago
Ranked: The World’s Top Flight Routes, by Revenue
In this graphic, we show the highest earning flight routes globally as air travel continued to rebound in 2023.
-

 Markets3 weeks ago
Ranked: The Most Valuable Housing Markets in America
The U.S. residential real estate market is worth a staggering $47.5 trillion. Here are the most valuable housing markets in the country.


-

 Science1 week ago
Visualizing the Average Lifespans of Mammals
-
Markets2 weeks ago
The Top 10 States by Real GDP Growth in 2023
-

 Demographics2 weeks ago
The Smallest Gender Wage Gaps in OECD Countries
-

 United States2 weeks ago
Where U.S. Inflation Hit the Hardest in March 2024
-

 Green2 weeks ago
Top Countries By Forest Growth Since 2001
-
United States2 weeks ago
Ranked: The Largest U.S. Corporations by Number of Employees
-

 Maps2 weeks ago
The Largest Earthquakes in the New York Area (1970-2024)
-

 Green2 weeks ago
Ranked: The Countries With the Most Air Pollution in 2023