China
The Pearl River Delta’s Astonishing Megacity Transformation
View a high resolution version of this graphic
The Pearl River Delta’s Astonishing Megacity Transformation
View the high resolution version of today’s graphic by clicking here.
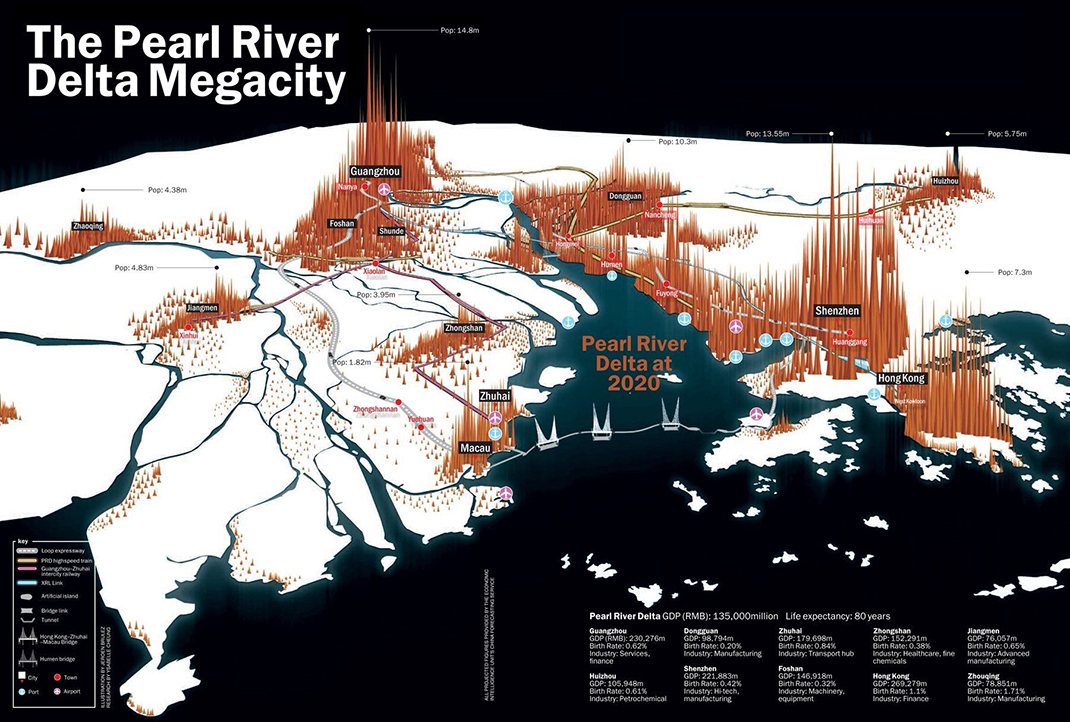
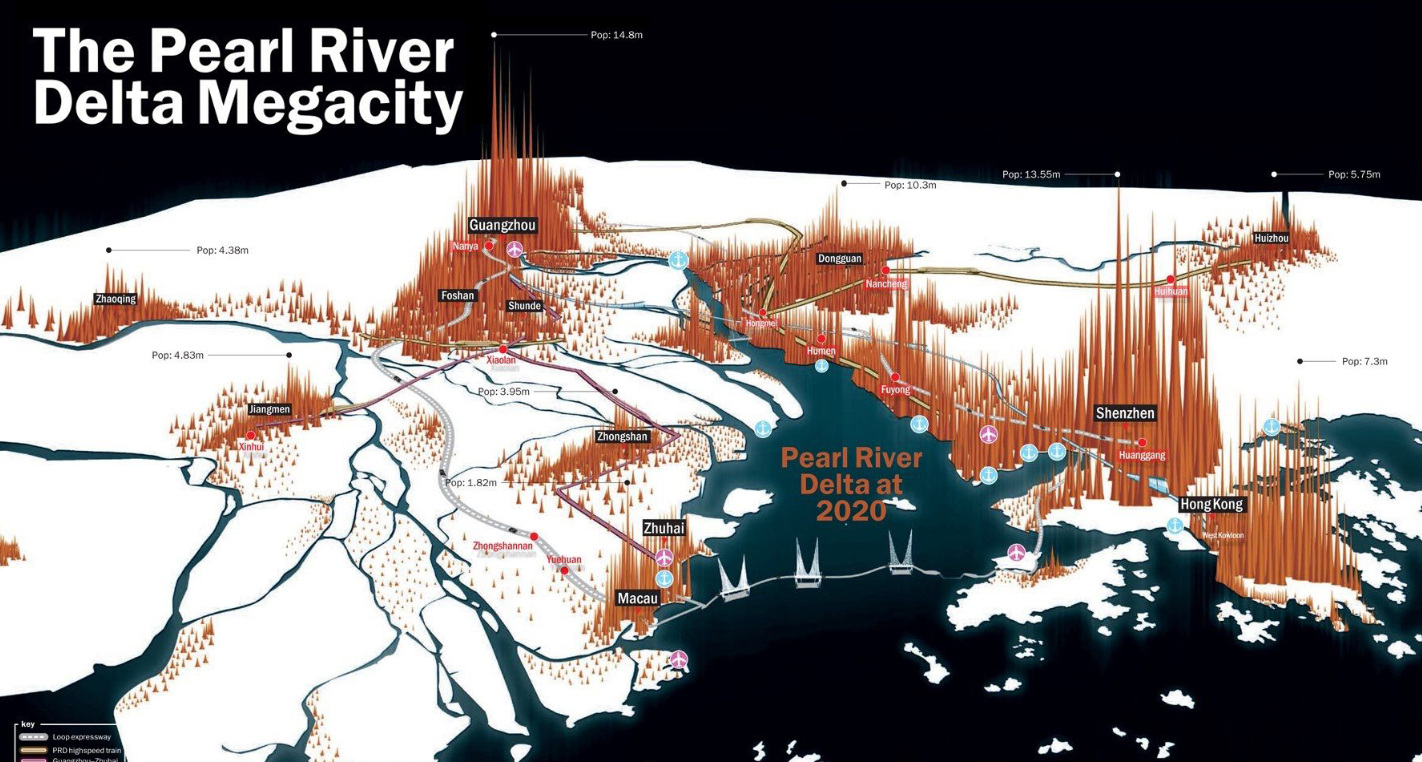
In the late 1970s, the fertile river delta to the north of Hong Kong’s territory was primarily agricultural land. Shenzhen was an unassuming town of 30,000 people – with only one functioning taxi – and China was still very much a communist, rural country.
As the visualization above, by Time Out Hong Kong, demonstrates, the sleepy Pearl River Delta was on the cusp of an unprecedented growth spurt that would see cities expand and merge to become the largest contiguous urban region in the world.
A trickle becomes a flood
In 1979, the Chinese government – led by Deng Xiaoping – created four Special Economic Zones (SEZ) with the intention of attracting foreign direct investment and encouraging private enterprise.
The designation of Shenzhen and Zhuhai as SEZs was a strategic move to act as an “overflow” for businesses in Hong Kong, and the impact on the Pearl River Delta was profound and immediate.
A number of factors also helped contribute to the meteoric rise of the region: proximity to Hong Kong’s financial sector, a world-class seaport, a huge and inexpensive labor pool, cheap and abundant land, and few regulatory impediments to rapidly growing companies.
In the two decades after Deng Xiaoping’s market reforms, the GDP of the region grow by more than 10x and urbanization – bolstered by large-scale infrastructure projects – began in earnest.
To put the scale of this population clustering into perspective, here are the populations of cities within the Pearl River Delta in 2020 compared with modern-day metropolitan areas in North America and Europe:
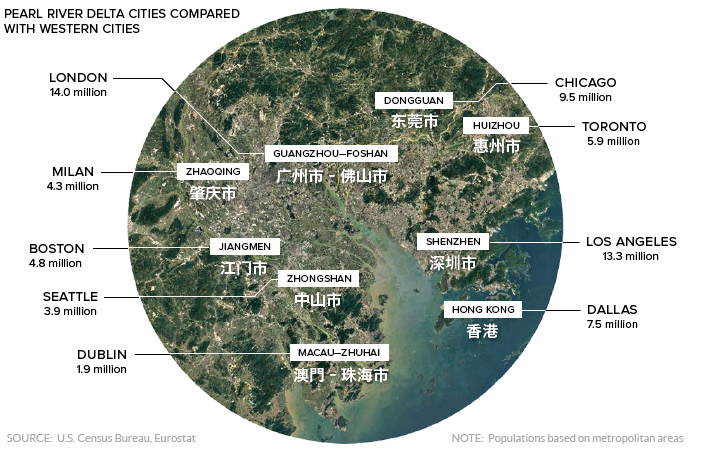
Today, this compact region has a GDP equivalent to that of South Korea.
Megalopolis at the Gates
The explosive growth the Pearl River Delta has upended the regional balance of power.
At the close of the 20th century, Hong Kong was the undisputed economic powerhouse of the region. In fact, just prior to the handover from the United Kingdom to China, the city’s economic output was equal to a quarter of China’s entire GDP.
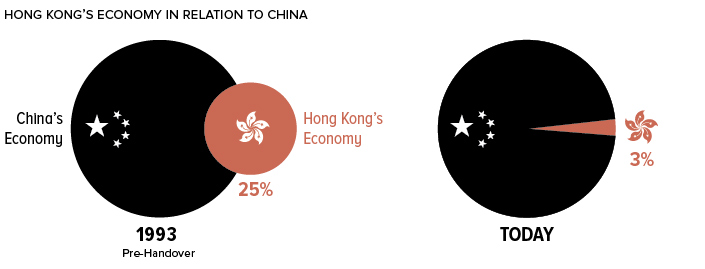
Today, the situation is markedly different. Hong Kong is no longer a separate entity, and its GDP represents a mere 3% of China’s.
This shift in the regional dynamic is causing trepidation in Hong Kong, where over 90% of the millennial population identifies as “Hong Konger” as opposed to “Chinese”. Although the government has agreed in spirit to maintain the city’s autonomy until 2047, recent actions suggest an eagerness to integrate the entire region into a seamless megacity.
The blurring of the lines appears to be well underway, as more than half a million people from the city now reside in Mainland China, up from approximately 150,000 a decade ago.
One physical manifestation of Mainland China’s push for an integrated region is the Hong Kong–Zhuhai–Macau Bridge. This colossal infrastructure project is a 31 mile (50 km) connection that includes bridges, tunnels, and three man-made islands.
In China, where each project is more ambitious than the next, it’s only fitting that the world’s largest urban area will be connected by the world’s largest sea crossing.


Markets
China’s Real Estate Crisis, Shown in Two Charts
These charts show China’s real estate boom in the 21st century and the subsequent slowdown since 2022.
Visualizing China’s Real Estate Boom and Crisis
This was originally posted on our Voronoi app. Download the app for free on iOS or Android and discover incredible data-driven charts from a variety of trusted sources.
Evergrande—once China’s largest real estate developer—was forced to liquidate on January 28th. It was yet another strike against the country’s now fledgling real estate market, adding to a growing list of China’s economic worries.
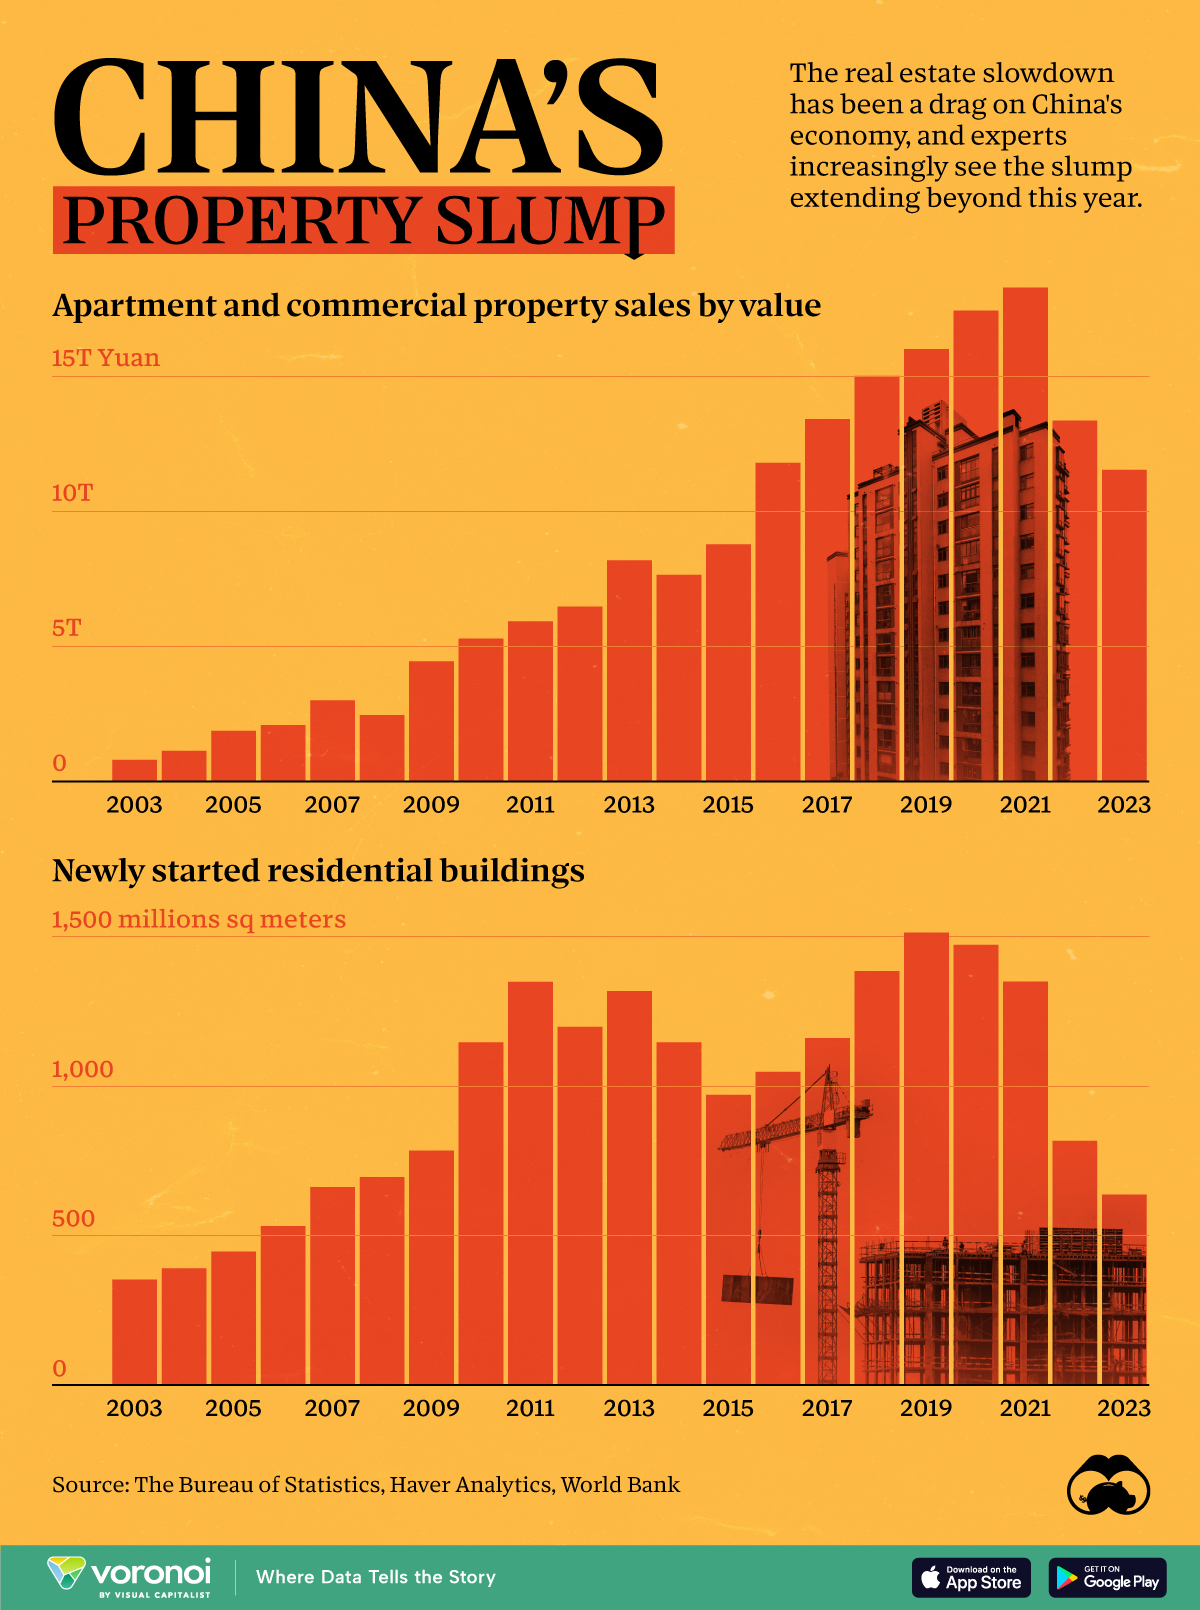
In the charts above we show two annual metrics related to China’s real estate crisis from 2003 to 2023. The first looks at apartment and commercial property sales using Burreau of Statistics data from Bloomberg, and the second examines new housing starts using data from the World Bank.
Things to Know About China’s Property Slump
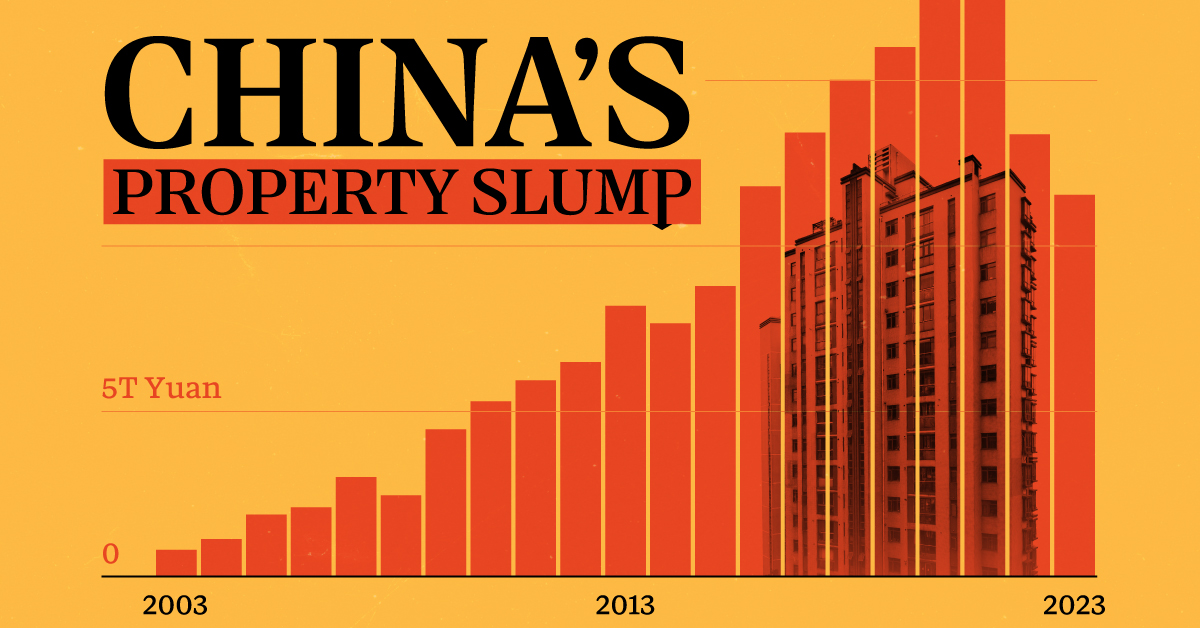
Property sales by value in China climbed pretty steadily from less than ¥1 trillion RMB in 2003 to over ¥15 trillion in 2021, but have since dropped to under ¥12 trillion in 2023.
This was the case across both residential and commercial sales. In China’s residential market specifically, new home sales dropped 6% in 2023, with secondhand home prices declining in major cities.
And on the development side, new residential developments have fallen 58% from 1,515 million m² in 2019 to 637 million m² in 2023.
| Year | New Residential Building Developments (million sq meters) |
|---|---|
| 2023 | 637.4 |
| 2022 | 817.3 |
| 2021 | 1,350.2 |
| 2020 | 1,473.4 |
| 2019 | 1,514.5 |
| 2018 | 1,385.4 |
| 2017 | 1,160.9 |
| 2016 | 1,047.8 |
| 2015 | 970.8 |
| 2014 | 1,146.4 |
| 2013 | 1,318.5 |
| 2012 | 1,199.1 |
| 2011 | 1,349.4 |
| 2010 | 1,147.2 |
| 2009 | 784.9 |
| 2008 | 695.4 |
| 2007 | 662.3 |
| 2006 | 531.8 |
| 2005 | 446.5 |
| 2004 | 390.0 |
| 2003 | 352.4 |
| 2002 | 276.5 |
Here are a few more things to know about the ongoing real estate crisis in China:
- Developer Defaults: Real estate firms faced $125 billion in bond defaults between 2020 and 2023.
- Economic Impact: The property sector’s slump has dragged down China’s economy, leading to layoffs and financial instability.
- Getting Creative: Municipalities, many of which rely on land sales as a key source of income, have been introducing “old-for-new” support measures meant to stimulate new home purchases.
Experts predict a prolonged downturn, with many people souring on Chinese investments, but exactly how things will develop after Evergrande’s collapse is unclear.

-

 Markets1 week ago
U.S. Debt Interest Payments Reach $1 Trillion
-

 Markets2 weeks ago
Ranked: The Most Valuable Housing Markets in America
-

 Money2 weeks ago
Which States Have the Highest Minimum Wage in America?
-

 AI2 weeks ago
Ranked: Semiconductor Companies by Industry Revenue Share
-

 Markets2 weeks ago
Ranked: The World’s Top Flight Routes, by Revenue
-

 Countries2 weeks ago
Population Projections: The World’s 6 Largest Countries in 2075
-

 Markets2 weeks ago
The Top 10 States by Real GDP Growth in 2023
-

 Money2 weeks ago
The Smallest Gender Wage Gaps in OECD Countries