Datastream
Risk On: $45 Billion Injected Into Stock Market Funds In One Week
The Briefing
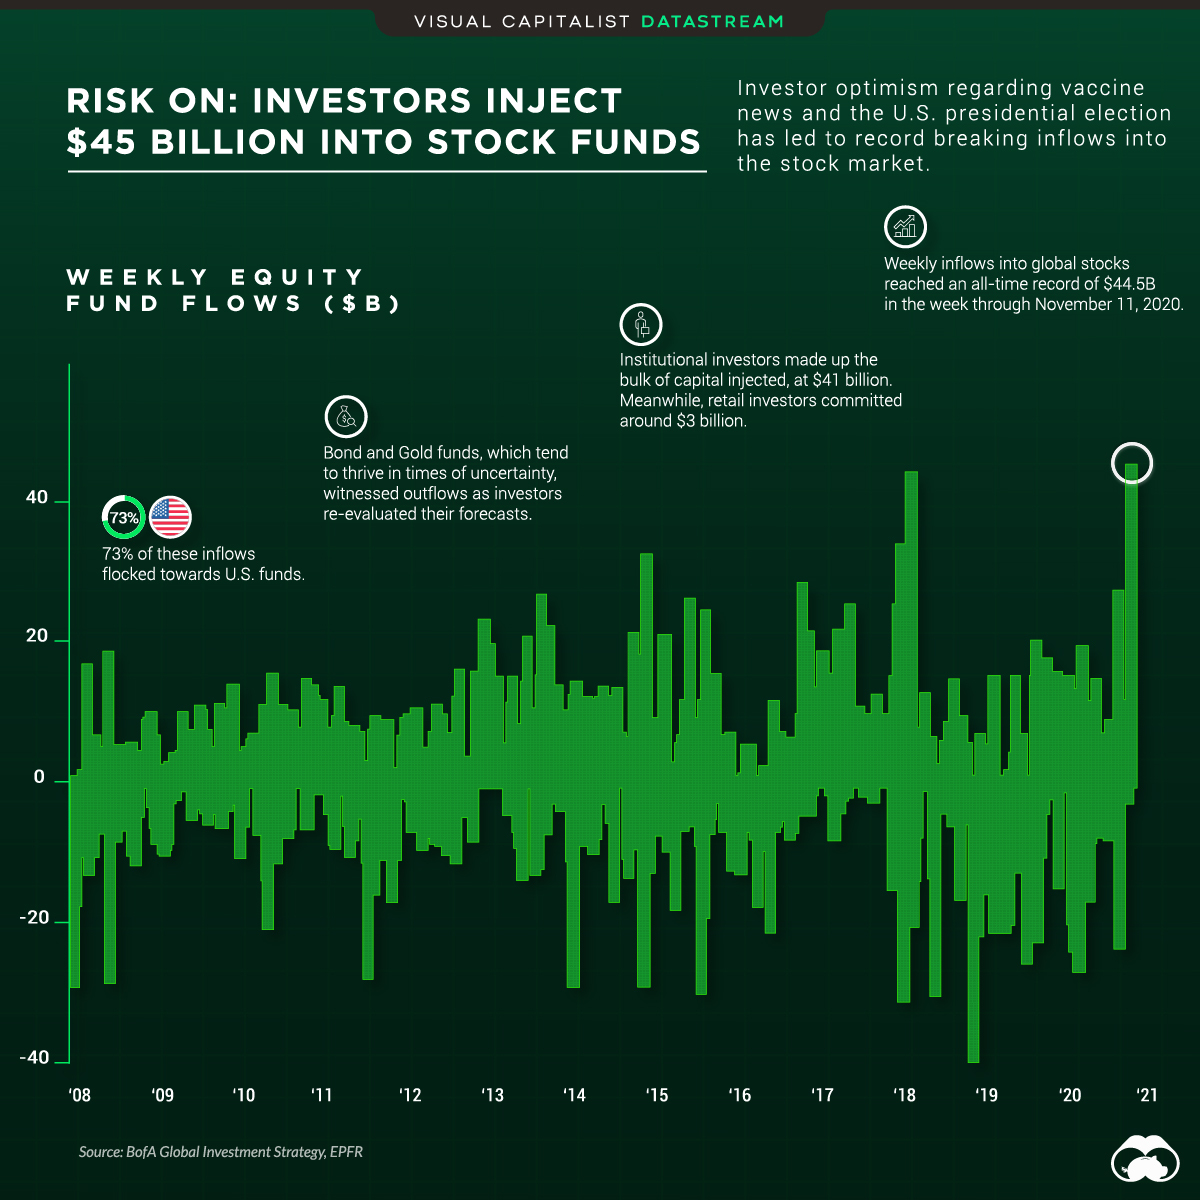
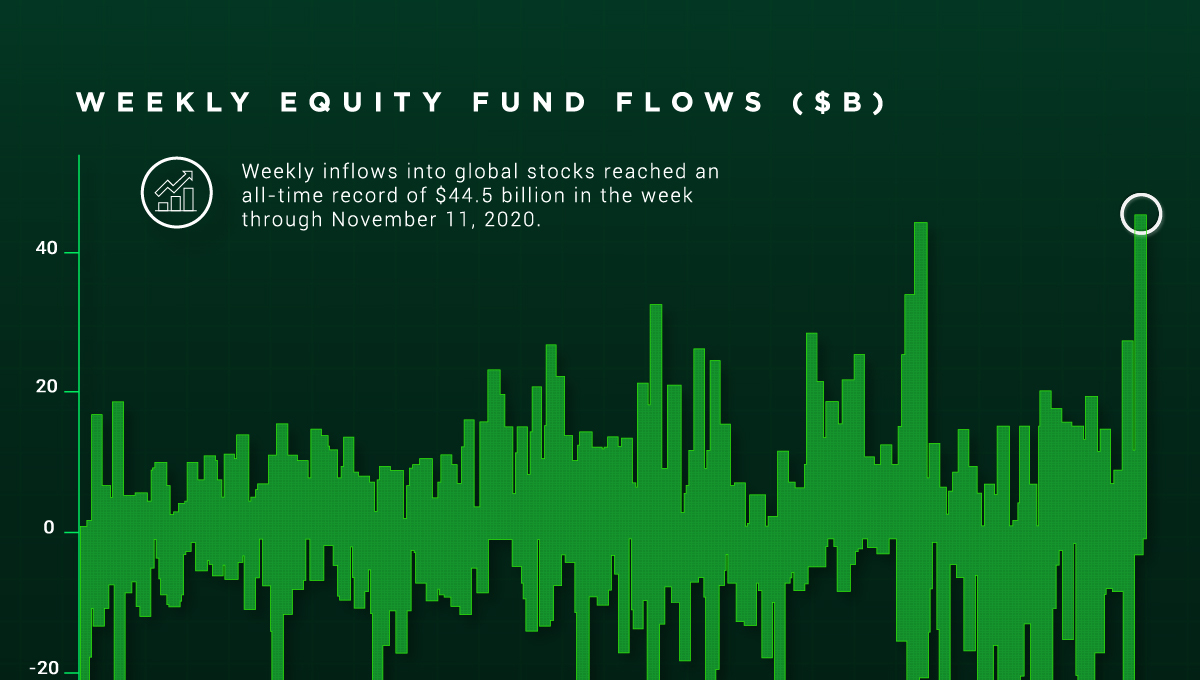
- The end of 2020 witnessed a $44.5 billion weekly inflow into stock funds, a historic high
- Diminishing uncertainty around the pandemic and U.S. presidential election are contributing factors to this increased investor appetite
Risk On, Risk Off
Few events can grasp the world’s attention in the same manner the pandemic and U.S. presidential election have. This attention also sparks conflict and discord—and thus, for some time, they’ve been identifiable risks as it pertains to financial markets.
The uncertainty that arises in relation to these two events is subsiding. The election is over and the roll out of vaccines has commenced.
For Wall Street and their forward looking estimates, greener pastures appear to be on the horizon. As a result, this has translated into record-breaking inflows into stock market funds near the end of 2020.
Stock Market Funds
In the week through November 11, 2020, $44.5 billion of stock market inflows were injected into markets through various funds—the largest weekly inflow into equity funds ever recorded.
The appetite for risk is also reflected in the options market, where call option volume is breaking all-time highs.
Taking a step back, here are the funds with the largest inflows in 2020:
| Ticker | Fund Name | 2020 Net Inflows ($ Millions) |
|---|---|---|
| VTI | Vanguard Total Stock Market ETF | $32,623 |
| VOO | Vanguard S&P 500 ETF | $21,431 |
| BND | Vanguard Total Bond Market ETF | $17,217 |
| QQQ | Invesco QQQ Trust | $16,733 |
| VXUS | Vanguard Total International Stock ETF | $16,002 |
| GLD | SPDR Gold Trust | $15,129 |
| LQD | iShares iBoxx USD Investment Grade Corporate Bond ETF | $15,020 |
| VCIT | Vanguard Intermediate-Term Corporate Bond ETF | $14,790 |
| AGG | iShares Core U.S. Aggregate Bond ETF | $12,475 |
| BNDX | Vanguard Total International Bond ETF | $11,929 |
One Funds Inflow Is Another Funds Outflow
Gold and fixed income, which tend to thrive in times of uncertainty, saw net outflows during the same week. Fixed income in particular has fared worse. The spread between U.S. bond and U.S. stock ETFs is widening, with almost $3 trillion more dollars in stock funds.
As Wall Street re-evaluates for rosier forecasts ahead, this may further widen the growing gap between these respective assets. Despite a volatile year where markets whipsawed, the S&P 500 finished 2020 up 16%, a boost from its historical average of 10-11%.
Where does this data come from?
Source: BofA Investment Strategies
Notes: Financial Data is for the week through November 11, 2020


Datastream
Can You Calculate Your Daily Carbon Footprint?
Discover how the average person’s carbon footprint impacts the environment and learn how carbon credits can offset your carbon footprint.


The Briefing
- A person’s carbon footprint is substantial, with activities such as food consumption creating as much as 4,500 g of CO₂ emissions daily.
- By purchasing carbon credits from Carbon Streaming Corporation, you can offset your own emissions and fund positive climate action.
Your Everyday Carbon Footprint
While many large businesses and countries have committed to net-zero goals, it is essential to acknowledge that your everyday activities also contribute to global emissions.
In this graphic, sponsored by Carbon Streaming Corporation, we will explore how the choices we make and the products we use have a profound impact on our carbon footprint.
Carbon Emissions by Activity
Here are some of the daily activities and products of the average person and their carbon footprint, according to Clever Carbon.
| Household Activities & Products | CO2 Emissions (g) |
|---|---|
| 💡 Standard Light Bulb (100 watts, four hours) | 172 g |
| 📱 Mobile Phone Use (195 minutes per day)* | 189 g |
| 👕 Washing Machine (0.63 kWh) | 275 g |
| 🔥 Electric Oven (1.56 kWh) | 675 g |
| ♨️ Tumble Dryer (2.5 kWh) | 1,000 g |
| 🧻 Toilet Roll (2 ply) | 1,300 g |
| 🚿 Hot Shower (10 mins) | 2,000 g |
| 🚙 Daily Commute (one hour, by car) | 3,360 g |
| 🍽️ Average Daily Food Consumption (three meals of 600 calories) | 4,500 g |
| *Phone use based on yearly use of 69kg per the source, Reboxed | |
Your choice of transportation plays a crucial role in determining your carbon footprint. For instance, a 15 km daily commute to work on public transport generates an average of 1,464 g of CO₂ emissions. Compared to 3,360 g—twice the volume for a journey the same length by car.
By opting for more sustainable modes of transport, such as cycling, walking, or public transportation, you can significantly reduce your carbon footprint.
Addressing Your Carbon Footprint
One way to compensate for your emissions is by purchasing high-quality carbon credits.
Carbon credits are used to help fund projects that avoid, reduce or remove CO₂ emissions. This includes nature-based solutions such as reforestation and improved forest management, or technology-based solutions such as the production of biochar and carbon capture and storage (CCS).
While carbon credits offer a potential solution for individuals to help reduce global emissions, public awareness remains a significant challenge. A BCG-Patch survey revealed that only 34% of U.S. consumers are familiar with carbon credits, and only 3% have purchased them in the past.
About Carbon Streaming
By financing the creation or expansion of carbon projects, Carbon Streaming Corporation secures the rights to future carbon credits generated by these sustainable projects. You can then purchase these carbon credits to help fund climate solutions around the world and compensate for your own emissions.
Ready to get involved?
>> Learn more about purchasing carbon credits at Carbon Streaming

-

 Energy1 week ago
The World’s Biggest Nuclear Energy Producers
-

 Money2 weeks ago
Which States Have the Highest Minimum Wage in America?
-

 Technology2 weeks ago
Ranked: Semiconductor Companies by Industry Revenue Share
-

 Markets2 weeks ago
Ranked: The World’s Top Flight Routes, by Revenue
-

 Demographics2 weeks ago
Population Projections: The World’s 6 Largest Countries in 2075
-

 Markets2 weeks ago
The Top 10 States by Real GDP Growth in 2023
-

 Demographics2 weeks ago
The Smallest Gender Wage Gaps in OECD Countries
-

 Economy2 weeks ago
Where U.S. Inflation Hit the Hardest in March 2024