Datastream
Comparing Bitcoin’s Market Cap to Other Cryptocurrencies
The Briefing
- In the cryptocurrency world, Bitcoin has consistently held the top spot when it comes to overall market capitalization
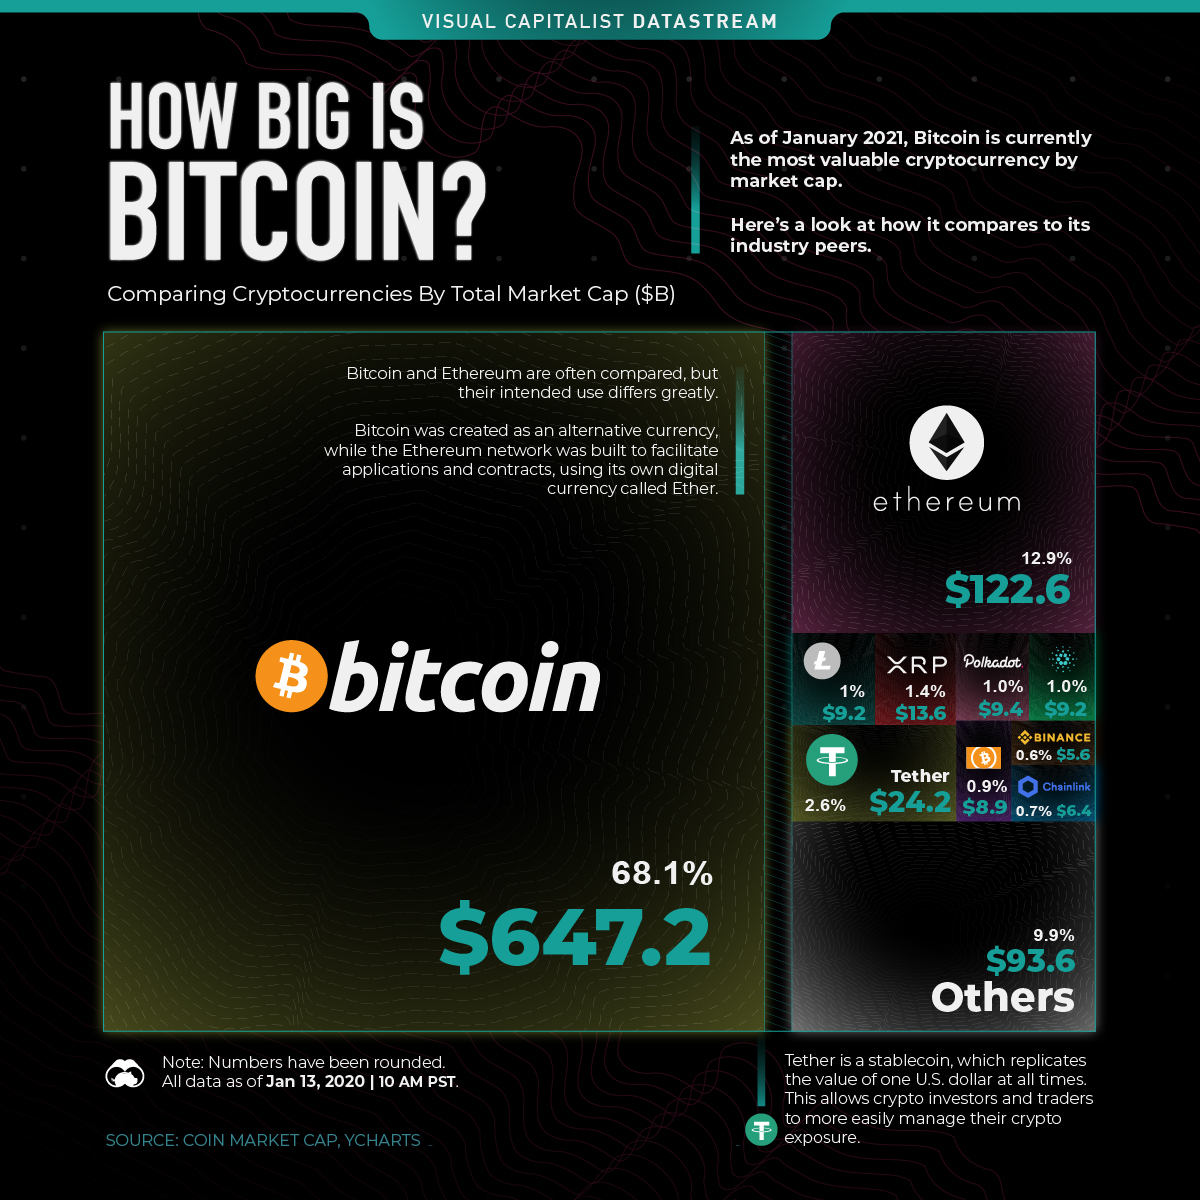
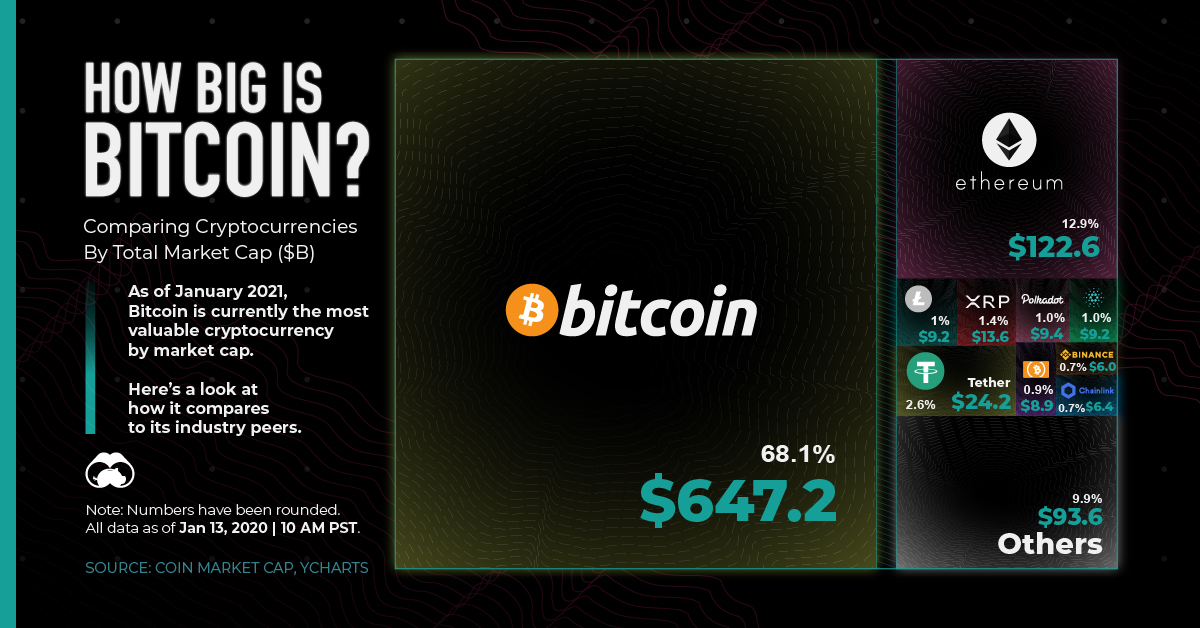
- As of January 13, 2021, Bitcoin currently captures around 68% of the cryptocurrency market. Ethereum comes in second, making up almost 13% of total market cap
Bitcoin—it’s volatile and valuable, and it’s also in vogue for traders around the world.
Even after a recent 15% drop, Bitcoin still makes up about 68% of the cryptocurrency market. This means that currently, Bitcoin’s market cap is greater than all other altcoins combined:
| Cryptocurrency | Market Cap (Billions) | % of Total Market |
|---|---|---|
| Bitcoin | $647.2 | 68.1% |
| Ethereum | $122.6 | 12.9% |
| Tether | $24.2 | 2.6% |
| Litecoin | $9.2 | 1.0% |
| XRP | $13.6 | 1.4% |
| Polkadot | $9.4 | 1.0% |
| Cardano | $9.2 | 1.0% |
| Bitcoin Cash | $8.9 | 0.9% |
| Binance Coin | $5.6 | 0.6% |
| Chainlink | $6.4 | 0.7% |
| Others | $93.6 | 9.9% |
| Total | $950.0 | 100% |
*Note: Figures have been rounded.
This hasn’t always been the case for Bitcoin—in fact, its market share was a mere 32.8%, back in January 2018. However, within a year it had captured the majority of the market again. And ever since, it’s held a relatively stable piece of the pie.
Why does Bitcoin Have a Greater Market Value?
How has Bitcoin managed to remain top dog in the cryptocurrency market throughout the years? There are a few likely reasons:
- It’s built a solid reputation
Bitcoin was the first cryptocurrency on the scene, giving it a first-mover advantage. This is a fancy way of saying that the early bird gets the worm—or in Bitcoin’s case, media attention and investor trust. - There’s a finite supply
The world’s supply of Bitcoin maxes out at 21 million, and about 18.5 million are currently in circulation. This scarcity ideally increases its value over time. Other cryptocurrencies, like Ethereum’s coin Ether, are currently limitless. - It’s more accessible than other cryptocurrencies
Bitcoin has a much larger ecosystem than other cryptocurrencies. Because it has more applications and merchants that accept it, it’s more convenient than other digital coins.
Should We Even Compare Cryptocurrencies?
Not all crypto assets have the same intended use. For instance, the Ethereum network was created primarily to facilitate decentralized applications and smart contracts.
So, while it’s interesting to compare Bitcoin’s market cap to other coins, it’s important to remember that they’re not necessarily direct competitors—and success for one doesn’t necessarily mean the death of others.
Where does this data come from?
Source: Coin Market Cap (link)


Datastream
Can You Calculate Your Daily Carbon Footprint?
Discover how the average person’s carbon footprint impacts the environment and learn how carbon credits can offset your carbon footprint.


The Briefing
- A person’s carbon footprint is substantial, with activities such as food consumption creating as much as 4,500 g of CO₂ emissions daily.
- By purchasing carbon credits from Carbon Streaming Corporation, you can offset your own emissions and fund positive climate action.
Your Everyday Carbon Footprint
While many large businesses and countries have committed to net-zero goals, it is essential to acknowledge that your everyday activities also contribute to global emissions.
In this graphic, sponsored by Carbon Streaming Corporation, we will explore how the choices we make and the products we use have a profound impact on our carbon footprint.
Carbon Emissions by Activity
Here are some of the daily activities and products of the average person and their carbon footprint, according to Clever Carbon.
| Household Activities & Products | CO2 Emissions (g) |
|---|---|
| 💡 Standard Light Bulb (100 watts, four hours) | 172 g |
| 📱 Mobile Phone Use (195 minutes per day)* | 189 g |
| 👕 Washing Machine (0.63 kWh) | 275 g |
| 🔥 Electric Oven (1.56 kWh) | 675 g |
| ♨️ Tumble Dryer (2.5 kWh) | 1,000 g |
| 🧻 Toilet Roll (2 ply) | 1,300 g |
| 🚿 Hot Shower (10 mins) | 2,000 g |
| 🚙 Daily Commute (one hour, by car) | 3,360 g |
| 🍽️ Average Daily Food Consumption (three meals of 600 calories) | 4,500 g |
| *Phone use based on yearly use of 69kg per the source, Reboxed | |
Your choice of transportation plays a crucial role in determining your carbon footprint. For instance, a 15 km daily commute to work on public transport generates an average of 1,464 g of CO₂ emissions. Compared to 3,360 g—twice the volume for a journey the same length by car.
By opting for more sustainable modes of transport, such as cycling, walking, or public transportation, you can significantly reduce your carbon footprint.
Addressing Your Carbon Footprint
One way to compensate for your emissions is by purchasing high-quality carbon credits.
Carbon credits are used to help fund projects that avoid, reduce or remove CO₂ emissions. This includes nature-based solutions such as reforestation and improved forest management, or technology-based solutions such as the production of biochar and carbon capture and storage (CCS).
While carbon credits offer a potential solution for individuals to help reduce global emissions, public awareness remains a significant challenge. A BCG-Patch survey revealed that only 34% of U.S. consumers are familiar with carbon credits, and only 3% have purchased them in the past.
About Carbon Streaming
By financing the creation or expansion of carbon projects, Carbon Streaming Corporation secures the rights to future carbon credits generated by these sustainable projects. You can then purchase these carbon credits to help fund climate solutions around the world and compensate for your own emissions.
Ready to get involved?
>> Learn more about purchasing carbon credits at Carbon Streaming

-

 Money2 weeks ago
Which States Have the Highest Minimum Wage in America?
-

 Misc1 week ago
Airline Incidents: How Do Boeing and Airbus Compare?
-

 Environment1 week ago
Top Countries By Forest Growth Since 2001
-

 United States2 weeks ago
Where U.S. Inflation Hit the Hardest in March 2024
-

 Demographics2 weeks ago
The Smallest Gender Wage Gaps in OECD Countries
-

 Markets2 weeks ago
The Top 10 States by Real GDP Growth in 2023
-

 Countries2 weeks ago
Population Projections: The World’s 6 Largest Countries in 2075
-

 Travel2 weeks ago
Ranked: The World’s Top Flight Routes, by Revenue