Datastream
The World’s 10 Largest Stock Markets
The Briefing
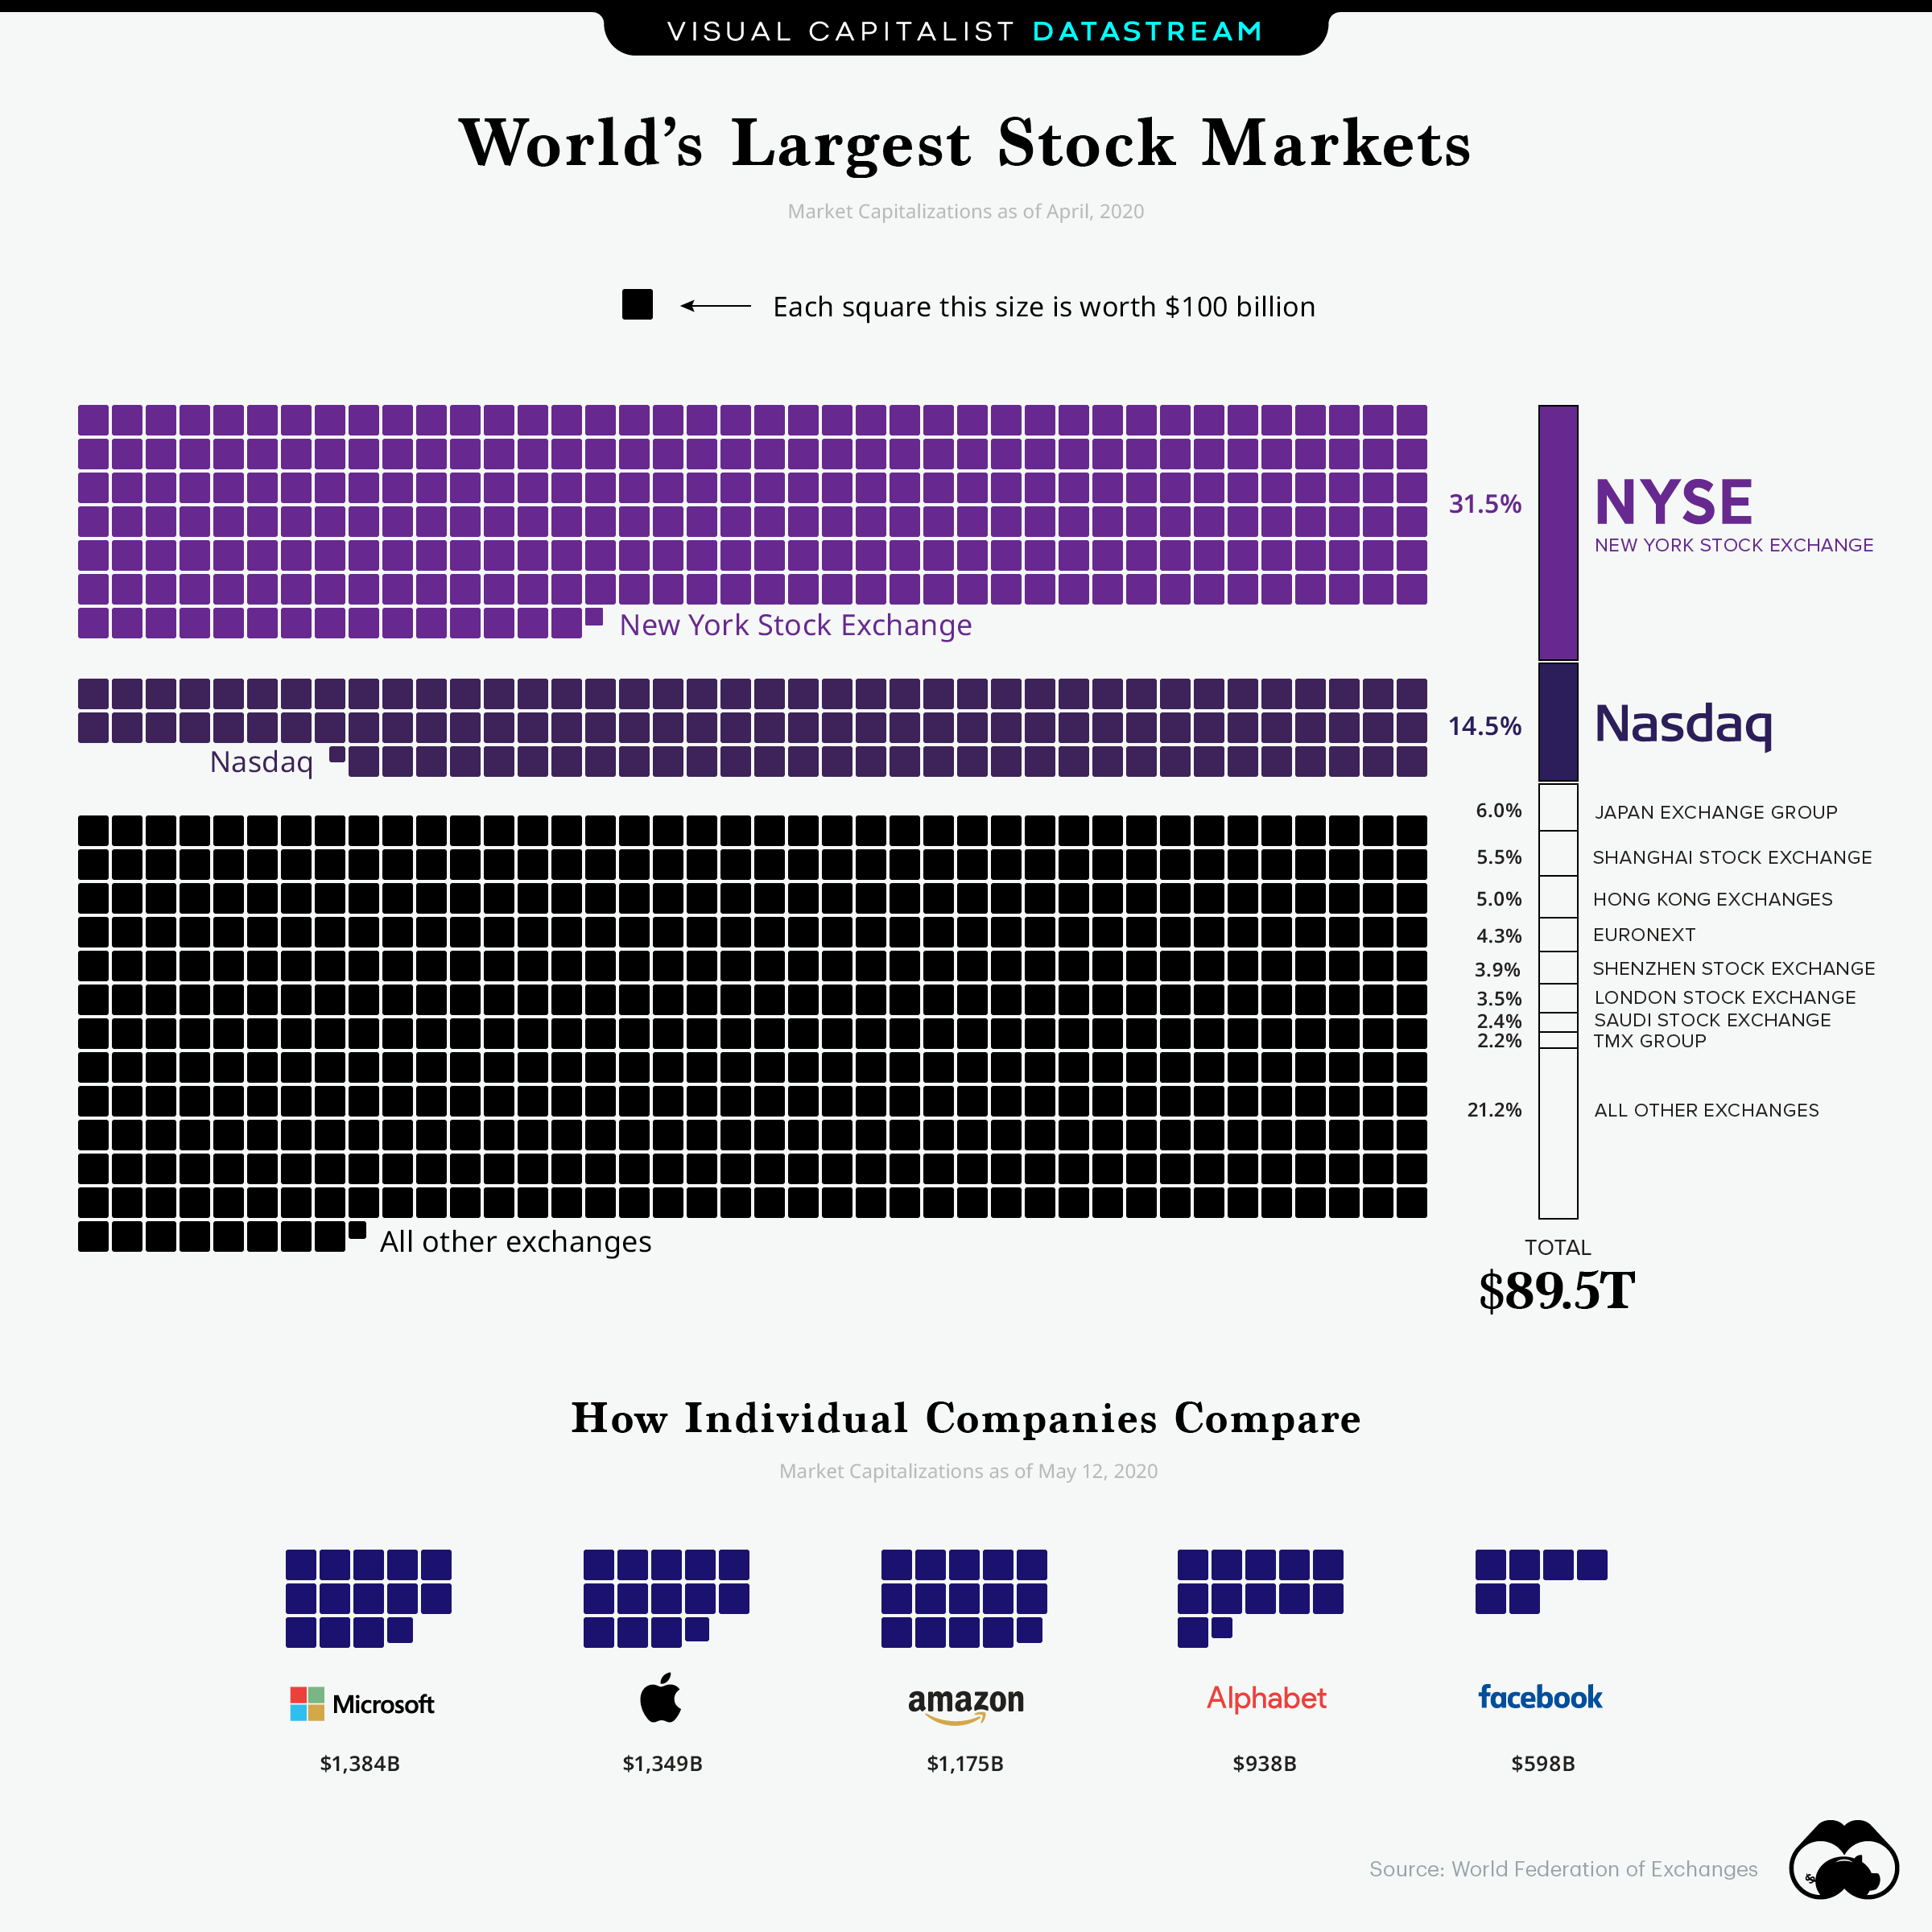
- The 10 largest stock markets represent 78.8% of the global stock market value.
- The top two—the NYSE and Nasdaq—capture 46%.
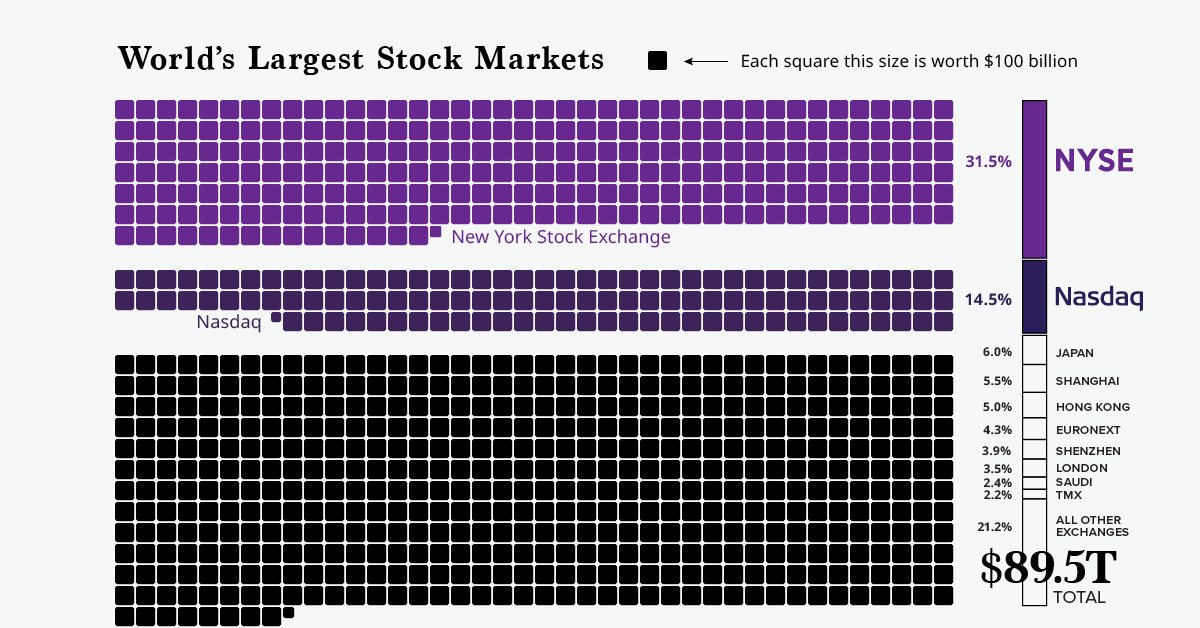
The world’s stock market exchanges have a combined market cap of $89.5 trillion. But, while their amalgamated sum is massive, there are vast discrepancies between the value of each.
Which exchanges are the world’s largest stock markets, and why?
| Rank | Exchange | Market Value |
|---|---|---|
| #1 | NYSE | $28.19T |
| #2 | Nasdaq | $12.98T |
| #3 | Japan Exchange Group | $5.37T |
| #4 | Shanghai Stock Exchange | $4.92T |
| #5 | Hong Kong Exchanges | $4.48T |
| #6 | Euronext | $3.85T |
| #7 | Shenzhen Stock Exchange | $3.49T |
| #8 | London Stock Exchange | $3.13T |
| #9 | Saudi Stock Exchange | $2.15T |
| #10 | TMX Group | $1.97T |
Market capitalizations as of April 2020
American Exceptionalism
U.S. companies dominate the global equities landscape.
This is the case for several reasons. For starters, American companies like Apple, Microsoft, and Amazon possess trillion-dollar valuations.
Another factor is prestige—U.S. stock exchanges have always carried an elevated sense of legitimacy, which ultimately provides access to the best capital and financing for companies that trade there. That’s why you’ll find non-American companies like Toyota, Sony, and Alibaba on U.S. exchanges.
On the NYSE, there are 507 non-U.S. stocks from 46 countries. Here’s a look at 10 notable ones from all over the world that bring in a combined $2.1 trillion in market cap:
| Company | Ticker | Origin | Market Cap |
|---|---|---|---|
| Taiwan Semiconductor | TSM | Taiwan | $401.9B |
| Novartis AG | NVS | Switzerland | $212.3B |
| SAP SE | SAP | Germany | $190.4B |
| Toyota Motor Corp | TM | Japan | $213.8B |
| VALE S.A. | VALE | Brazil | $59.7B |
| Anheuser-Busch InBev NV | BUD | Germany | $94.0B |
| Enbridge Inc | ENB | Canada | $59.8B |
| Alibaba | BABA | China | $838.4B |
| Honda Motor | HMC | Japan | $44.0B |
| HSBC Holdings | HSBC | United Kingdom | $80.4B |
| Total | $2,194.7B |
Trading on big American exchanges also does the job of putting some investor concerns at bay. That’s because non-U.S. companies must comply with SEC and accounting regulations, thus providing a more overall transparent process to investors.
» Interested in the world’s money and markets? Read our full article: All of the World’s Money and Markets in One Visualization.
Where does this data come from?
- Source: World Federation of Exchanges and NYSE.
- The WFE data on the largest stock markets was released in April 2020.


Datastream
Can You Calculate Your Daily Carbon Footprint?
Discover how the average person’s carbon footprint impacts the environment and learn how carbon credits can offset your carbon footprint.


The Briefing
- A person’s carbon footprint is substantial, with activities such as food consumption creating as much as 4,500 g of CO₂ emissions daily.
- By purchasing carbon credits from Carbon Streaming Corporation, you can offset your own emissions and fund positive climate action.
Your Everyday Carbon Footprint
While many large businesses and countries have committed to net-zero goals, it is essential to acknowledge that your everyday activities also contribute to global emissions.
In this graphic, sponsored by Carbon Streaming Corporation, we will explore how the choices we make and the products we use have a profound impact on our carbon footprint.
Carbon Emissions by Activity
Here are some of the daily activities and products of the average person and their carbon footprint, according to Clever Carbon.
| Household Activities & Products | CO2 Emissions (g) |
|---|---|
| 💡 Standard Light Bulb (100 watts, four hours) | 172 g |
| 📱 Mobile Phone Use (195 minutes per day)* | 189 g |
| 👕 Washing Machine (0.63 kWh) | 275 g |
| 🔥 Electric Oven (1.56 kWh) | 675 g |
| ♨️ Tumble Dryer (2.5 kWh) | 1,000 g |
| 🧻 Toilet Roll (2 ply) | 1,300 g |
| 🚿 Hot Shower (10 mins) | 2,000 g |
| 🚙 Daily Commute (one hour, by car) | 3,360 g |
| 🍽️ Average Daily Food Consumption (three meals of 600 calories) | 4,500 g |
| *Phone use based on yearly use of 69kg per the source, Reboxed | |
Your choice of transportation plays a crucial role in determining your carbon footprint. For instance, a 15 km daily commute to work on public transport generates an average of 1,464 g of CO₂ emissions. Compared to 3,360 g—twice the volume for a journey the same length by car.
By opting for more sustainable modes of transport, such as cycling, walking, or public transportation, you can significantly reduce your carbon footprint.
Addressing Your Carbon Footprint
One way to compensate for your emissions is by purchasing high-quality carbon credits.
Carbon credits are used to help fund projects that avoid, reduce or remove CO₂ emissions. This includes nature-based solutions such as reforestation and improved forest management, or technology-based solutions such as the production of biochar and carbon capture and storage (CCS).
While carbon credits offer a potential solution for individuals to help reduce global emissions, public awareness remains a significant challenge. A BCG-Patch survey revealed that only 34% of U.S. consumers are familiar with carbon credits, and only 3% have purchased them in the past.
About Carbon Streaming
By financing the creation or expansion of carbon projects, Carbon Streaming Corporation secures the rights to future carbon credits generated by these sustainable projects. You can then purchase these carbon credits to help fund climate solutions around the world and compensate for your own emissions.
Ready to get involved?
>> Learn more about purchasing carbon credits at Carbon Streaming

-

 Misc1 week ago
Airline Incidents: How Do Boeing and Airbus Compare?
-

 Real Estate2 weeks ago
Visualizing America’s Shortage of Affordable Homes
-

 Green2 weeks ago
Ranked: Top Countries by Total Forest Loss Since 2001
-

 Money2 weeks ago
Where Does One U.S. Tax Dollar Go?
-

 Automotive2 weeks ago
Almost Every EV Stock is Down After Q1 2024
-

 AI2 weeks ago
The Stock Performance of U.S. Chipmakers So Far in 2024
-

 Business2 weeks ago
Charted: Big Four Market Share by S&P 500 Audits
-

 Real Estate2 weeks ago
Ranked: The Most Valuable Housing Markets in America