Datastream
Tesla Set to Become a Top 10 Company in the S&P 500
The Briefing
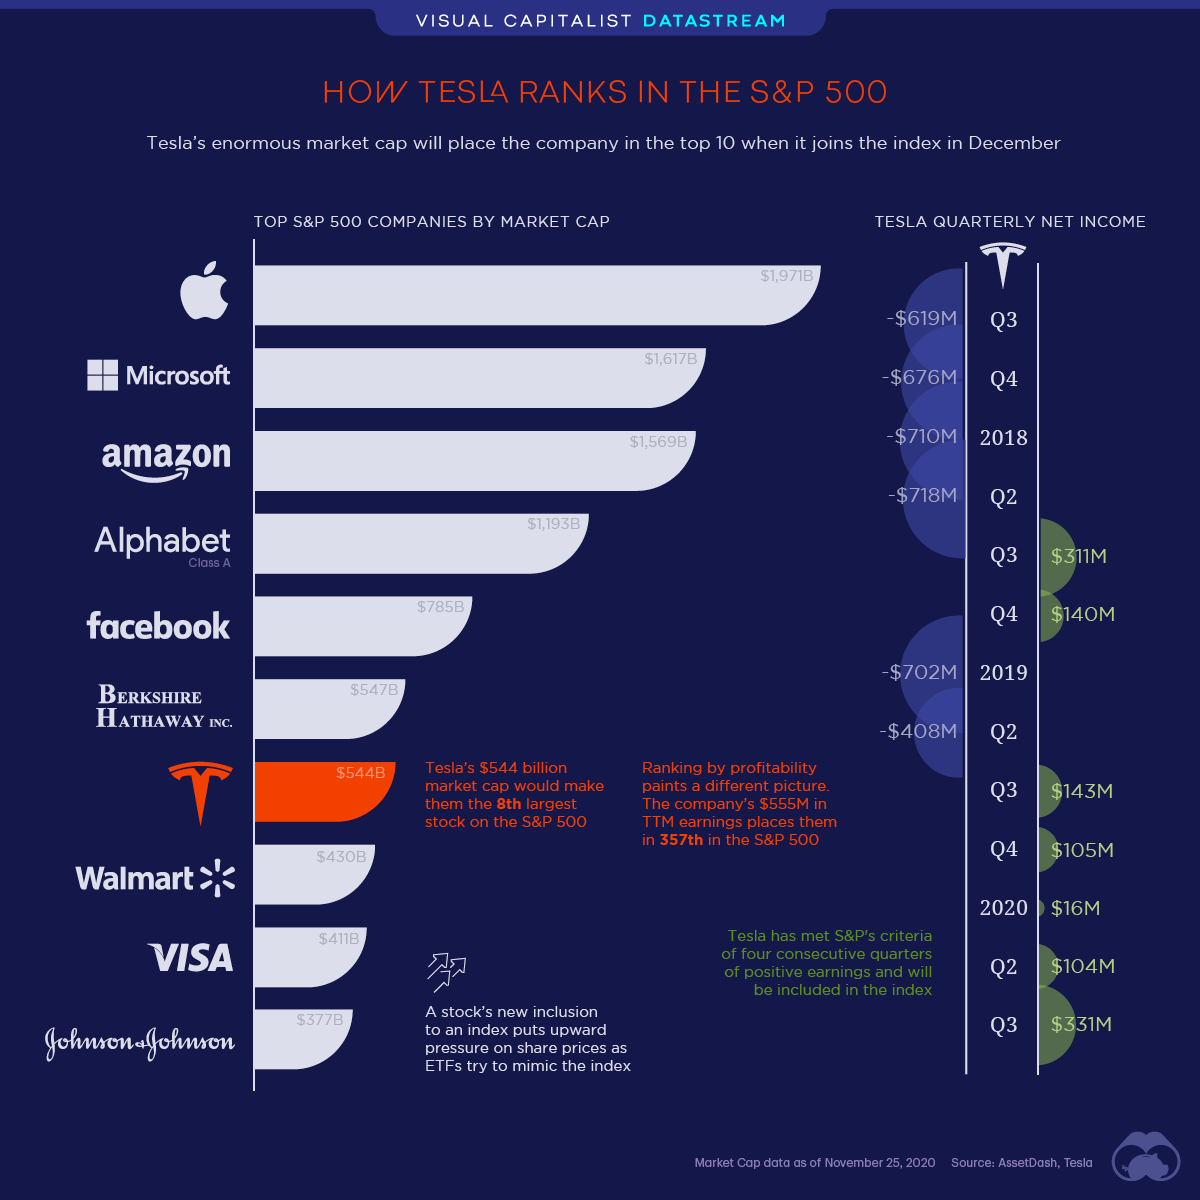
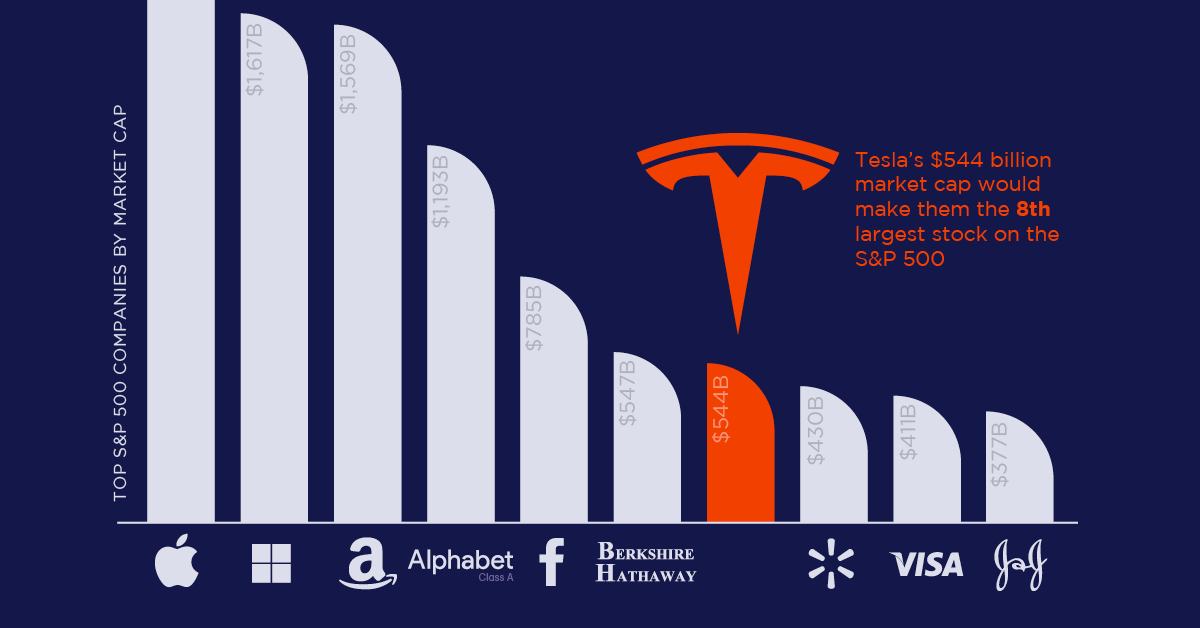
- With positive earnings in each of the last four quarters, Tesla is now eligible to join the S&P 500. They will be the 8th largest stock and 7th largest company on the benchmark index, with a market cap of $544 billion
- Tesla’s inclusion in the S&P 500 will commence in December of this year—an additional blow to Tesla bears as the index brings with it an additional layer of prestige
The New Kid On The Block
Tesla will be joining the S&P 500 in December, gaining eligibility for inclusion after posting positive earnings over four consecutive quarters.
In Q3’20, the company made $331 million in profits, and delivered 139,300 vehicles. The stock has been on a tear in recent years, and joining the index only furthers the automaker’s momentum – dealing another blow to the increasingly hopeless short sellers along the way.
| Company | Market Cap | TTM Earnings |
|---|---|---|
| Apple | $1,971B | $55B |
| Microsoft | $1,617B | $44B |
| Amazon | $1,569B | $11B |
| Alphabet | $1,193B | $34B |
| $785B | $18B | |
| Berkshire Hathaway | $547B | $81B |
| Tesla | $544B | $0.5B |
| Walmart | $430B | $14B |
| Visa | $411B | $10B |
| Johnson & Johnson | $377B | $34B |
Anything But Standard
Standard & Poor’s have quite the criteria before a company can be considered for inclusion in their flagship index. To be part of the S&P 500, a minimum market cap of $8.2 billion is required.
Of course, market cap is not where Tesla’s weakness is. Valued at $544 billion, right off the bat they will be one of the top S&P 500 companies. Rather, net income has been the struggle for Tesla. After government subsidies, they posted $556 million in trailing twelve month (TTM) profits, placing them 357th in the index.
By market cap, Tesla runs with some of the all-time greats and will be the largest inclusion to join the index ever. When ranked by net income though, a much different ranking emerges:
| Rank | Company | Symbol | Annual Net Income |
|---|---|---|---|
| 355 | Tractor Supply Company | TSCO | $562M |
| 356 | Mettler-Toledo International | MTD | $561M |
| 357 | Tesla | TSLA | $556M |
| 358 | Huntington Ingalls Industries | HII | $549M |
| 359 | Zebra Technologies | ZBRA | $544M |
By this metric, the automaker can be found adjacent to lesser-known Mettler-Toledo and Tractor Supply Company.
The EV Revolution
As the electric car movement continues full steam ahead, Tesla as the market leader will play a pivotal role in society’s transition towards it. The average cost of the Model 3 is decreasing, thus increasing its affordability. This marks a positive signal as widespread adoption often above all requires feasibility for the masses.
As governments worldwide continue to bolster their arsenal in combating climate change, it catalyzes the demand for both electric vehicles and Tesla shares. With short seller activity beginning to subside, Tesla’s official kickoff in the S&P 500 next month could be the next chapter for Elon Musk & Co.
Where does this data come from?
Source: Asset Dash and Barchart.com.
Notes: Financial data is as of November 25th, 2020


Datastream
Can You Calculate Your Daily Carbon Footprint?
Discover how the average person’s carbon footprint impacts the environment and learn how carbon credits can offset your carbon footprint.


The Briefing
- A person’s carbon footprint is substantial, with activities such as food consumption creating as much as 4,500 g of CO₂ emissions daily.
- By purchasing carbon credits from Carbon Streaming Corporation, you can offset your own emissions and fund positive climate action.
Your Everyday Carbon Footprint
While many large businesses and countries have committed to net-zero goals, it is essential to acknowledge that your everyday activities also contribute to global emissions.
In this graphic, sponsored by Carbon Streaming Corporation, we will explore how the choices we make and the products we use have a profound impact on our carbon footprint.
Carbon Emissions by Activity
Here are some of the daily activities and products of the average person and their carbon footprint, according to Clever Carbon.
| Household Activities & Products | CO2 Emissions (g) |
|---|---|
| 💡 Standard Light Bulb (100 watts, four hours) | 172 g |
| 📱 Mobile Phone Use (195 minutes per day)* | 189 g |
| 👕 Washing Machine (0.63 kWh) | 275 g |
| 🔥 Electric Oven (1.56 kWh) | 675 g |
| ♨️ Tumble Dryer (2.5 kWh) | 1,000 g |
| 🧻 Toilet Roll (2 ply) | 1,300 g |
| 🚿 Hot Shower (10 mins) | 2,000 g |
| 🚙 Daily Commute (one hour, by car) | 3,360 g |
| 🍽️ Average Daily Food Consumption (three meals of 600 calories) | 4,500 g |
| *Phone use based on yearly use of 69kg per the source, Reboxed | |
Your choice of transportation plays a crucial role in determining your carbon footprint. For instance, a 15 km daily commute to work on public transport generates an average of 1,464 g of CO₂ emissions. Compared to 3,360 g—twice the volume for a journey the same length by car.
By opting for more sustainable modes of transport, such as cycling, walking, or public transportation, you can significantly reduce your carbon footprint.
Addressing Your Carbon Footprint
One way to compensate for your emissions is by purchasing high-quality carbon credits.
Carbon credits are used to help fund projects that avoid, reduce or remove CO₂ emissions. This includes nature-based solutions such as reforestation and improved forest management, or technology-based solutions such as the production of biochar and carbon capture and storage (CCS).
While carbon credits offer a potential solution for individuals to help reduce global emissions, public awareness remains a significant challenge. A BCG-Patch survey revealed that only 34% of U.S. consumers are familiar with carbon credits, and only 3% have purchased them in the past.
About Carbon Streaming
By financing the creation or expansion of carbon projects, Carbon Streaming Corporation secures the rights to future carbon credits generated by these sustainable projects. You can then purchase these carbon credits to help fund climate solutions around the world and compensate for your own emissions.
Ready to get involved?
>> Learn more about purchasing carbon credits at Carbon Streaming

-

 Green1 week ago
Ranking the Top 15 Countries by Carbon Tax Revenue
-

 Technology2 weeks ago
The Stock Performance of U.S. Chipmakers So Far in 2024
-

 Business2 weeks ago
Charted: Big Four Market Share by S&P 500 Audits
-

 Real Estate2 weeks ago
Ranked: The Most Valuable Housing Markets in America
-

 Money2 weeks ago
Which States Have the Highest Minimum Wage in America?
-

 AI2 weeks ago
Ranked: Semiconductor Companies by Industry Revenue Share
-

 Travel2 weeks ago
Ranked: The World’s Top Flight Routes, by Revenue
-

 Demographics2 weeks ago
Population Projections: The World’s 6 Largest Countries in 2075