Markets
Mapped: The Growth in House Prices by Country
The following slider shows both nominal and real housing prices by country. Use slider arrows to navigate.

Mapped: The Growth in House Prices by Country
This was originally posted on Advisor Channel. Sign up to the free mailing list to get beautiful visualizations on financial markets that help advisors and their clients.
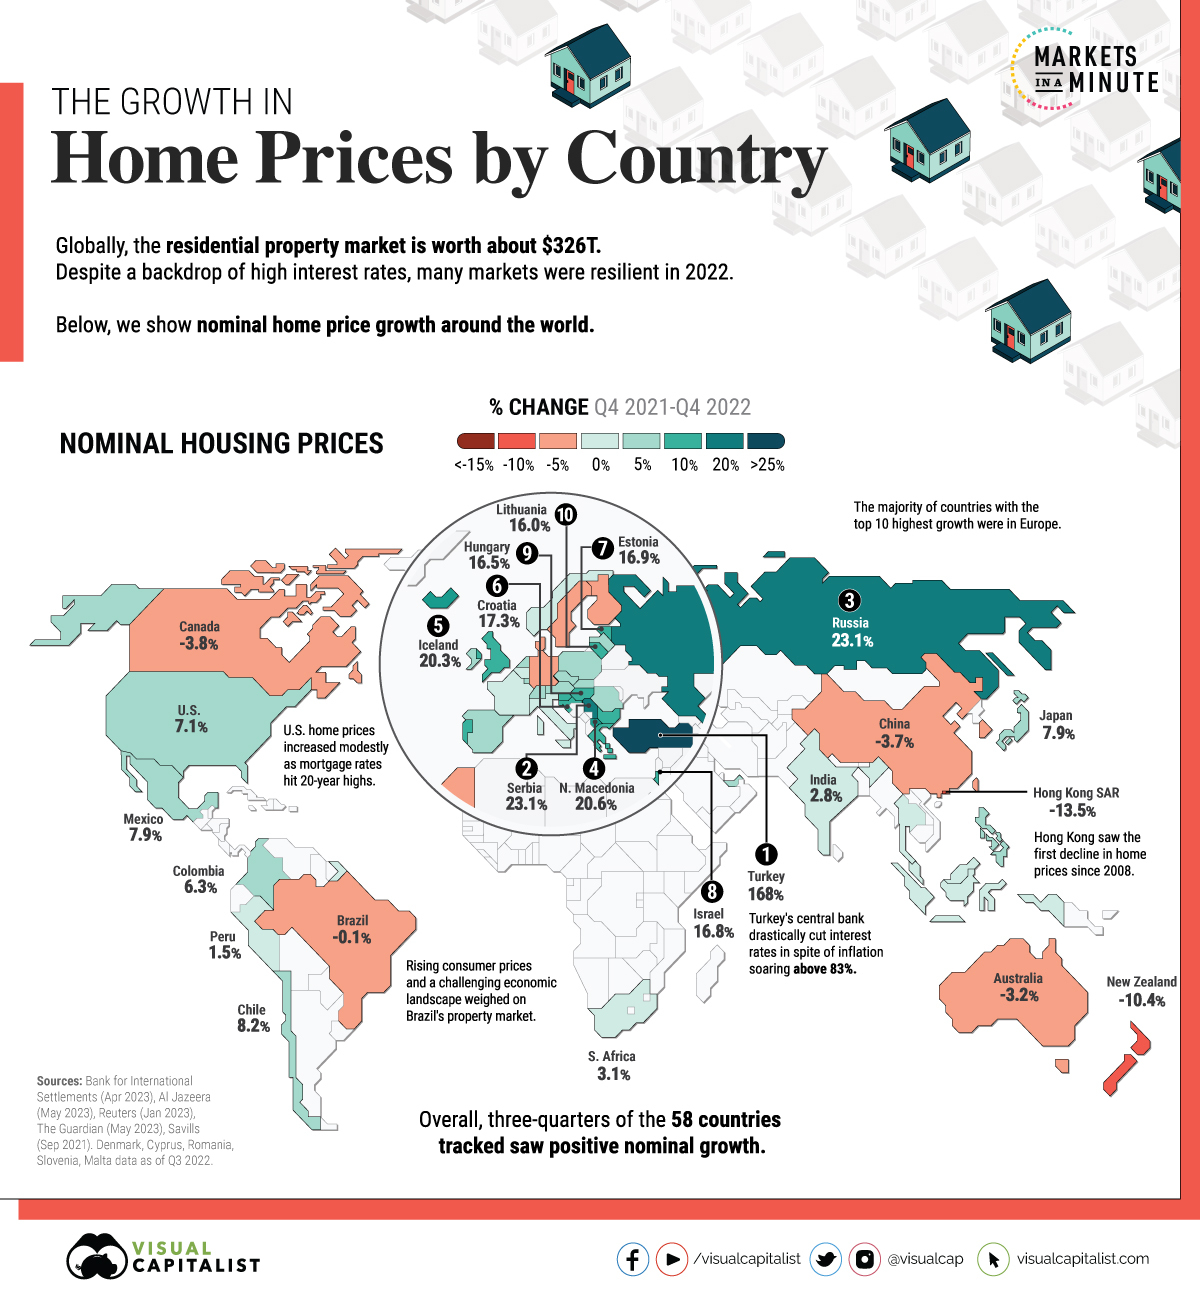
Global housing prices rose an average of 6% annually, between Q4 2021 and Q4 2022.
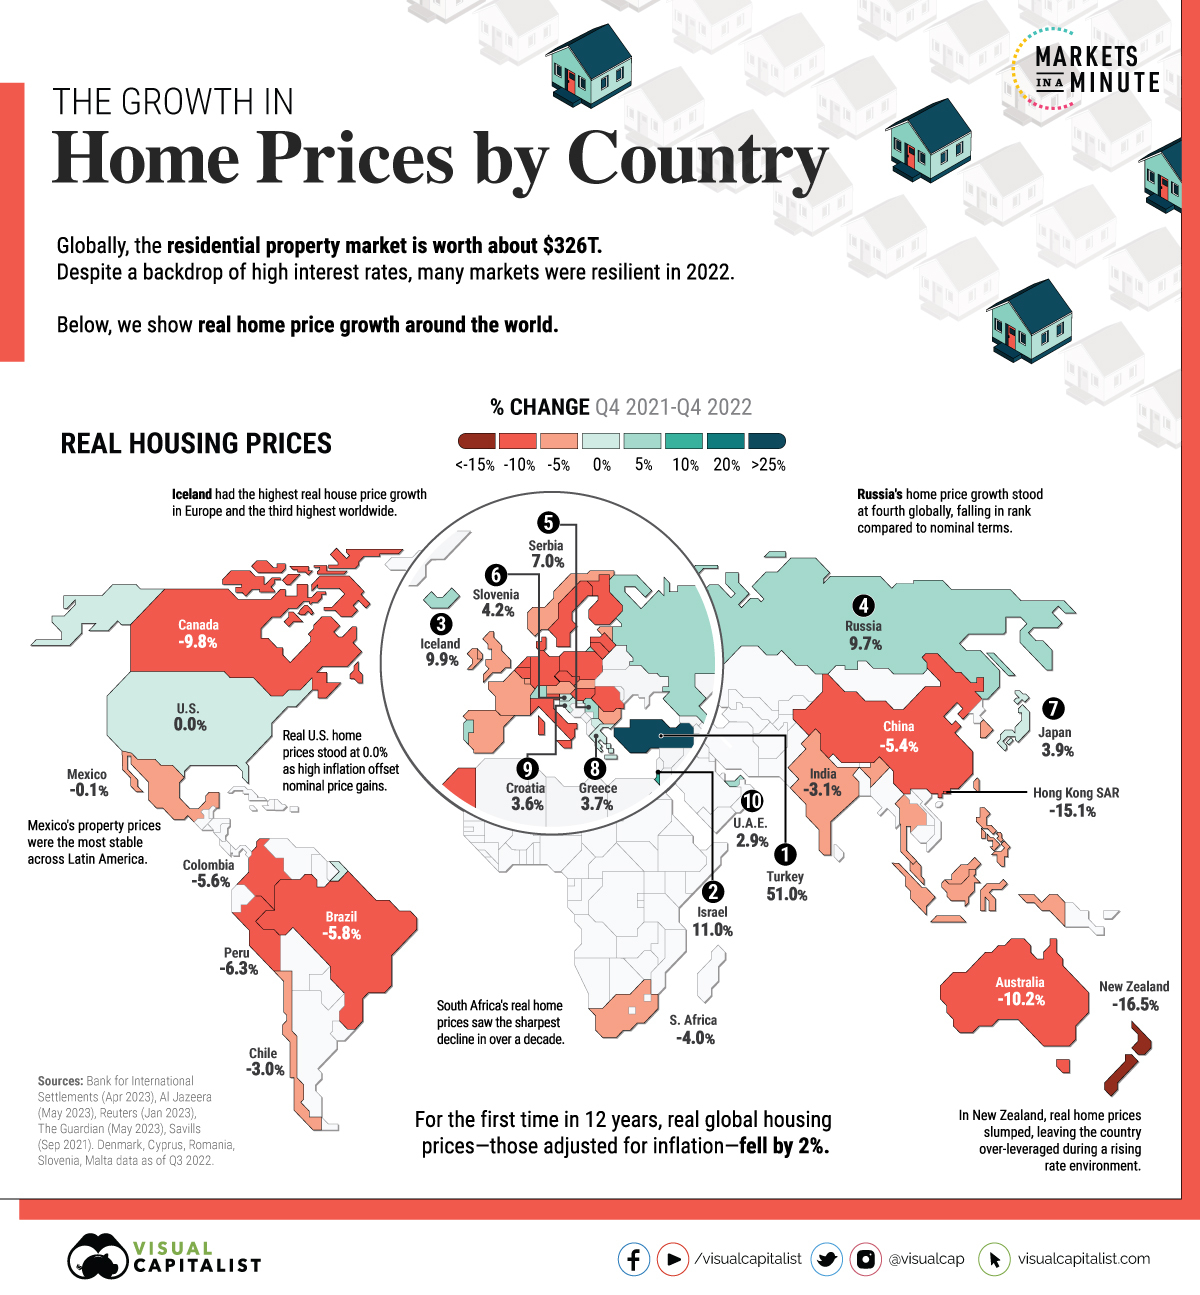
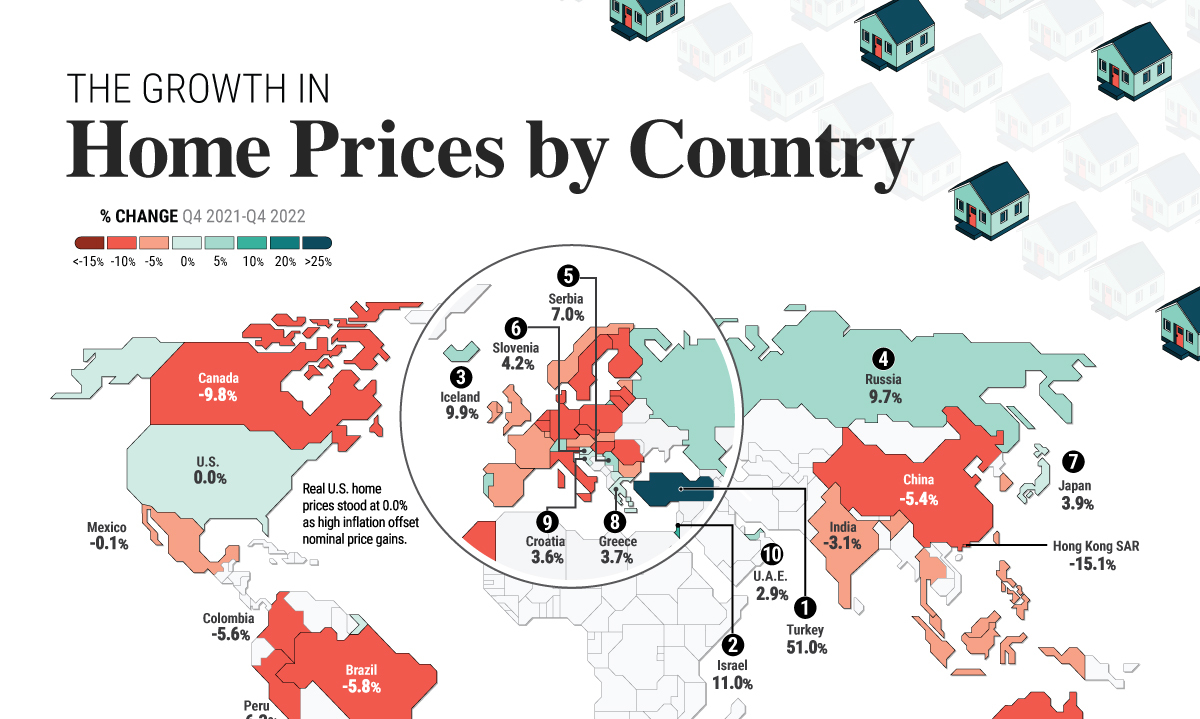
In real terms that take inflation into account, prices actually fell 2% for the first decline in 12 years. Despite a surge in interest rates and mortgage costs, housing markets were noticeably stable. Real prices remain 7% above pre-pandemic levels.
In this graphic, we show the change in residential property prices with data from the Bank for International Settlements (BIS).
The Growth in House Prices, Ranked
The following dataset from the BIS covers nominal and real house price growth across 58 countries and regions as of the fourth quarter of 2022:
| Price Growth Rank | Country / Region | Nominal Year-over-Year Change (%) | Real Year-over-Year Change (%) |
|---|---|---|---|
| 1 | 🇹🇷 Türkiye | 167.9 | 51.0 |
| 2 | 🇷🇸 Serbia | 23.1 | 7.0 |
| 3 | 🇷🇺 Russia | 23.1 | 9.7 |
| 4 | 🇲🇰 North Macedonia | 20.6 | 1.0 |
| 5 | 🇮🇸 Iceland | 20.3 | 9.9 |
| 6 | 🇭🇷 Croatia | 17.3 | 3.6 |
| 7 | 🇪🇪 Estonia | 16.9 | -3.0 |
| 8 | 🇮🇱 Israel | 16.8 | 11.0 |
| 9 | 🇭🇺 Hungary | 16.5 | -5.1 |
| 10 | 🇱🇹 Lithuania | 16.0 | -5.5 |
| 11 | 🇸🇮 Slovenia | 15.4 | 4.2 |
| 12 | 🇧🇬 Bulgaria | 13.4 | -3.2 |
| 13 | 🇬🇷 Greece | 12.2 | 3.7 |
| 14 | 🇵🇹 Portugal | 11.3 | 1.3 |
| 15 | 🇬🇧 United Kingdom | 10.0 | -0.7 |
| 16 | 🇸🇰 Slovak Republic | 9.7 | -4.8 |
| 17 | 🇦🇪 United Arab Emirates | 9.6 | 2.9 |
| 18 | 🇵🇱 Poland | 9.3 | -6.9 |
| 19 | 🇱🇻 Latvia | 9.1 | -10.2 |
| 20 | 🇸🇬 Singapore | 8.6 | 1.9 |
| 21 | 🇮🇪 Ireland | 8.6 | -0.2 |
| 22 | 🇨🇱 Chile | 8.2 | -3.0 |
| 23 | 🇯🇵 Japan | 7.9 | 3.9 |
| 24 | 🇲🇽 Mexico | 7.9 | -0.1 |
| 25 | 🇵🇭 Philippines | 7.7 | -0.2 |
| 26 | 🇺🇸 United States | 7.1 | 0.0 |
| 27 | 🇨🇿 Czechia | 6.9 | -7.6 |
| 28 | 🇷🇴 Romania | 6.7 | -7.5 |
| 29 | 🇲🇹 Malta | 6.3 | -0.7 |
| 30 | 🇨🇾 Cyprus | 6.3 | -2.9 |
| 31 | 🇨🇴 Colombia | 6.3 | -5.6 |
| 32 | 🇱🇺 Luxembourg | 5.6 | -0.5 |
| 33 | 🇪🇸 Spain | 5.5 | -1.1 |
| 34 | 🇨🇭 Switzerland | 5.4 | 2.4 |
| 35 | 🇳🇱 Netherlands | 5.4 | -5.3 |
| 36 | 🇦🇹 Austria | 5.2 | -4.8 |
| 37 | 🇫🇷 France | 4.8 | -1.2 |
| 38 | 🇧🇪 Belgium | 4.7 | -5.7 |
| 39 | 🇹🇭 Thailand | 4.7 | -1.1 |
| 40 | 🇿🇦 South Africa | 3.1 | -4.0 |
| 41 | 🇮🇳 India | 2.8 | -3.1 |
| 42 | 🇮🇹 Italy | 2.8 | -8.0 |
| 43 | 🇳🇴 Norway | 2.6 | -3.8 |
| 44 | 🇮🇩 Indonesia | 2.0 | -3.4 |
| 45 | 🇵🇪 Peru | 1.5 | -6.3 |
| 46 | 🇲🇾 Malaysia | 1.2 | -2.6 |
| 47 | 🇰🇷 South Korea | -0.1 | -5.0 |
| 48 | 🇲🇦 Morocco | -0.1 | -7.7 |
| 49 | 🇧🇷 Brazil | -0.1 | -5.8 |
| 50 | 🇫🇮 Finland | -2.3 | -10.2 |
| 51 | 🇩🇰 Denmark | -2.4 | -10.6 |
| 52 | 🇦🇺 Australia | -3.2 | -10.2 |
| 53 | 🇩🇪 Germany | -3.6 | -12.1 |
| 54 | 🇸🇪 Sweden | -3.7 | -13.7 |
| 55 | 🇨🇳 China | -3.7 | -5.4 |
| 56 | 🇨🇦 Canada | -3.8 | -9.8 |
| 57 | 🇳🇿 New Zealand | -10.4 | -16.5 |
| 58 | 🇭🇰 Hong Kong SAR | -13.5 | -15.1 |
Türkiye’s property prices jumped the highest globally, at nearly 168% amid soaring inflation.
Real estate demand has increased alongside declining interest rates. The government drastically cut interest rates from 19% in late 2021 to 8.5% to support a weakening economy.
Many European countries saw some of the highest price growth in nominal terms. A strong labor market and low interest rates pushed up prices, even as mortgage rates broadly doubled across the continent. For real price growth, most countries were in negative territory—notably Sweden, Germany, and Denmark.
Nominal U.S. housing prices grew just over 7%, while real price growth halted to 0%. Prices have remained elevated given the stubbornly low supply of inventory. In fact, residential prices remain 45% above pre-pandemic levels.
How Do Interest Rates Impact Property Markets?
Global house prices boomed during the pandemic as central banks cut interest rates to prop up economies.
Now, rates have returned to levels last seen before the Global Financial Crisis. On average, rates have increased four percentage points in many major economies. Roughly three-quarters of the countries in the BIS dataset witnessed negative year-over-year real house price growth as of the fourth quarter of 2022.
Interest rates have a large impact on property prices. Cross-country evidence shows that for every one percentage point increase in real interest rates, the growth rate of housing prices tends to fall by about two percentage points.
When Will Housing Prices Fall?
The rise in U.S. interest rates has been counteracted by homeowners being reluctant to sell so they can keep their low mortgage rates. As a result, it is keeping inventory low and prices high. Homeowners can’t sell and keep their low mortgage rates unless they meet strict conditions on a new property.
Additionally, several other factors impact price dynamics. Construction costs, income growth, labor shortages, and population growth all play a role.
With a strong labor market continuing through 2023, stable incomes may help stave off prices from falling. On the other hand, buyers with floating-rate mortgages face steeper costs and may be unable to afford new rates. This could increase housing supply in the market, potentially leading to lower prices.


Economy
Economic Growth Forecasts for G7 and BRICS Countries in 2024
The IMF has released its economic growth forecasts for 2024. How do the G7 and BRICS countries compare?


G7 & BRICS Real GDP Growth Forecasts for 2024
The International Monetary Fund’s (IMF) has released its real gross domestic product (GDP) growth forecasts for 2024, and while global growth is projected to stay steady at 3.2%, various major nations are seeing declining forecasts.
This chart visualizes the 2024 real GDP growth forecasts using data from the IMF’s 2024 World Economic Outlook for G7 and BRICS member nations along with Saudi Arabia, which is still considering an invitation to join the bloc.
Get the Key Insights of the IMF’s World Economic Outlook
Want a visual breakdown of the insights from the IMF’s 2024 World Economic Outlook report?
This visual is part of a special dispatch of the key takeaways exclusively for VC+ members.
Get the full dispatch of charts by signing up to VC+.
Mixed Economic Growth Prospects for Major Nations in 2024
Economic growth projections by the IMF for major nations are mixed, with the majority of G7 and BRICS countries forecasted to have slower growth in 2024 compared to 2023.
Only three BRICS-invited or member countries, Saudi Arabia, the UAE, and South Africa, have higher projected real GDP growth rates in 2024 than last year.
| Group | Country | Real GDP Growth (2023) | Real GDP Growth (2024P) |
|---|---|---|---|
| G7 | 🇺🇸 U.S. | 2.5% | 2.7% |
| G7 | 🇨🇦 Canada | 1.1% | 1.2% |
| G7 | 🇯🇵 Japan | 1.9% | 0.9% |
| G7 | 🇫🇷 France | 0.9% | 0.7% |
| G7 | 🇮🇹 Italy | 0.9% | 0.7% |
| G7 | 🇬🇧 UK | 0.1% | 0.5% |
| G7 | 🇩🇪 Germany | -0.3% | 0.2% |
| BRICS | 🇮🇳 India | 7.8% | 6.8% |
| BRICS | 🇨🇳 China | 5.2% | 4.6% |
| BRICS | 🇦🇪 UAE | 3.4% | 3.5% |
| BRICS | 🇮🇷 Iran | 4.7% | 3.3% |
| BRICS | 🇷🇺 Russia | 3.6% | 3.2% |
| BRICS | 🇪🇬 Egypt | 3.8% | 3.0% |
| BRICS-invited | 🇸🇦 Saudi Arabia | -0.8% | 2.6% |
| BRICS | 🇧🇷 Brazil | 2.9% | 2.2% |
| BRICS | 🇿🇦 South Africa | 0.6% | 0.9% |
| BRICS | 🇪🇹 Ethiopia | 7.2% | 6.2% |
| 🌍 World | 3.2% | 3.2% |
China and India are forecasted to maintain relatively high growth rates in 2024 at 4.6% and 6.8% respectively, but compared to the previous year, China is growing 0.6 percentage points slower while India is an entire percentage point slower.
On the other hand, four G7 nations are set to grow faster than last year, which includes Germany making its comeback from its negative real GDP growth of -0.3% in 2023.
Faster Growth for BRICS than G7 Nations
Despite mostly lower growth forecasts in 2024 compared to 2023, BRICS nations still have a significantly higher average growth forecast at 3.6% compared to the G7 average of 1%.
While the G7 countries’ combined GDP is around $15 trillion greater than the BRICS nations, with continued higher growth rates and the potential to add more members, BRICS looks likely to overtake the G7 in economic size within two decades.
BRICS Expansion Stutters Before October 2024 Summit
BRICS’ recent expansion has stuttered slightly, as Argentina’s newly-elected president Javier Milei declined its invitation and Saudi Arabia clarified that the country is still considering its invitation and has not joined BRICS yet.
Even with these initial growing pains, South Africa’s Foreign Minister Naledi Pandor told reporters in February that 34 different countries have submitted applications to join the growing BRICS bloc.
Any changes to the group are likely to be announced leading up to or at the 2024 BRICS summit which takes place October 22-24 in Kazan, Russia.
Get the Full Analysis of the IMF’s Outlook on VC+
This visual is part of an exclusive special dispatch for VC+ members which breaks down the key takeaways from the IMF’s 2024 World Economic Outlook.
For the full set of charts and analysis, sign up for VC+.

-

 Markets1 week ago
U.S. Debt Interest Payments Reach $1 Trillion
-

 Markets2 weeks ago
Charted: Big Four Market Share by S&P 500 Audits
-

 Real Estate2 weeks ago
Ranked: The Most Valuable Housing Markets in America
-

 Money2 weeks ago
Which States Have the Highest Minimum Wage in America?
-

 AI2 weeks ago
Ranked: Semiconductor Companies by Industry Revenue Share
-

 Markets2 weeks ago
Ranked: The World’s Top Flight Routes, by Revenue
-

 Countries2 weeks ago
Population Projections: The World’s 6 Largest Countries in 2075
-

 Markets2 weeks ago
The Top 10 States by Real GDP Growth in 2023