Globalization
3 Reasons for the Fertilizer and Food Shortage
Subscribe to the Elements free mailing list for more like this
3 Reasons for the Fertilizer and Food Shortage
This was originally posted on Elements. Sign up to the free mailing list to get beautiful visualizations on natural resource megatrends in your email every week.
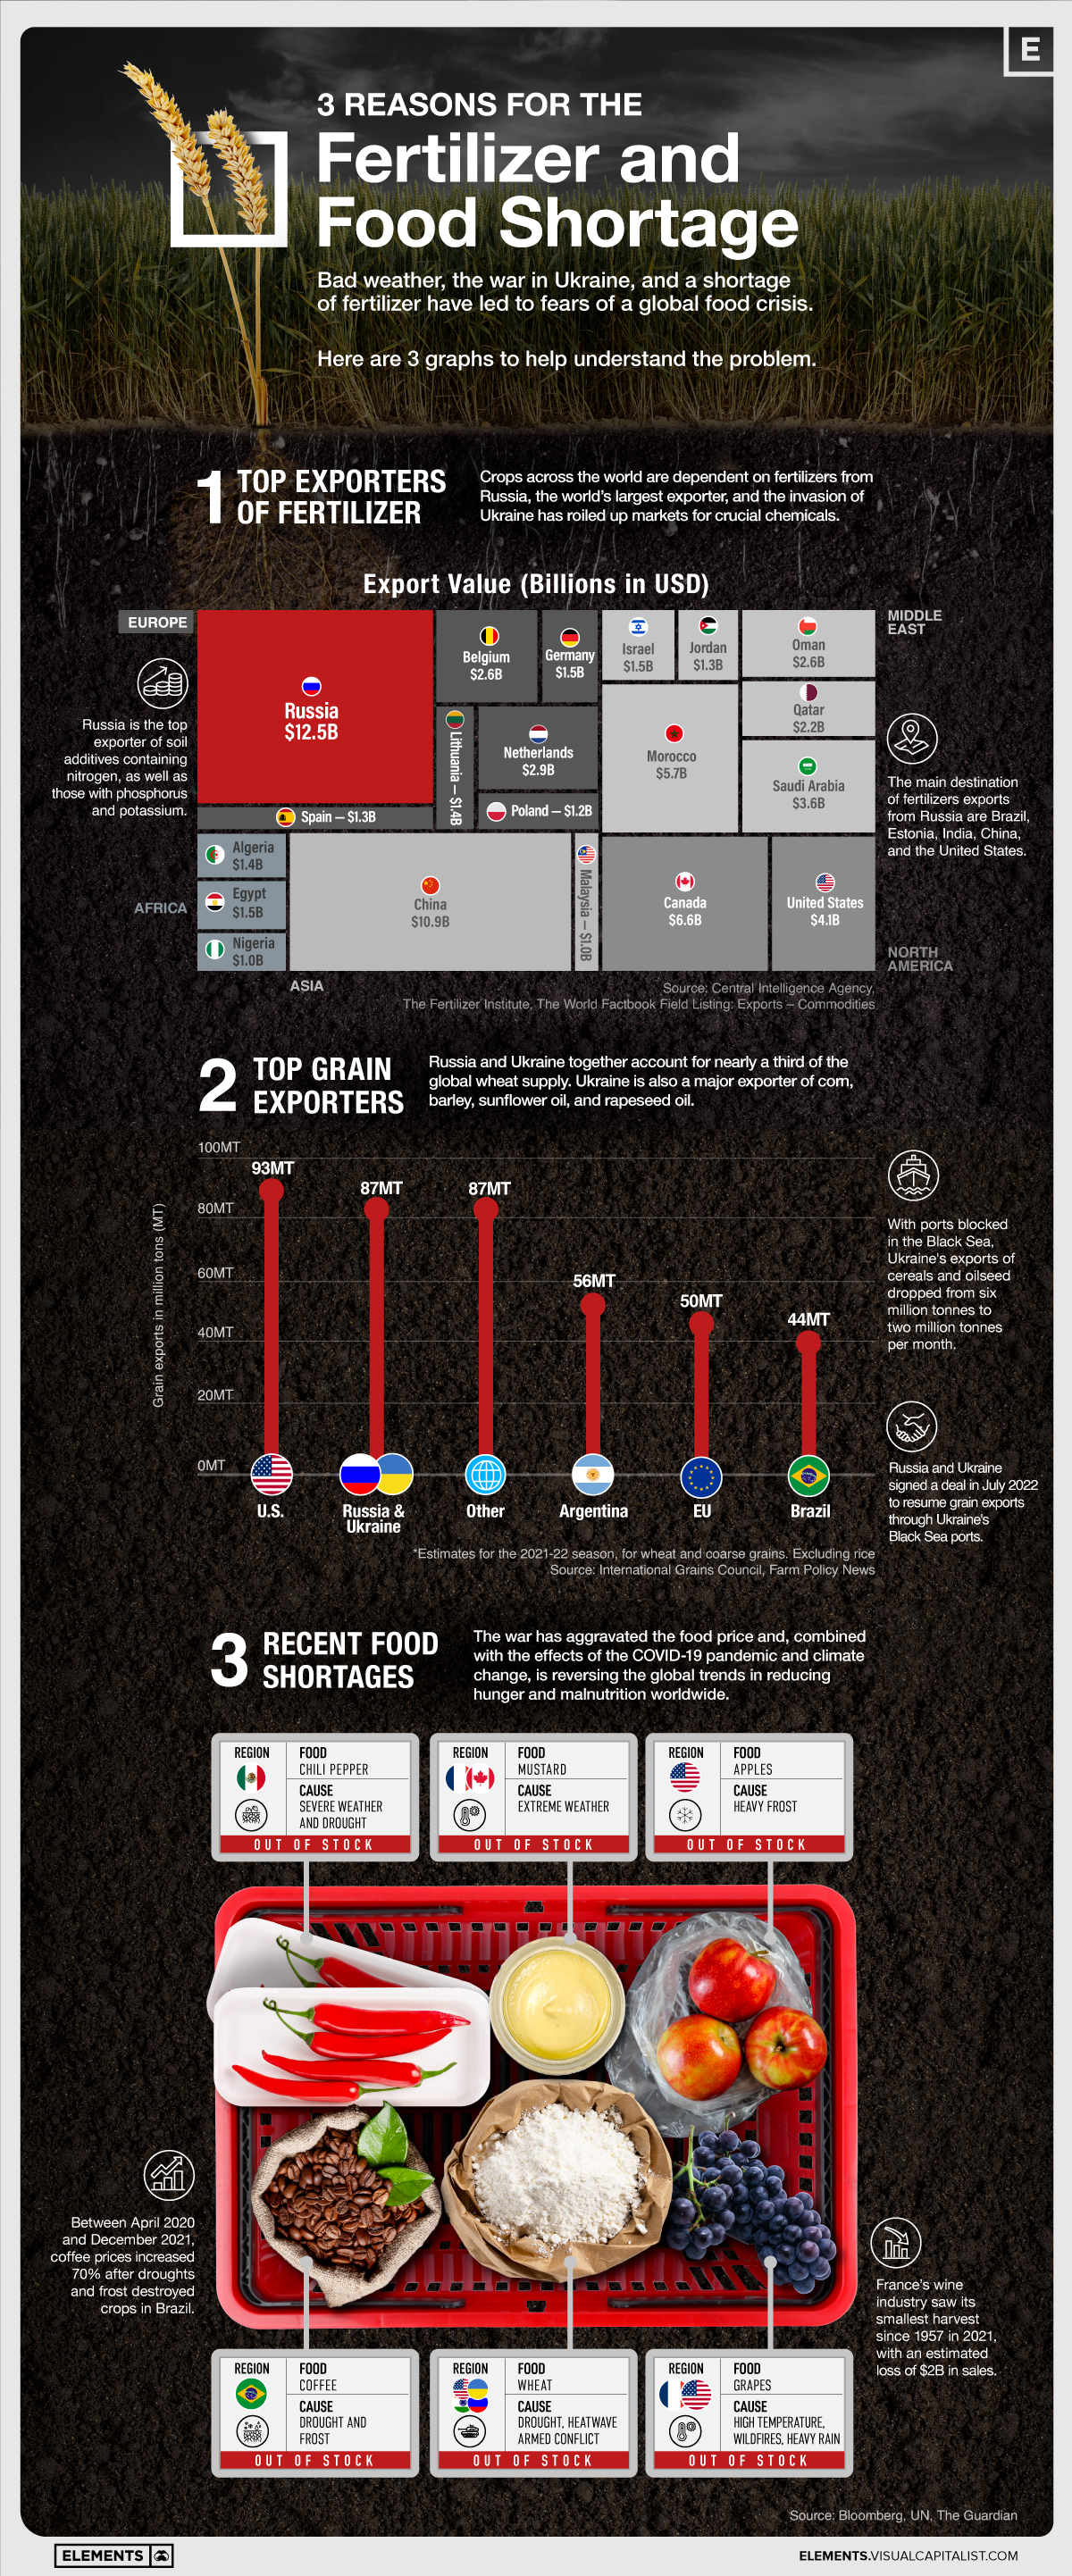
Bad weather, the Russian invasion of Ukraine, and a shortage of fertilizer have led to fears of a global food crisis.
This infographic will help you understand the problem by highlighting three key factors behind the mounting food crisis.
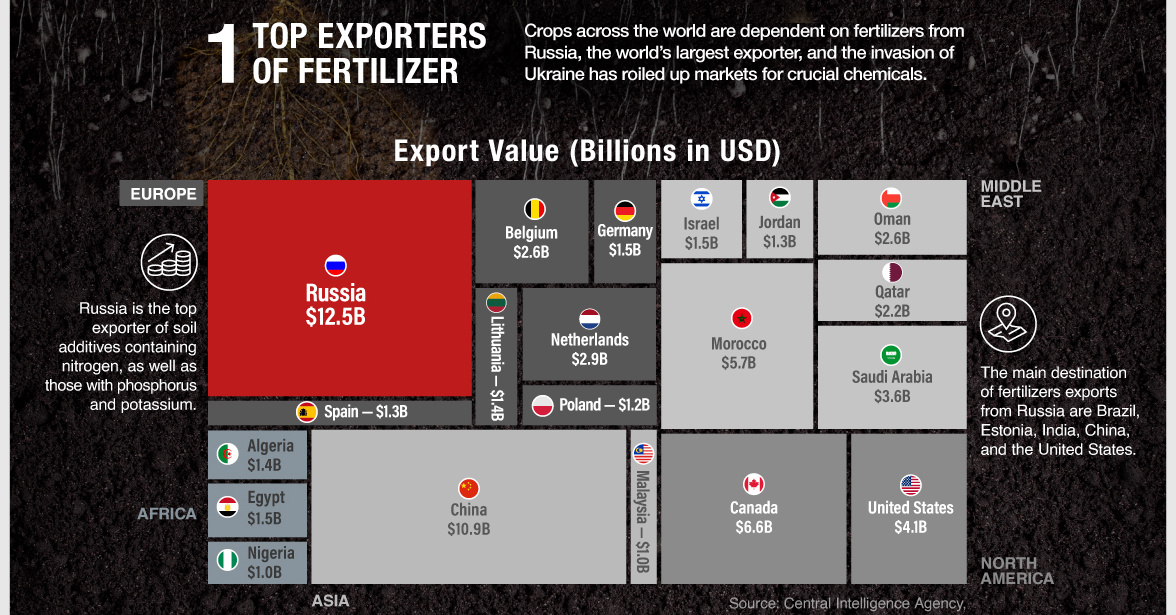
#1: The Fertilizer Shortage
Since the beginning of the Russian invasion of Ukraine in February 2022, the war has disrupted shipments of fertilizer, an essential source of nutrients for crops.
Russia is the world’s top exporter of nitrogen fertilizer and ranks second in phosphorus and potassium fertilizer exports. Belarus, a Russian ally also contending with Western sanctions, is another major fertilizer producer. In addition, both countries collectively account for over 40% of global exports of the crop nutrient potash.
Here are the top 20 fertilizer exporters globally:
Rank | Country | Exports Value (Billions in USD) |
---|---|---|
#1 | 🇷🇺 Russia | $12.5 |
#2 | 🇨🇳 China | $10.9 |
#3 | 🇨🇦 Canada | $6.6 |
#4 | 🇲🇦 Morocco | $5.7 |
#5 | 🇺🇸 United States | $4.1 |
#6 | 🇸🇦 Saudi Arabia | $3.6 |
#7 | 🇳🇱 Netherlands | $2.9 |
#8 | 🇧🇪 Belgium | $2.6 |
#9 | 🇴🇲 Oman | $2.6 |
#10 | 🇶🇦 Qatar | $2.2 |
#11 | 🇩🇪 Germany | $1.5 |
#12 | 🇮🇱I srael | $1.5 |
#13 | 🇪🇬 Egypt | $1.5 |
#14 | 🇱🇹 Lithuania | $1.4 |
#15 | 🇩🇿 Algeria | $1.4 |
#16 | 🇪🇸 Spain | $1.3 |
#17 | 🇯🇴 Jordan | $1.3 |
#18 | 🇵🇱 Poland | $1.2 |
#19 | 🇲🇾 Malaysia | $1.0 |
#20 | 🇳🇬 Nigeria | $1.0 |
The main destination of fertilizer exports from Russia are large economies like India, Brazil, China, and the United States.
However, many developing countries—including Mongolia, Honduras, Cameroon, Ghana, Senegal, and Guatemala—rely on Russia for at least one-fifth of their fertilizer imports.
Furthermore, the war intensified trends that were already disrupting supply, such as increased hoarding by major producing nations like China and sharp jumps in the price of natural gas, a key feedstock for fertilizer production.
#2: Global Grain Exports
The blockade of Ukrainian ports by Russia’s Black Sea fleet, along with Western sanctions against Russia, has worsened global supply chain bottlenecks, causing inflation in food and energy prices around the world.
This is largely because Russia and Ukraine together account for nearly one-third of the global wheat supply. Wheat is one of the most-used crops in the world annually, used to make a variety of food products like bread and pasta. Additionally, Ukraine is also a major exporter of corn, barley, sunflower oil, and rapeseed oil.
Producer | Grain Exports in Million Tons (MT) |
---|---|
🇺🇸 United States | 93MT |
🇷🇺 Russia & 🇺🇦 Ukraine | 87MT |
🇦🇷 Argentina | 56MT |
🇪🇺 EU | 50MT |
🇧🇷 Brazil | 44MT |
Other | 87MT |
As a result of the blockade, Ukraine’s exports of cereals and oilseed dropped from six million tonnes to two million tonnes per month. After two months of negotiations, the two countries signed a deal to reopen Ukrainian Black Sea ports for grain exports, raising hopes that the international food crisis can be eased.
#3: Recent Food Shortages
Besides the war in Ukraine, factors including the COVID-19 pandemic and climate change resulted in nearly one billion people going hungry last year, according to United Nations.
France’s wine industry saw its smallest harvest since 1957 in 2021, with an estimated loss of $2 billion in sales due to increasingly higher temperatures and extreme weather conditions.
Heat, drought, and floods also decimated crops in Latin America, North America, and India in recent months. Between April 2020 and December 2021, coffee prices increased 70% after droughts and frost destroyed crops in Brazil.
In the face of multiple crises, the World Bank recently announced financial support of up to $30 billion to existing and new projects in areas such as agriculture, nutrition, social protection, water, and irrigation.
Globalization
Mapped: All of the World’s Roads, by Continent
What does a road map of the world look like? Here’s a deep view of roads visualized by type across countries and continents.

Mapped: All of the World’s Roads, by Continent
Once upon a time, it was said that all roads led to Rome. Now with at least 21 million kilometers of roads spanning the globe, every continent and country has its own web of crisscrossing connections, from major highways to rural drives.
And there’s no better way to see the scale and spread of roads than by visualizing them. Adam Symington from PythonMaps used data from the Global Roads Inventory Project (GRIP) to map all the roads in the world, creating an accurate representation of humanity’s need to connect.
Creating the Global Road Map
The GRIP database pulled information from a variety of sources including governments, research institutes, NGOs, and crowd-sourcing initiatives to create a harmonized dataset of geospatial road information for a 2018 paper, “Global patterns of current and future road infrastructure.”
Researchers categorized roads into types using a UN classification system, which have been visualized in three colors on this map:
Category | Definition | Color |
---|---|---|
Main Roads | Highways + primary roads between and within cities and towns. Multi-lane, limited entry and exit points. | White |
Secondary Roads | Paved, high-traffic, access between neighborhoods | Yellow |
Tertiary Roads | Paved or unpaved residential access within neighborhoods, or rural points of interest. | Red |
Local Roads | All other smaller roads that don't fit above, and usually are not throughfare. | Red |
This classification allowed for examining relationships between road infrastructure, development, wealth, and population distribution.
Which Country has the Largest Road Map?
With nearly 3 million kilometers of motorways, the U.S. has the largest road network in the world, nearly double that of China (1.7 million km) and three times that of India (1 million km).
Rank (#) | Country | All Roads (km) | % of World's Roads |
---|---|---|---|
1 | U.S. | 3,097,278 | 14.34% |
2 | China | 1,709,997 | 7.92% |
3 | India | 1,052,718 | 4.87% |
4 | Mexico | 741,949 | 3.43% |
5 | Argentina | 703,087 | 3.25% |
6 | Brazil | 681,267 | 3.15% |
7 | Russia | 621,813 | 2.88% |
8 | Australia | 620,393 | 2.87% |
9 | Germany | 563,155 | 2.61% |
10 | France | 523,566 | 2.42% |
11 | Japan | 452,440 | 2.09% |
12 | Turkey | 448,249 | 2.08% |
13 | Indonesia | 429,970 | 1.99% |
14 | Colombia | 387,471 | 1.79% |
15 | South Africa | 331,909 | 1.54% |
16 | Kazakhstan | 303,170 | 1.40% |
17 | Spain | 273,597 | 1.27% |
18 | UK | 268,709 | 1.24% |
19 | Thailand | 264,639 | 1.23% |
20 | Italy | 263,304 | 1.22% |
21 | Canada | 243,155 | 1.13% |
22 | Ukraine | 229,380 | 1.06% |
23 | Poland | 224,904 | 1.04% |
24 | Turkmenistan | 204,100 | 0.94% |
25 | Peru | 203,726 | 0.94% |
26 | Vietnam | 187,599 | 0.87% |
27 | Bangladesh | 183,317 | 0.85% |
28 | Somalia | 163,093 | 0.76% |
29 | Dem. Rep. Congo | 162,174 | 0.75% |
30 | Iran | 145,177 | 0.67% |
31 | Iraq | 140,365 | 0.65% |
32 | Angola | 135,627 | 0.63% |
33 | Sweden | 121,673 | 0.56% |
34 | South Korea | 119,456 | 0.55% |
35 | Venezuela | 118,378 | 0.55% |
36 | Libya | 117,504 | 0.54% |
37 | Bolivia | 108,594 | 0.50% |
38 | Pakistan | 106,183 | 0.49% |
39 | Sudan | 101,345 | 0.47% |
40 | Guinea | 101,324 | 0.47% |
41 | New Zealand | 100,404 | 0.46% |
42 | Philippines | 96,466 | 0.45% |
43 | Sri Lanka | 96,023 | 0.44% |
44 | Kenya | 94,339 | 0.44% |
45 | Chile | 93,030 | 0.43% |
46 | Nigeria | 92,469 | 0.43% |
47 | Austria | 90,284 | 0.42% |
48 | Finland | 89,386 | 0.41% |
49 | Czech Republic | 89,266 | 0.41% |
50 | Saudi Arabia | 86,188 | 0.40% |
51 | Greece | 86,128 | 0.40% |
52 | Afghanistan | 83,186 | 0.39% |
53 | Belarus | 80,824 | 0.37% |
54 | Ecuador | 80,290 | 0.37% |
55 | Myanmar | 79,401 | 0.37% |
56 | Ethiopia | 79,306 | 0.37% |
57 | Netherlands | 77,793 | 0.36% |
58 | Senegal | 74,928 | 0.35% |
59 | Taiwan | 72,870 | 0.34% |
60 | Cameroon | 71,882 | 0.33% |
61 | Madagascar | 71,341 | 0.33% |
62 | Zimbabwe | 70,503 | 0.33% |
63 | Uruguay | 69,587 | 0.32% |
64 | Norway | 66,204 | 0.31% |
65 | Portugal | 65,181 | 0.30% |
66 | Belgium | 65,098 | 0.30% |
67 | Uzbekistan | 64,445 | 0.30% |
68 | Romania | 63,333 | 0.29% |
69 | Botswana | 63,130 | 0.29% |
70 | Mali | 59,142 | 0.27% |
71 | Mozambique | 58,693 | 0.27% |
72 | Cuba | 56,883 | 0.26% |
73 | Hungary | 56,209 | 0.26% |
74 | Algeria | 55,662 | 0.26% |
75 | Cambodia | 54,500 | 0.25% |
76 | Egypt | 52,580 | 0.24% |
77 | Chad | 52,257 | 0.24% |
78 | Denmark | 50,256 | 0.23% |
79 | Mauritania | 50,056 | 0.23% |
80 | Mongolia | 49,873 | 0.23% |
81 | Switzerland | 46,046 | 0.21% |
82 | Ivory Coast | 45,807 | 0.21% |
83 | Niger | 44,638 | 0.21% |
84 | Bulgaria | 44,225 | 0.20% |
85 | Paraguay | 43,298 | 0.20% |
86 | Yemen | 42,476 | 0.20% |
87 | Tanzania | 42,000 | 0.19% |
88 | North Korea | 41,932 | 0.19% |
89 | Zambia | 40,581 | 0.19% |
90 | Guatemala | 40,413 | 0.19% |
91 | Namibia | 40,131 | 0.19% |
92 | Ireland | 39,620 | 0.18% |
93 | Morocco | 39,479 | 0.18% |
94 | Papua New Guinea | 37,960 | 0.18% |
95 | Malaysia | 37,237 | 0.17% |
96 | Nepal | 36,791 | 0.17% |
97 | Croatia | 34,870 | 0.16% |
98 | Syria | 34,433 | 0.16% |
99 | Sierra Leone | 33,559 | 0.16% |
100 | Slovakia | 33,136 | 0.15% |
101 | Albania | 33,022 | 0.15% |
102 | South Sudan | 32,277 | 0.15% |
103 | Burkina Faso | 31,046 | 0.14% |
104 | Laos | 28,924 | 0.13% |
105 | El Salvador | 28,506 | 0.13% |
106 | Ghana | 28,024 | 0.13% |
107 | Kyrgyzstan | 27,850 | 0.13% |
108 | Latvia | 26,808 | 0.12% |
109 | Rwanda | 26,714 | 0.12% |
110 | Lithuania | 26,144 | 0.12% |
111 | Nicaragua | 25,373 | 0.12% |
112 | Central African Republic | 25,249 | 0.12% |
113 | Israel | 24,801 | 0.11% |
114 | Congo | 24,616 | 0.11% |
115 | Liberia | 24,507 | 0.11% |
116 | Oman | 23,546 | 0.11% |
117 | Jamaica | 23,193 | 0.11% |
118 | Serbia | 21,858 | 0.10% |
119 | Benin | 21,289 | 0.10% |
120 | Tunisia | 20,765 | 0.10% |
121 | Uganda | 19,523 | 0.09% |
122 | Mauritius | 19,434 | 0.09% |
123 | Jordan | 19,284 | 0.09% |
124 | U.A.E | 19,198 | 0.09% |
125 | Costa Rica | 18,924 | 0.09% |
126 | Estonia | 18,551 | 0.09% |
127 | Haiti | 18,169 | 0.08% |
128 | Burundi | 17,450 | 0.08% |
129 | Tajikistan | 16,086 | 0.07% |
130 | East Timor | 16,048 | 0.07% |
131 | Iceland | 15,374 | 0.07% |
132 | Azerbaijan | 15,361 | 0.07% |
133 | Honduras | 15,200 | 0.07% |
134 | Guinea-Bissau | 13,636 | 0.06% |
135 | Malawi | 13,238 | 0.06% |
136 | Puerto Rico | 12,934 | 0.06% |
137 | Palestine | 12,817 | 0.06% |
138 | Slovenia | 12,474 | 0.06% |
139 | Gabon | 12,286 | 0.06% |
140 | Cyprus | 11,721 | 0.05% |
141 | Lebanon | 11,399 | 0.05% |
142 | Dominican Republic | 10,890 | 0.05% |
143 | Panama | 10,417 | 0.05% |
144 | Armenia | 9,888 | 0.05% |
145 | Belize | 9,817 | 0.05% |
146 | Qatar | 9,047 | 0.04% |
147 | Moldova | 8,860 | 0.04% |
148 | Georgia | 8,043 | 0.04% |
149 | Bosnia | 7,769 | 0.04% |
150 | Togo | 7,423 | 0.03% |
151 | Eritrea | 7,101 | 0.03% |
152 | Western Sahara | 6,794 | 0.03% |
153 | Djibouti | 6,786 | 0.03% |
154 | Gambia | 5,112 | 0.02% |
155 | Luxembourg | 5,106 | 0.02% |
156 | Guyana | 4,323 | 0.02% |
157 | Guadeloupe | 4,303 | 0.02% |
158 | Northern Macedonia | 4,150 | 0.02% |
159 | Singapore | 3,547 | 0.02% |
160 | French Guiana | 3,316 | 0.02% |
161 | Lesotho | 3,157 | 0.01% |
162 | Martinique | 2,857 | 0.01% |
163 | Montenegro | 2,810 | 0.01% |
164 | Eswatini | 2,664 | 0.01% |
165 | Equatorial Guinea | 2,609 | 0.01% |
166 | Netherlands Antilles | 2,549 | 0.01% |
167 | Cabo Verde | 2,392 | 0.01% |
168 | Bhutan | 2,376 | 0.01% |
169 | New Caledonia | 2,213 | 0.01% |
170 | Suriname | 1,921 | 0.01% |
171 | Barbados | 1,806 | 0.01% |
172 | Kuwait | 1,651 | 0.01% |
173 | Malta | 1,637 | 0.01% |
174 | U.S. Virgin Islands | 1,429 | 0.01% |
175 | Solomon Islands | 1,309 | 0.01% |
176 | The Bahamas | 1,285 | 0.01% |
177 | Fiji | 1,134 | 0.01% |
178 | Antigua and Barbuda | 1,125 | 0.01% |
179 | Kosovo | 1,111 | 0.01% |
180 | Aruba | 890 | 0.00% |
181 | Dominica | 862 | 0.00% |
182 | Faroe Islands | 826 | 0.00% |
183 | St. Lucia | 793 | 0.00% |
184 | Cayman Islands | 746 | 0.00% |
185 | Brunei | 660 | 0.00% |
186 | Trinidad and Tobago | 636 | 0.00% |
187 | Isle of Man | 610 | 0.00% |
188 | Sao Tome and Principe | 538 | 0.00% |
189 | Grenada | 516 | 0.00% |
190 | Bahrain | 502 | 0.00% |
191 | Falkland Island | 485 | 0.00% |
192 | Reunion | 465 | 0.00% |
193 | St. Kitts and Nevis | 446 | 0.00% |
194 | Vanuatu | 445 | 0.00% |
195 | St. Vincent & the Grenadines | 389 | 0.00% |
196 | Comoros | 384 | 0.00% |
197 | Samoa | 342 | 0.00% |
198 | British Virgin Islands | 297 | 0.00% |
199 | Anguila | 209 | 0.00% |
200 | Guam | 201 | 0.00% |
201 | French Polynesia | 175 | 0.00% |
202 | Northern Mariana Islands | 145 | 0.00% |
203 | Tonga | 135 | 0.00% |
204 | Montserrat | 125 | 0.00% |
205 | San Marino | 118 | 0.00% |
206 | Mayotte | 109 | 0.00% |
207 | Niue | 91 | 0.00% |
208 | Turks & Caicos Island | 75 | 0.00% |
209 | Seychelles | 70 | 0.00% |
210 | Saint Helena | 57 | 0.00% |
211 | Cook Islands | 47 | 0.00% |
212 | Monaco | 42 | 0.00% |
213 | Andorra | 36 | 0.00% |
214 | Gibraltar | 29 | 0.00% |
215 | Wallis & Futura Islands | 25 | 0.00% |
216 | Liechtenstein | 24 | 0.00% |
217 | Palau | 18 | 0.00% |
218 | American Samoa | 17 | 0.00% |
219 | French Southern & Antarctic Lands | 15 | 0.00% |
220 | Bermuda | 14 | 0.00% |
221 | Christmas Island | 12 | 0.00% |
222 | Norfolk Island | 10 | 0.00% |
Total | 21,600,760 | 100% |
The small Pacific island country of Palau has the smallest road network in the database measuring 18 kilometers. However, many overseas territories of countries have even smaller networks, with Norfolk Island being the smallest in the dataset at 10 km.
That said, when breaking the road networks down by type, the rankings change significantly.
China muscles out the U.S. with nearly double the amount of main roads (highways + primary roads). Meanwhile, Japan and Canada climb into the top 10 by largest main road networks, while India drops down to #8.
Country | Main | Secondary | Tertiary | Local |
---|---|---|---|---|
China | 683,248 | 306,176 | 373,831 | 346,742 |
U.S. | 366,800 | 898,873 | 42,071 | 1,789,534 |
Mexico | 105,822 | 181,088 | 185,587 | 269,452 |
Japan | 94,451 | 67,454 | 100,536 | 189,999 |
Canada | 91,173 | 73,525 | 46,121 | 32,336 |
Brazil | 86,772 | 223,662 | 283,933 | 86,900 |
France | 74,956 | 114,433 | 192,191 | 141,986 |
India | 69,748 | 413,790 | 526,130 | 43,050 |
Argentina | 69,188 | 55,519 | 534,876 | 43,504 |
Australia | 69,138 | 73,376 | 426,346 | 51,533 |
Spain | 64,628 | 37,571 | 80,094 | 91,304 |
UK | 63,673 | 30,999 | 48,605 | 125,432 |
Germany | 63,517 | 97,272 | 100,513 | 301,853 |
Turkey | 59,013 | 40,863 | 203,987 | 144,386 |
South Africa | 56,262 | 103,332 | 138,895 | 33,420 |
Russia | 52,920 | 512,386 | 33,742 | 22,765 |
Kazakhstan | 47,393 | 41,074 | 149,963 | 64,740 |
Italy | 47,098 | 51,038 | 84,147 | 81,021 |
Thailand | 45,445 | 49,924 | 129,724 | 39,546 |
South Korea | 33,590 | 24,399 | 20,517 | 40,950 |
Peru | 31,361 | 47,296 | 115,038 | 10,031 |
Indonesia | 29,346 | 23,324 | 334,164 | 43,136 |
Norway | 27,175 | 19,057 | 5,377 | 14,595 |
Iran | 23,722 | 98,687 | 5,953 | 16,815 |
Chile | 21,078 | 41,353 | 20,274 | 10,325 |
Colombia | 20,884 | 43,084 | 309,725 | 13,778 |
Sweden | 20,562 | 25,438 | 45,807 | 29,866 |
Poland | 20,432 | 29,499 | 67,151 | 107,822 |
Dem. Rep. Congo | 20,209 | 29,387 | 109,962 | 2,616 |
Ethiopia | 19,920 | 22,006 | 33,409 | 3,971 |
Venezuela | 19,663 | 13,822 | 74,656 | 10,237 |
Pakistan | 19,186 | 25,672 | 55,535 | 5,790 |
Belarus | 17,720 | 29,644 | 30,928 | 2,532 |
Ireland | 17,540 | 0 | 15,379 | 6,701 |
Romania | 17,127 | 18,403 | 9,745 | 18,058 |
Philippines | 17,077 | 15,267 | 42,811 | 21,311 |
Saudi Arabia | 16,860 | 8,020 | 45,593 | 15,715 |
Myanmar | 16,527 | 13,462 | 45,041 | 4,371 |
Ukraine | 16,342 | 33,147 | 170,020 | 9,871 |
Uzbekistan | 16,127 | 44,000 | 3,557 | 761 |
Portugal | 15,545 | 9,186 | 18,646 | 21,804 |
Finland | 14,847 | 16,030 | 33,043 | 25,466 |
Vietnam | 13,800 | 17,635 | 152,901 | 3,263 |
Zimbabwe | 13,482 | 18,803 | 34,883 | 3,335 |
Austria | 13,413 | 12,878 | 15,470 | 48,523 |
Bangladesh | 13,272 | 21,723 | 137,497 | 10,825 |
New Zealand | 12,522 | 6,913 | 64,498 | 16,471 |
Iraq | 12,418 | 53,285 | 71,012 | 3,650 |
Greece | 11,533 | 12,284 | 34,815 | 27,496 |
Netherlands | 11,466 | 7,425 | 18,460 | 40,442 |
Taiwan | 11,440 | 8,899 | 39,987 | 12,544 |
Uruguay | 10,314 | 0 | 59,160 | 113 |
Croatia | 9,844 | 11,043 | 6,506 | 7,477 |
Mongolia | 9,061 | 40,812 | 0 | 0 |
Belgium | 9,048 | 7,281 | 12,661 | 36,108 |
El Salvador | 8,984 | 8,424 | 11,072 | 26 |
U.A.E | 8,889 | 3,172 | 2,043 | 5,094 |
Hungary | 8,732 | 11,512 | 11,819 | 24,146 |
Algeria | 8,675 | 6,407 | 36,187 | 4,393 |
Nicaragua | 8,060 | 14,212 | 1,255 | 1,846 |
Bolivia | 7,957 | 8,091 | 82,960 | 9,586 |
Czech Republic | 7,877 | 15,232 | 35,640 | 30,517 |
Sri Lanka | 7,704 | 15,715 | 70,536 | 2,068 |
Nigeria | 7,545 | 8,119 | 68,572 | 8,233 |
Latvia | 7,519 | 10,213 | 4,134 | 4,942 |
Lithuania | 7,452 | 5,107 | 7,480 | 6,105 |
North Korea | 7,338 | 7,775 | 20,167 | 6,652 |
Switzerland | 7,278 | 5,303 | 10,821 | 22,644 |
Libya | 7,277 | 5,615 | 80,985 | 23,627 |
Ivory Coast | 7,030 | 7,531 | 29,015 | 2,231 |
Laos | 6,882 | 4,089 | 17,749 | 204 |
Angola | 6,691 | 10,588 | 114,680 | 3,668 |
Mozambique | 6,686 | 23,425 | 27,266 | 1,316 |
Yemen | 6,647 | 503 | 34,020 | 1,306 |
Syria | 6,440 | 6,834 | 16,624 | 4,535 |
Kyrgyzstan | 6,121 | 18,927 | 1,039 | 1,763 |
Malaysia | 6,022 | 16,713 | 14,020 | 482 |
Egypt | 5,872 | 5,678 | 35,611 | 5,419 |
Israel | 5,850 | 5,095 | 12,063 | 1,793 |
Kenya | 5,792 | 28,241 | 57,725 | 2,581 |
Ecuador | 5,725 | 11,034 | 55,207 | 8,324 |
Papua New Guinea | 5,620 | 7,168 | 25,172 | 0 |
Qatar | 5,570 | 2,046 | 588 | 843 |
Serbia | 5,536 | 5,246 | 3,832 | 7,244 |
Cuba | 5,373 | 6,285 | 29,485 | 15,740 |
Paraguay | 5,144 | 13,669 | 21,767 | 2,718 |
Albania | 5,121 | 6,249 | 21,641 | 11 |
Denmark | 5,053 | 6,113 | 6,556 | 32,534 |
Botswana | 4,979 | 8,314 | 49,837 | 0 |
Sudan | 4,859 | 5,142 | 81,954 | 9,390 |
Turkmenistan | 4,731 | 24,952 | 174,410 | 7 |
Morocco | 4,727 | 2,424 | 28,105 | 4,223 |
Iceland | 4,666 | 3,291 | 5,934 | 1,483 |
Zambia | 4,648 | 3,806 | 31,113 | 1,014 |
Somalia | 4,605 | 32,248 | 125,418 | 822 |
Slovakia | 4,317 | 3,723 | 10,318 | 14,778 |
Tunisia | 4,232 | 2,606 | 9,679 | 4,248 |
Afghanistan | 4,189 | 2,204 | 75,762 | 1,031 |
Bulgaria | 4,090 | 4,533 | 24,534 | 11,068 |
Panama | 3,887 | 3,718 | 2,811 | 1 |
Tanzania | 3,852 | 4,575 | 31,734 | 1,839 |
Oman | 3,435 | 2,588 | 15,395 | 2,128 |
Mali | 3,432 | 3,080 | 48,397 | 4,233 |
Malawi | 3,352 | 7,122 | 2,625 | 139 |
Bosnia | 3,239 | 1,332 | 2,529 | 669 |
Jordan | 3,021 | 2,119 | 7,722 | 6,422 |
Namibia | 2,904 | 2,146 | 35,073 | 8 |
Azerbaijan | 2,889 | 7,265 | 346 | 4,861 |
Madagascar | 2,799 | 3,779 | 63,672 | 1,091 |
Niger | 2,751 | 2,099 | 38,633 | 1,155 |
Guatemala | 2,745 | 10,431 | 20,632 | 6,605 |
Congo | 2,733 | 11,063 | 7,089 | 3,731 |
Tajikistan | 2,639 | 13,447 | 0 | 0 |
Honduras | 2,625 | 4,696 | 5,421 | 2,458 |
Costa Rica | 2,608 | 11,277 | 361 | 4,678 |
Puerto Rico | 2,543 | 2,539 | 3,415 | 4,437 |
Rwanda | 2,299 | 4,215 | 19,609 | 591 |
Cambodia | 2,231 | 11,481 | 38,387 | 2,401 |
Benin | 2,225 | 5,104 | 13,281 | 679 |
Slovenia | 2,223 | 2,686 | 3,689 | 3,876 |
Lebanon | 2,164 | 2,368 | 4,097 | 2,770 |
Ghana | 2,107 | 8,051 | 12,883 | 4,983 |
Senegal | 2,051 | 5,437 | 64,354 | 3,086 |
Uganda | 2,024 | 346 | 16,224 | 929 |
Burkina Faso | 2,021 | 10,087 | 15,747 | 3,191 |
Jamaica | 1,972 | 5,193 | 15,495 | 533 |
Bhutan | 1,871 | 0 | 499 | 6 |
Estonia | 1,859 | 3,065 | 9,745 | 3,882 |
Mauritania | 1,738 | 2,185 | 45,204 | 929 |
Nepal | 1,728 | 3,644 | 30,100 | 1,319 |
Burundi | 1,714 | 7,571 | 8,121 | 44 |
Cameroon | 1,574 | 3,453 | 64,095 | 2,760 |
Singapore | 1,561 | 417 | 193 | 1,376 |
Cyprus | 1,488 | 2,311 | 2,266 | 5,656 |
Kuwait | 1,334 | 128 | 64 | 125 |
Northern Macedonia | 1,332 | 1,421 | 991 | 406 |
South Sudan | 1,266 | 4,974 | 26,030 | 7 |
Armenia | 1,231 | 2,874 | 1,578 | 4,205 |
Georgia | 1,192 | 5,412 | 198 | 1,241 |
Moldova | 1,190 | 2,898 | 4,751 | 21 |
Luxembourg | 1,186 | 1,916 | 381 | 1,623 |
East Timor | 1,180 | 680 | 14,066 | 122 |
Dominican Republic | 1,148 | 3,809 | 1,152 | 4,781 |
Haiti | 1,089 | 1,347 | 13,913 | 1,820 |
Palestine | 1,035 | 751 | 2,412 | 8,619 |
Suriname | 1,030 | 891 | 0 | 0 |
Togo | 855 | 970 | 2,927 | 2,671 |
Montenegro | 842 | 519 | 809 | 640 |
Belize | 680 | 5,153 | 3,984 | 0 |
Djibouti | 675 | 1,673 | 4,438 | 0 |
Eswatini | 648 | 1,061 | 955 | 0 |
Bahrain | 502 | 0 | 0 | 0 |
Guinea | 486 | 8,379 | 90,320 | 2,139 |
Eritrea | 477 | 30 | 6,592 | 2 |
French Guiana | 475 | 1,822 | 993 | 26 |
Central African Republic | 459 | 1,861 | 22,924 | 5 |
Liberia | 445 | 4,563 | 19,498 | 1 |
Guadeloupe | 438 | 523 | 2,017 | 1,325 |
Sierra Leone | 419 | 4,891 | 27,374 | 875 |
Fiji | 407 | 727 | 0 | 0 |
Kosovo | 366 | 449 | 296 | 0 |
New Caledonia | 340 | 1,873 | 0 | 0 |
Isle of Man | 336 | 120 | 21 | 133 |
Martinique | 323 | 442 | 1,211 | 881 |
Netherlands Antilles | 310 | 151 | 747 | 1,341 |
Chad | 304 | 1,958 | 48,767 | 1,228 |
Mauritius | 277 | 790 | 15,209 | 3,158 |
Lesotho | 267 | 635 | 2,250 | 5 |
Faroe Islands | 246 | 130 | 42 | 408 |
Barbados | 244 | 364 | 361 | 837 |
Malta | 228 | 223 | 173 | 1,013 |
Dominica | 224 | 60 | 237 | 341 |
U.S. Virgin Islands | 211 | 129 | 71 | 1,018 |
Reunion | 190 | 146 | 129 | 0 |
Western Sahara | 182 | 568 | 6,041 | 3 |
Gabon | 181 | 945 | 11,150 | 10 |
Grenada | 173 | 55 | 175 | 113 |
Cayman Islands | 168 | 55 | 90 | 433 |
Antigua and Barbuda | 134 | 53 | 343 | 595 |
Sao Tome and Principe | 123 | 0 | 415 | 0 |
Guam | 123 | 78 | 0 | 0 |
St. Lucia | 115 | 51 | 394 | 233 |
Cabo Verde | 99 | 333 | 1,959 | 1 |
Northern Mariana Islands | 87 | 58 | 0 | 0 |
Gambia | 85 | 1,400 | 3,612 | 15 |
British Virgin Islands | 72 | 39 | 119 | 67 |
Guinea-Bissau | 71 | 3,301 | 10,257 | 7 |
Trinidad and Tobago | 65 | 571 | 0 | 0 |
St. Kitts and Nevis | 54 | 42 | 97 | 253 |
French Polynesia | 54 | 121 | 0 | 0 |
St. Vincent & the Grenadines | 50 | 53 | 160 | 126 |
Anguila | 42 | 11 | 45 | 111 |
Aruba | 31 | 75 | 123 | 661 |
Andorra | 29 | 7 | 0 | 0 |
Saint Helena | 22 | 35 | 0 | 0 |
Montserrat | 20 | 2 | 33 | 70 |
Monaco | 14 | 6 | 7 | 15 |
San Marino | 13 | 11 | 58 | 36 |
Christmas Island | 12 | 0 | 0 | 0 |
Tonga | 10 | 125 | 0 | 0 |
Liechtenstein | 9 | 6 | 1 | 8 |
Gibraltar | 7 | 8 | 6 | 8 |
Guyana | 0 | 929 | 3,394 | 0 |
Equatorial Guinea | 0 | 210 | 2,399 | 0 |
Solomon Islands | 0 | 0 | 1,309 | 0 |
The Bahamas | 0 | 1,215 | 70 | 0 |
Brunei | 0 | 0 | 660 | 0 |
Falkland Island | 0 | 485 | 0 | 0 |
Vanuatu | 0 | 445 | 0 | 0 |
Comoros | 0 | 0 | 384 | 0 |
Samoa | 0 | 342 | 0 | 0 |
Mayotte | 0 | 0 | 109 | 0 |
Niue | 0 | 91 | 0 | 0 |
Turks & Caicos Island | 0 | 9 | 66 | 0 |
Seychelles | 0 | 32 | 38 | 0 |
Cook Islands | 0 | 47 | 0 | 0 |
Wallis & Futura Islands | 0 | 25 | 0 | 0 |
Palau | 0 | 18 | 0 | 0 |
American Samoa | 0 | 17 | 0 | 0 |
French Southern & Antarctic Lands | 0 | 15 | 0 | 0 |
Bermuda | 0 | 14 | 0 | 0 |
Norfolk Island | 0 | 10 | 0 | 0 |
In the database, 1.8 million km or more than 50% of the U.S.’s large road map is made up of smaller local roads, giving unparalleled access across almost the entire country. It also has the world’s most secondary roads, while Argentina, India, and Australia lead the rankings with the most tertiary roads.
Regional Differences Between Types of Roads
These different types of roads have a striking effect on the regional visualizations of road maps.
In North America, the U.S. and Canada have a white-yellow hue accounting for the large number of highways, primary, and secondary roads.
In Mexico, the map takes on a distinct red tint, since tertiary and local roads account for nearly two-thirds of the country’s road network.
Something similar occurs in Europe, where old Cold War divisions play out in white, yellow, and red. France, Germany, Italy, and the U.K. glow hot in a mix of white and yellow, while former Eastern Bloc countries simmer more in red.
GRIP found that main roads (highways + primary) are usually found in North America, Europe, and China, while the rest of the world has a greater percentage of secondary (yellow) and tertiary and local (red) roads.
However, one interesting sidebar is that the four countries with the greatest percentage of main roads are all from the Middle East.
Rank (#) | Country | Main Roads (% of All) |
---|---|---|
1 | Bahrain 🇧🇭 | 100% |
2 | Kuwait 🇰🇼 | 81% |
3 | Bhutan 🇧🇹 | 79% |
4 | Qatar 🇶🇦 | 62% |
5 | Suriname 🇸🇷 | 54% |
6 | U.A.E 🇦🇪 | 46% |
7 | Ireland 🇮🇪 | 44% |
8 | Singapore 🇸🇬 | 44% |
9 | Bosnia 🇧🇦 | 42% |
10 | Norway 🇳🇴 | 41% |
11 | China 🇨🇳 | 40% |
12 | Liechtenstein 🇱🇮 | 38% |
13 | Canada 🇨🇦 | 38% |
14 | Panama 🇵🇦 | 37% |
15 | Grenada 🇬🇩 | 34% |
While there may be reasons for this, it’s possible it could also be a quirk in the database, depending on how data is collected or classified in the region.
What Do Road Networks Tell Us About Countries?
Analysis of the GRIP database found that “total road length in a country is strongly and positively related to its total land surface area, human population density, gross domestic product, and OECD membership.”
However, of all the correlations, population density is perhaps the most visible in snapshots of the larger world map, such as in this one of Asia.
The Indian subcontinent and Eastern China are the two most populous regions of the world, accounting for nearly 35% of the world’s population. The most populous regions within—especially in China—have more roads, representing growing cities and urban centers.
The opposite is visible in Africa and Australia, where large natural features like deserts prevent human settlement and roads vanish from the visualization as well.
Road Maps and Sustainable Development
The environmental impact of economic development is also visual on these road networks.
Road construction leads to emissions and biodiversity displacement. By matching road maps with natural environment visualizations like this forest map, we can see how much of the world’s pristine natural reserves are still untouched by humankind.
In South America for example, the Amazon rainforest accounts for a large chunk of Brazil’s lacking road coverage.
Finally, though the GRIP research attributes population and affluence as key correlations with road development, other economic factors drive road network expansion as well.
The researchers estimate that there will be 4 million kilometers of additional roads covering the Earth by 2050, even under conservative assumptions.
In the never-ending balancing act of sustainable development and economic prosperity, development of the world’s road map will have ripple effects for years to come.
-
Maps4 weeks ago
Map Explainer: Sudan
-
Mining2 weeks ago
Ranked: The World’s Biggest Steel Producers, by Country
-
Travel4 weeks ago
Visualized: The World’s Busiest Airports, by Passenger Count
-
Visual Capitalist2 weeks ago
Join Us For Data Creator Con 2023
-
AI4 weeks ago
Visualizing Global Attitudes Towards AI
-
Central Banks1 week ago
Charted: Public Trust in the Federal Reserve
-
Visual Capitalist4 weeks ago
Calling All Data Storytellers to Enter our Creator Program Challenge
-
Technology1 week ago
Ranked: The World’s Top 25 Websites in 2023