Globalization
Interactive Map: Tracking World Hunger and Food Insecurity
Interactive Map: Tracking World Hunger and Food Insecurity
Hunger is still one the biggest—and most solvable—problems in the world.
Every day, more than 700 million people (8.8% of the world’s population) go to bed on an empty stomach, according to the UN World Food Programme (WFP).
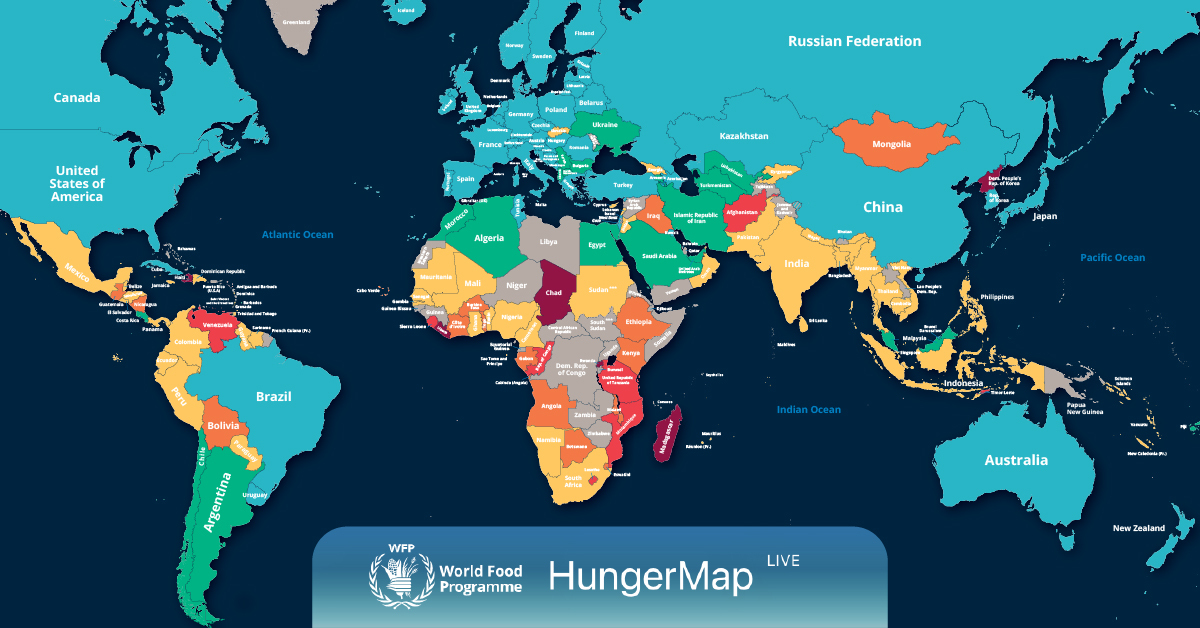
The WFP’s HungerMap LIVE displayed here tracks core indicators of acute hunger like household food consumption, livelihoods, child nutritional status, mortality, and access to clean water in order to rank countries.
But whereas acute hunger measures short-term inability to meet food consumption requirements, often related to crises, many people in the world also suffer from chronic hunger. This is the persistent inability to meet food consumption requirements, usually lasting for at least six months.
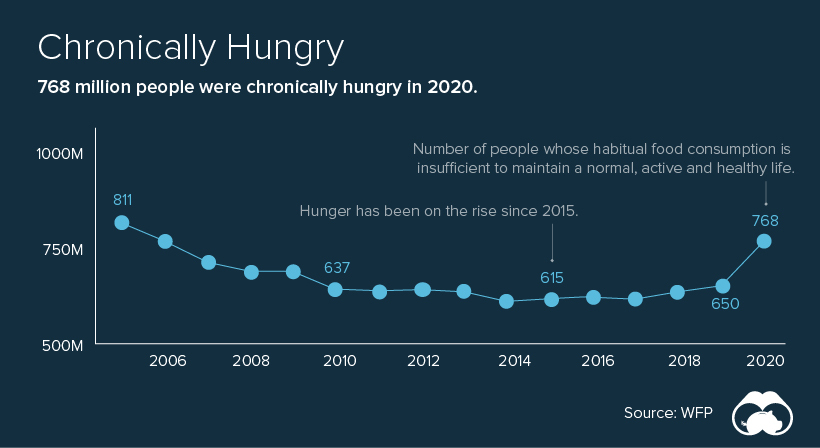
After sitting closer to 600 million from 2014 to 2019, the number of people in the world affected by hunger increased during the COVID-19 pandemic.
In 2020, 155 million people (2% of the world’s population) experienced acute hunger, requiring urgent assistance.
The Fight to Feed the World
The problem of world hunger isn’t new and attempts to solve it have made headlines for decades.
On July 13, 1985, at Wembley Stadium in London, Prince Charles and Princess Diana officially opened Live Aid, a worldwide rock concert organized to raise money for the relief of famine-stricken Africans.
The event was followed by similar concerts at other arenas around the world, globally linked by satellite to more than a billion viewers in 110 nations, raising more than $125 million ($309 million in today’s dollars) in famine relief for Africa.
But 35+ years later, the continent still struggles. According to the UN, from 12 countries with the highest prevalence of insufficient food consumption in the world, nine are in Africa.
| Country | % Population Affected by Hunger | Population (millions) | Region |
|---|---|---|---|
| Afghanistan 🇦🇫 | 93% | 40.4 | Asia |
| Somalia 🇸🇴 | 68% | 12.3 | Africa |
| Burkina Faso 🇧🇫 | 61% | 19.8 | Africa |
| South Sudan 🇸🇸 | 60% | 11.0 | Africa |
| Mali 🇲🇱 | 60% | 19.1 | Africa |
| Sierra Leone 🇸🇱 | 55% | 8.2 | Africa |
| Syria 🇸🇾 | 55% | 18.0 | Middle East |
| Niger 🇳🇪 | 55% | 22.4 | Africa |
| Lesotho 🇱🇸 | 50% | 2.1 | Africa |
| Guinea 🇬🇳 | 48% | 12.2 | Africa |
| Benin 🇧🇯 | 47% | 11.5 | Africa |
| Yemen 🇾🇪 | 44% | 30.0 | Middle East |
Approximately 30 million people in Africa face the effects of severe food insecurity, including malnutrition, starvation, and poverty.
Wasted Leftovers
Although many of the reasons for the food crisis around the globe involve conflicts or environmental challenges, one of the big contributors is food waste.
According to the United Nations, one-third of food produced for human consumption is lost or wasted globally. This amounts to about 1.3 billion tons of wasted food per year, worth approximately $1 trillion.
All the food produced but never eaten would be sufficient to feed two billion people. That’s more than twice the number of undernourished people across the globe. Consumers in rich countries waste almost as much food as the entire net food production of sub-Saharan Africa each year.
Solving World Hunger
While many people may not be “hungry” in the sense that they are suffering physical discomfort, they may still be food insecure, lacking regular access to enough safe and nutritious food for normal growth and development.
Estimates of how much money it would take to end world hunger range from $7 billion to $265 billion per year.
But to tackle the problem, investments must be utilized in the right places. Specialists say that governments and organizations need to provide food and humanitarian relief to the most at-risk regions, increase agricultural productivity, and invest in more efficient supply chains.


Politics
Charted: How Much Do Countries Trust the United Nations?
Which countries trust the United Nations to do the right thing the most, and the least?
How Much Do Countries Trust the United Nations?
This was originally posted on our Voronoi app. Download the app for free on iOS or Android and discover incredible data-driven charts from a variety of trusted sources.
Do you trust the United Nations (UN) in carrying out its objectives of maintaining peace and security, protecting human rights, and upholding international law?
Survey results from Edelman’s 2024 Trust Barometer Global Report show that some countries’ citizens believe strongly in the UN to “do the right thing,” while others are less trusting.
Ranked: 28 Countries Trust Levels in the United Nations in 2024
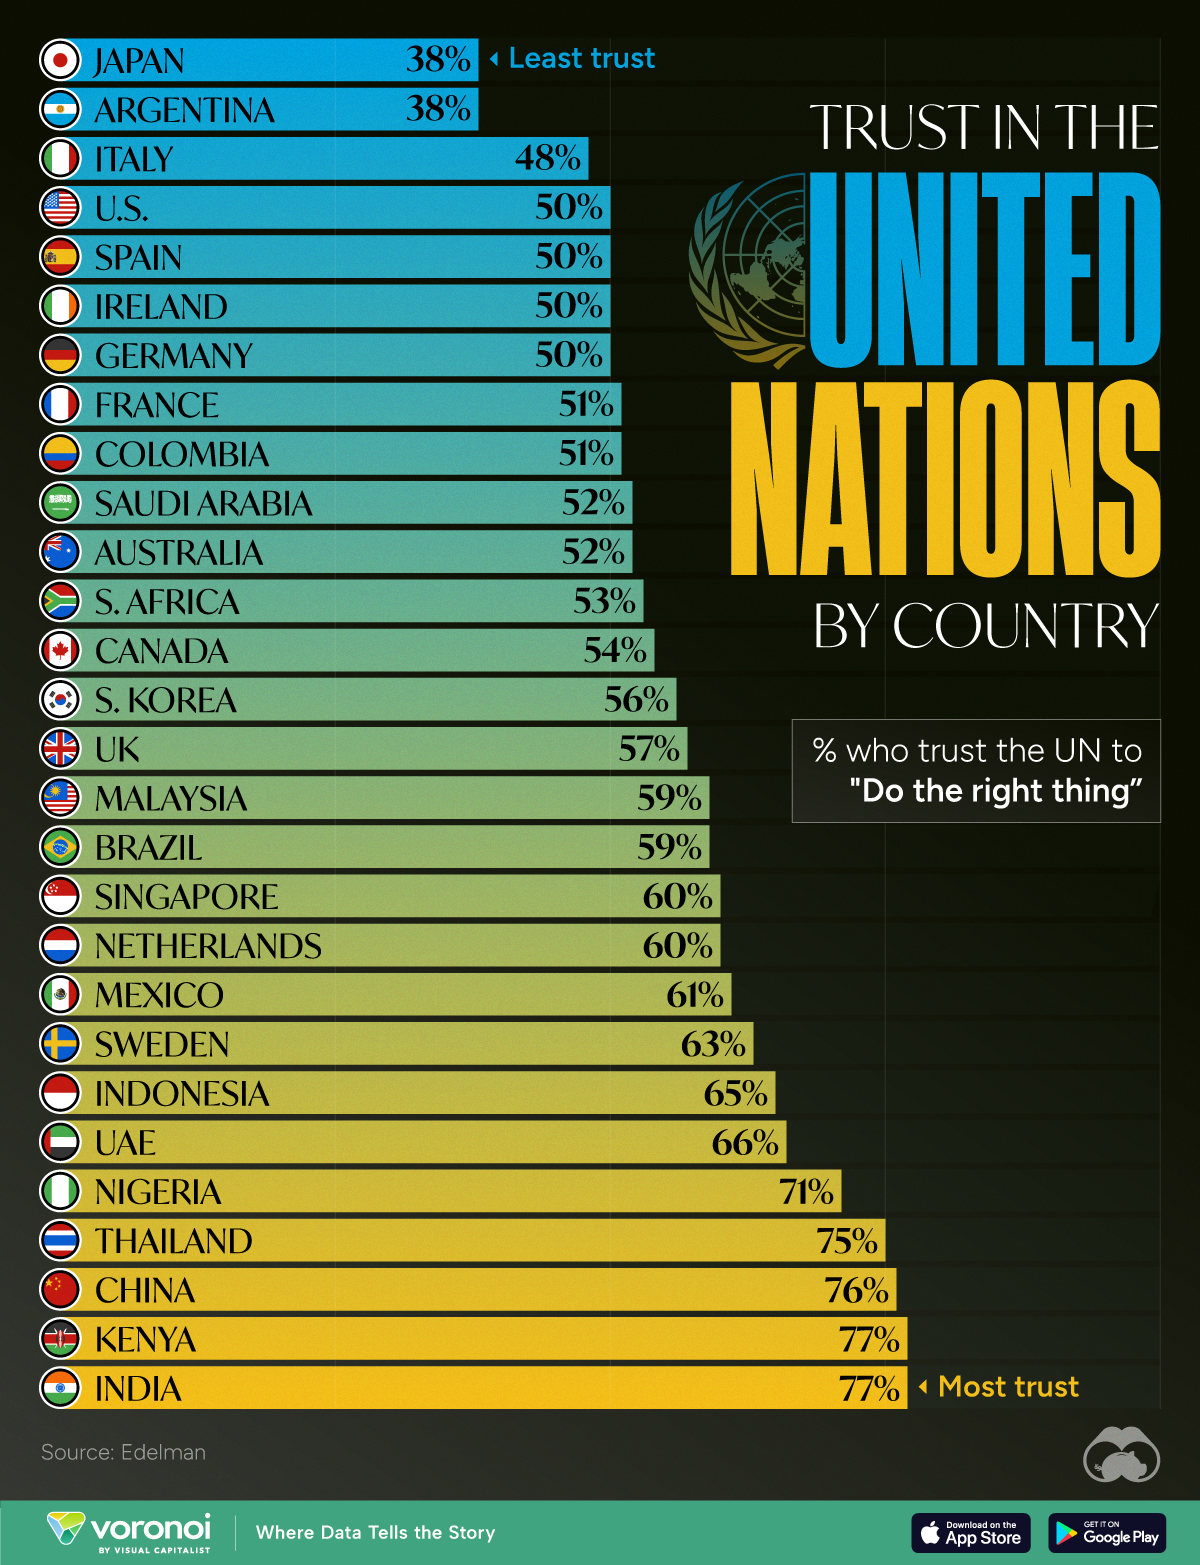
To gauge trust in the United Nations, Edelman surveyed more than 32,000 respondents between 28 countries in November 2023. Each country sample of 1,150 people is statistically significant and representative.
According to the results, respondents from Japan and Argentina had the least amount of trust in the UN when it came to “doing the right thing.”
| Country | % who trust the UN to "Do the right thing" |
|---|---|
| 🇯🇵 Japan | 38% |
| 🇦🇷 Argentina | 38% |
| 🇮🇹 Italy | 48% |
| 🇺🇸 U.S. | 50% |
| 🇪🇸 Spain | 50% |
| 🇮🇪 Ireland | 50% |
| 🇩🇪 Germany | 50% |
| 🇫🇷 France | 51% |
| 🇨🇴 Colombia | 51% |
| 🇸🇦 Saudi Arabia | 52% |
| 🇦🇺 Australia | 52% |
| 🇿🇦 South Africa | 53% |
| 🇨🇦 Canada | 54% |
| 🇰🇷 South Korea | 56% |
| 🇬🇧 UK | 57% |
| 🇲🇾 Malaysia | 59% |
| 🇧🇷 Brazil | 59% |
| 🇸🇬 Singapore | 60% |
| 🇳🇱 Netherlands | 60% |
| 🇲🇽 Mexico | 61% |
| 🇸🇪 Sweden | 63% |
| 🇮🇩 Indonesia | 65% |
| 🇦🇪 UAE | 66% |
| 🇳🇬 Nigeria | 71% |
| 🇹🇭 Thailand | 75% |
| 🇨🇳 China | 76% |
| 🇰🇪 Kenya | 77% |
| 🇮🇳 India | 77% |
Just 38% of Japanese and Argentinian people had faith in the UN, by far the lowest levels of trust. Only one other country was below the 50% trust mark: Italy at 48%.
Many major economies and G7 countries had trust levels hovering between 50–60%, including the U.S. and Germany at 50% and the UK at 57%.
Meanwhile, India and Kenya had the highest levels of trust in the UN at 77%, with China right behind at 76%. In general, African and Asian nations tended to have higher levels of trust in the UN, though there were exceptions like South Africa (53%) and South Korea (56%)
It’s also worth noting that views within countries can differ significantly. Separate data on this topic from Pew Research shows that public opinion of the UN is split along ideological lines. In the U.S., there’s a 45 percentage point difference, with more conservative respondents having significantly lower trust in the UN.

-

 Mining1 week ago
Gold vs. S&P 500: Which Has Grown More Over Five Years?
-

 Markets2 weeks ago
Ranked: The Most Valuable Housing Markets in America
-

 Money2 weeks ago
Which States Have the Highest Minimum Wage in America?
-

 AI2 weeks ago
Ranked: Semiconductor Companies by Industry Revenue Share
-

 Markets2 weeks ago
Ranked: The World’s Top Flight Routes, by Revenue
-

 Countries2 weeks ago
Population Projections: The World’s 6 Largest Countries in 2075
-

 Markets2 weeks ago
The Top 10 States by Real GDP Growth in 2023
-

 Demographics2 weeks ago
The Smallest Gender Wage Gaps in OECD Countries