Business
Ranked: The World’s Largest Container Shipping Companies


Visualizing the World’s Largest Container Shipping Companies
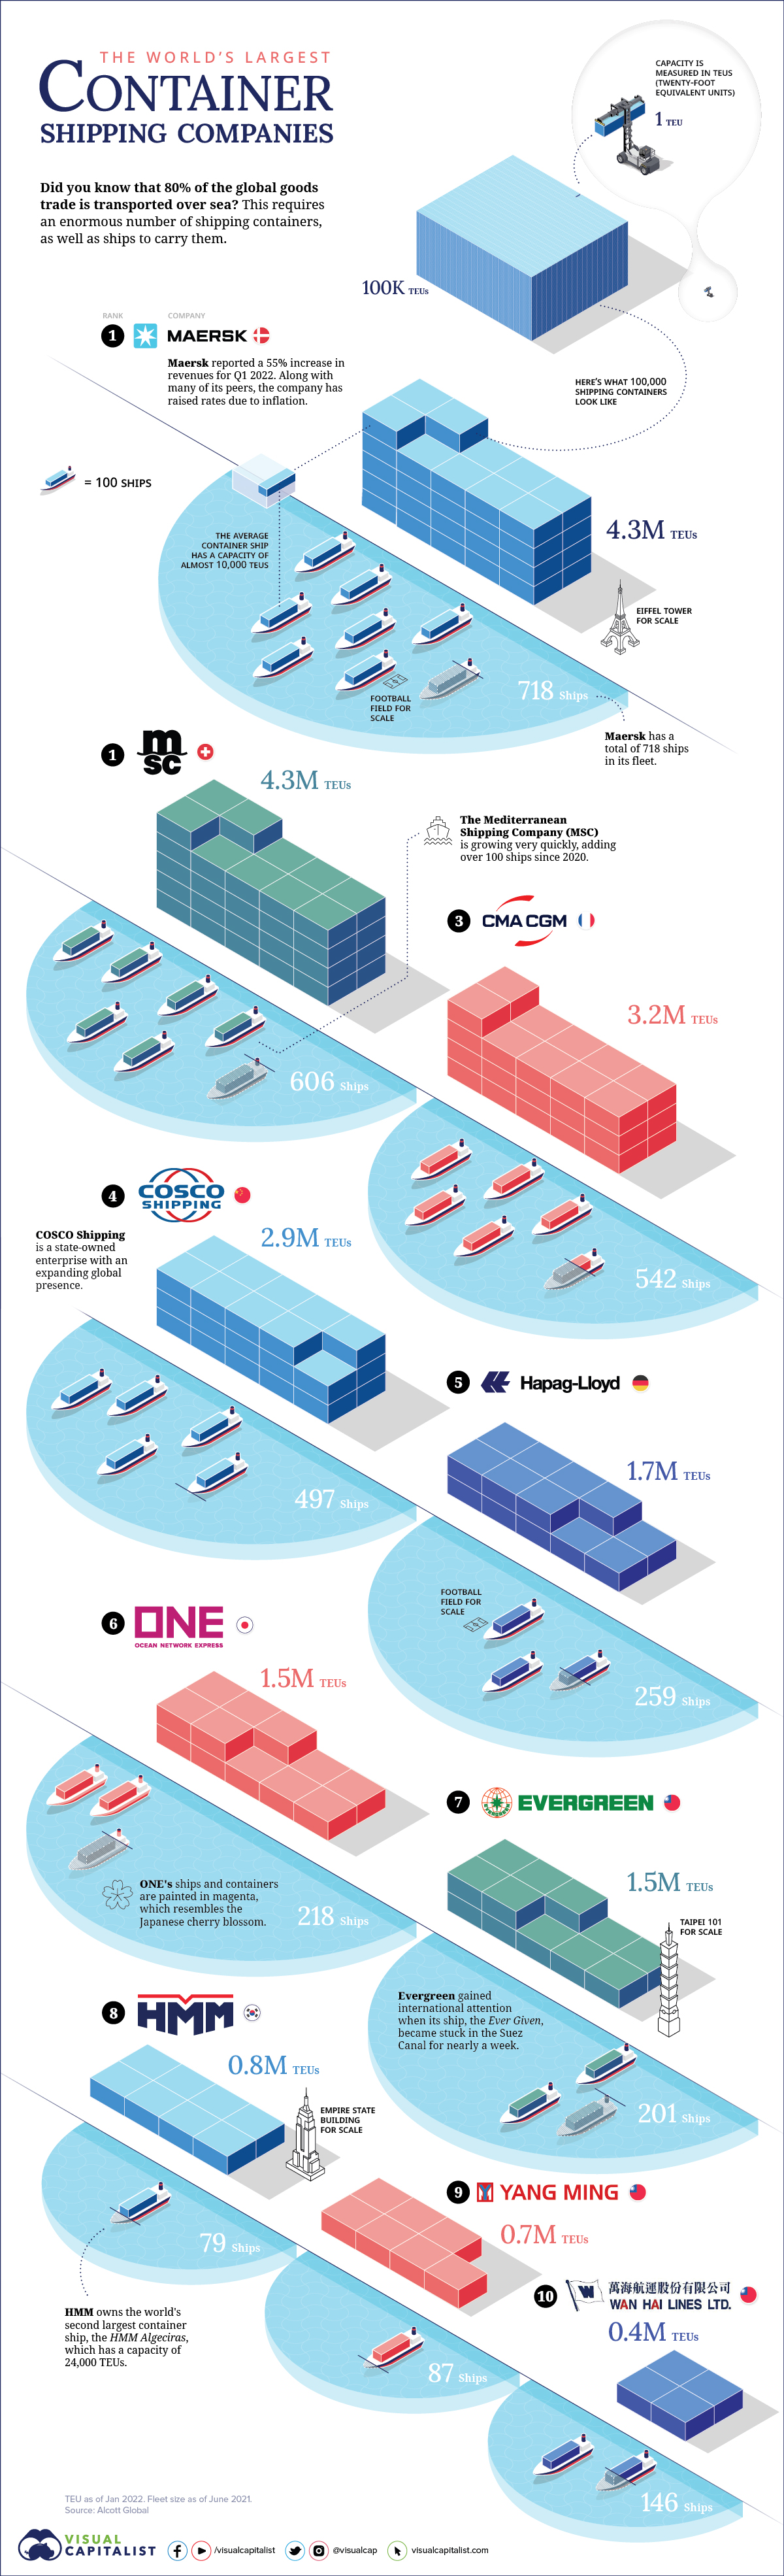
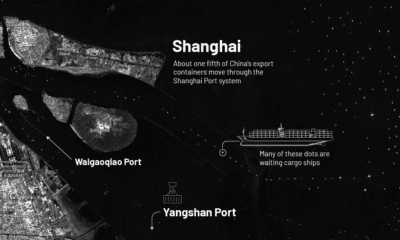
Did you know that 80% of the global goods trade is transported over sea? Given the scale of human consumption, this requires an enormous number of shipping containers, as well as ships to carry them.
At an industry level, container shipping is dominated by several very large firms. This includes Maersk, COSCO Shipping, and Evergreen. If you live along the coast, you’ve probably seen ships or containers with these names painted on them.
Generally speaking, however, consumers know very little about these businesses. This graphic aims to change that by ranking the 10 largest container shipping companies in the world.
Ranking the Top 10
Companies are ranked by two metrics. First is the number of ships they own, and second is their total shipping capacity measured in twenty-foot equivalent units (TEUs). A TEU is based on the volume of a twenty-foot long shipping container.
The data used in this infographic comes from Alcott Global, a logistics consultancy. Fleet sizes are as of June 2021, while TEU capacity is from January 2022.
| Rank | Company | Country | TEU | # of Ships |
|---|---|---|---|---|
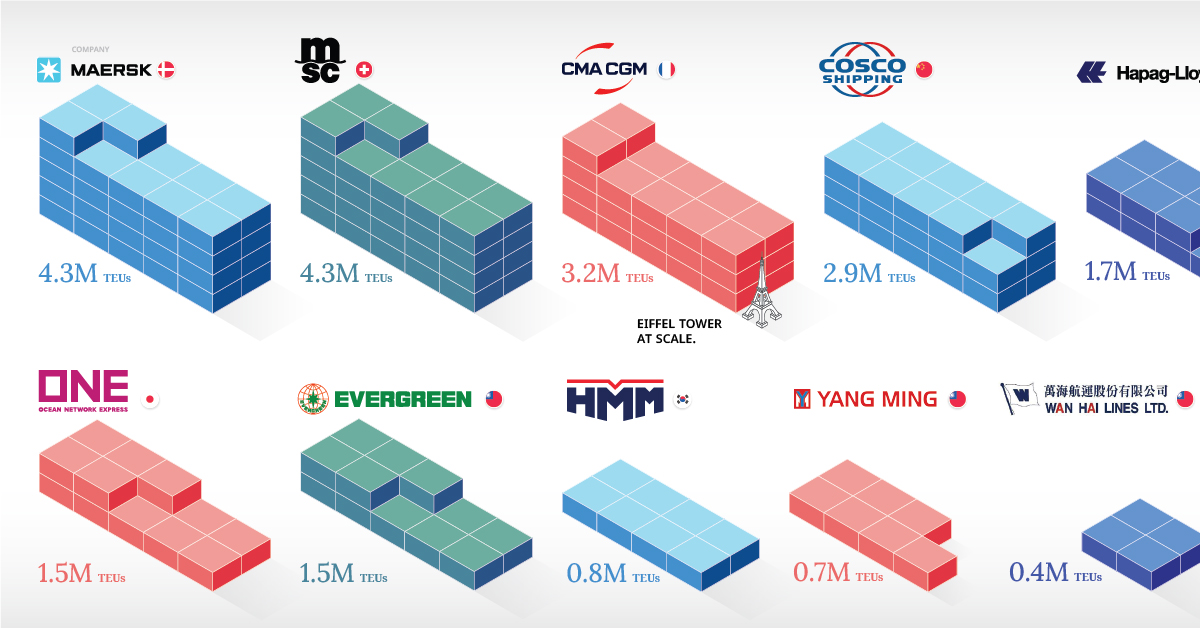
| 1 | Maersk | 🇩🇰 Denmark | 4.3M | 718 |
| 1 | MSC | 🇨🇭 Switz. | 4.3M | 606 |
| 3 | CMA CGM | 🇫🇷 France | 3.2M | 542 |
| 4 | COSCO Shipping | 🇨🇳 China | 2.9M | 497 |
| 5 | Hapag-Lloyd | 🇩🇪 Germany | 1.7M | 259 |
| 6 | Ocean Network Express | 🇯🇵 Japan | 1.5M | 218 |
| 7 | Evergreen Marine | 🇹🇼 Taiwan | 1.5M | 201 |
| 8 | HMM | 🇰🇷 S. Korea | 0.8M | 79 |
| 9 | Yang Ming | 🇹🇼 Taiwan | 0.7M | 87 |
| 10 | Wan Hai Lines | 🇹🇼 Taiwan | 0.4M | 146 |
In this dataset, Maersk and MSC are tied for first place in terms of TEU capacity. This is no longer the case, as news outlets have recently reported that MSC has overtaken the former.
Trailing behind the two industry leaders is a mixture of European and Asian firms. Many of these companies have grown through mergers and acquisitions.
Interesting Facts
Maersk
At the time of writing, Maersk is Denmark’s third largest company by market capitalization. The firm was founded in 1904, making it 118 years old.
MSC
The Mediterranean Shipping Company (MSC) has grown very quickly in recent years, catching up to (and surpassing) long-time leader Maersk in terms of TEU capacity.
The Swiss firm has increased its fleet size through new orders, acquisition of second-hand vessels, and charter deals.
COSCO Shipping
COSCO Shipping is China’s state-owned shipping company. American officials have raised concerns about the firm’s expanding global influence.
For context, Chinese state-owned enterprises have ownership stakes in terminals at five U.S. ports. This includes Terminal 30 at the Port of Seattle, in which two COSCO subsidiaries hold a 33.33% stake.
Moving forward, any further Chinese interest in U.S. terminals will face an even more stringent regulatory environment.
– Kardon (2021)
Evergreen
Evergreen is likely a familiar name, but not for the right reasons. In 2021, one of the company’s ships, Ever Given, became stuck in the Suez Canal, putting one of the world’s most important shipping routes out of commission for nearly a week.
Bulking Up
To achieve better economies of scale, container ships are growing bigger and bigger. The following chart illustrates this trend from 1970 to 2017.
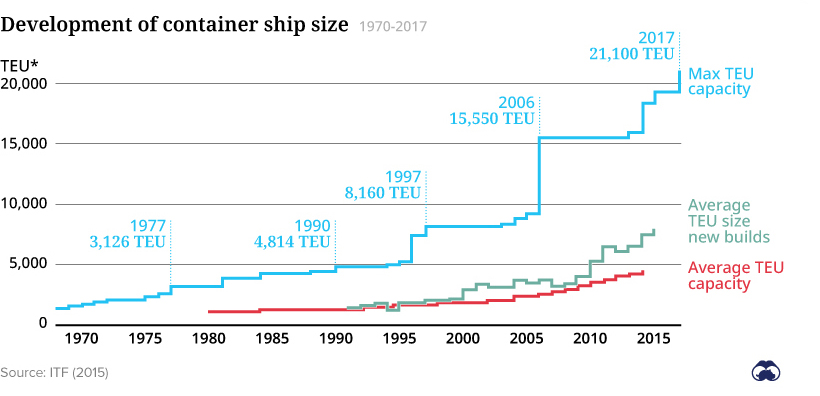
Average capacity is being pulled upwards by the arrival of mega-ships, which are ships that have a capacity of over 18,000 TEUs. Their massive size creates problems for ports that weren’t designed to handle such a high volume of traffic.
It’s worth noting that the largest ship today, the Ever Ace (owned by Evergreen), has a capacity of 24,000 TEUs. Watch this YouTube video for some impressive footage of the ship.
Going Green
Bloomberg reports that shipping accounts for 3% of the world’s carbon emissions. If the industry were a country, that would make it the world’s sixth-largest emitter.
Due to the growth of ESG investing, shipping companies have faced pressure to decarbonize their ships. Progress to this day has been limited, but there are many solutions in the pipeline.
One option is alternative fuels, such as liquefied natural gas (LNG), hydrogen, or biofuels made from plants. These fuels could enable ships to greatly decrease their emissions.
Another option is to completely do away with fuel, and instead return to the centuries-old technology of wind power.


Technology
How Tech Logos Have Evolved Over Time
From complete overhauls to more subtle tweaks, these tech logos have had quite a journey. Featuring: Google, Apple, and more.


How Tech Logos Have Evolved Over Time
This was originally posted on our Voronoi app. Download the app for free on iOS or Android and discover incredible data-driven charts from a variety of trusted sources.
One would be hard-pressed to find a company that has never changed its logo. Granted, some brands—like Rolex, IBM, and Coca-Cola—tend to just have more minimalistic updates. But other companies undergo an entire identity change, thus necessitating a full overhaul.
In this graphic, we visualized the evolution of prominent tech companies’ logos over time. All of these brands ranked highly in a Q1 2024 YouGov study of America’s most famous tech brands. The logo changes are sourced from 1000logos.net.
How Many Times Has Google Changed Its Logo?
Google and Facebook share a 98% fame rating according to YouGov. But while Facebook’s rise was captured in The Social Network (2010), Google’s history tends to be a little less lionized in popular culture.
For example, Google was initially called “Backrub” because it analyzed “back links” to understand how important a website was. Since its founding, Google has undergone eight logo changes, finally settling on its current one in 2015.
| Company | Number of Logo Changes |
|---|---|
| 8 | |
| HP | 8 |
| Amazon | 6 |
| Microsoft | 6 |
| Samsung | 6 |
| Apple | 5* |
Note: *Includes color changes. Source: 1000Logos.net
Another fun origin story is Microsoft, which started off as Traf-O-Data, a traffic counter reading company that generated reports for traffic engineers. By 1975, the company was renamed. But it wasn’t until 2012 that Microsoft put the iconic Windows logo—still the most popular desktop operating system—alongside its name.
And then there’s Samsung, which started as a grocery trading store in 1938. Its pivot to electronics started in the 1970s with black and white television sets. For 55 years, the company kept some form of stars from its first logo, until 1993, when the iconic encircled blue Samsung logo debuted.
Finally, Apple’s first logo in 1976 featured Isaac Newton reading under a tree—moments before an apple fell on his head. Two years later, the iconic bitten apple logo would be designed at Steve Jobs’ behest, and it would take another two decades for it to go monochrome.

-

 Markets1 week ago
U.S. Debt Interest Payments Reach $1 Trillion
-

 Business2 weeks ago
Charted: Big Four Market Share by S&P 500 Audits
-

 Real Estate2 weeks ago
Ranked: The Most Valuable Housing Markets in America
-

 Money2 weeks ago
Which States Have the Highest Minimum Wage in America?
-

 AI2 weeks ago
Ranked: Semiconductor Companies by Industry Revenue Share
-

 Markets2 weeks ago
Ranked: The World’s Top Flight Routes, by Revenue
-

 Demographics2 weeks ago
Population Projections: The World’s 6 Largest Countries in 2075
-

 Markets2 weeks ago
The Top 10 States by Real GDP Growth in 2023