Datastream
Mapped: The 25 Richest Countries in the World


The Briefing
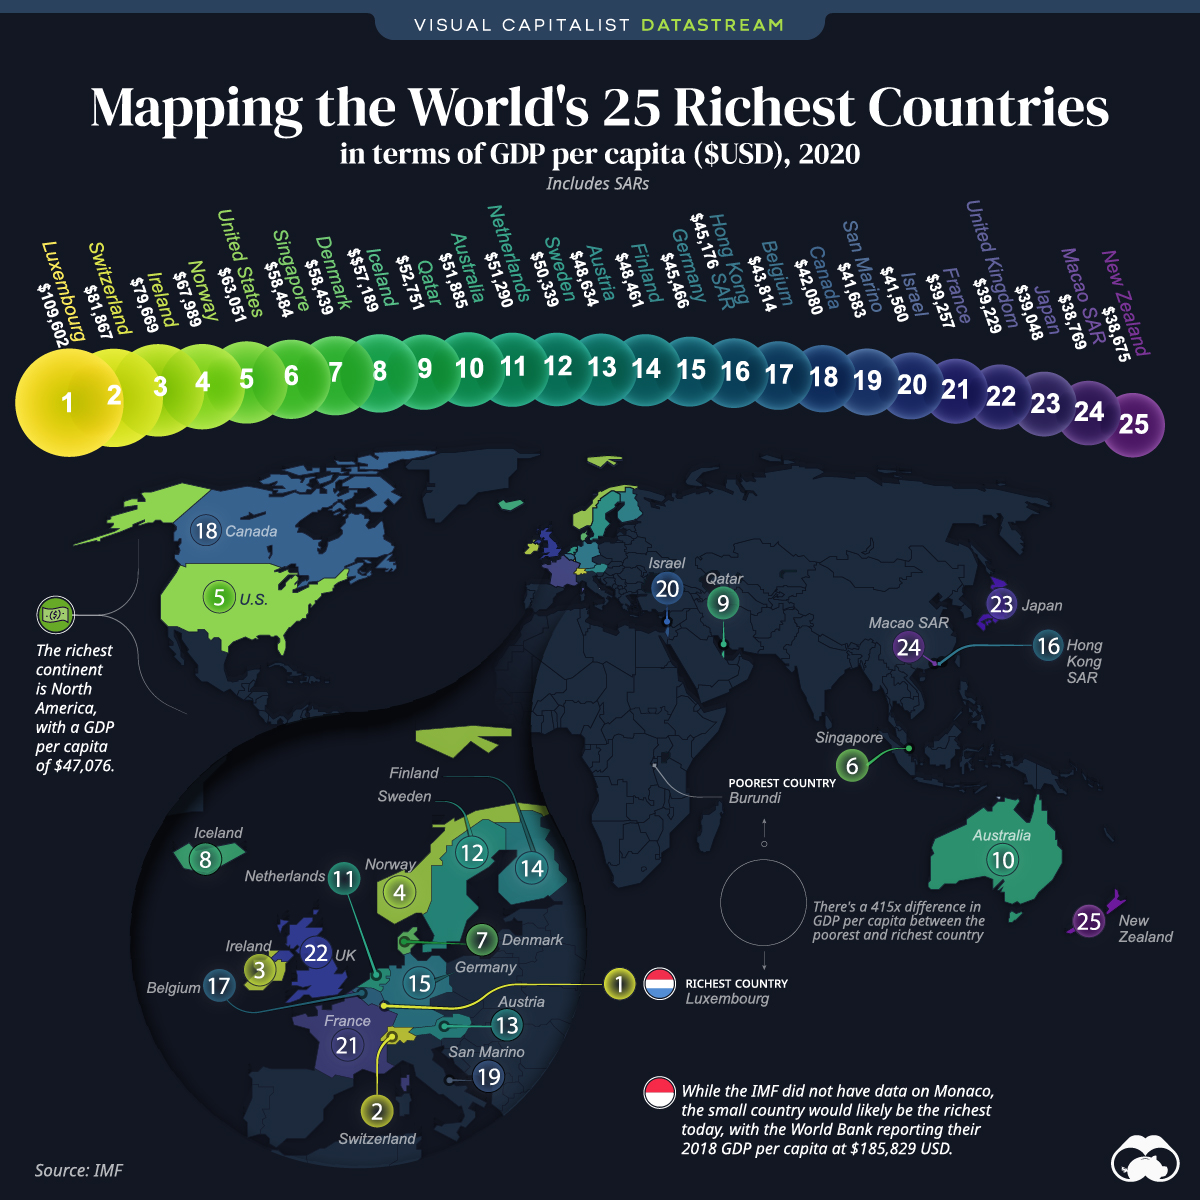
- The richest country in the world is Luxembourg with a GDP per capita of over $109,000
- The world’s 25 richest countries are located across North America, Europe, Asia, and Oceania
Mapped: The 25 Richest Countries in the World
Which are the richest countries in the world, by nominal GDP per capita?
This map looks at the top 25 countries by this metric. They’re located across North America, Europe, Asia, and Oceania. Notably, no South American or African countries make the list.
| Country | GDP per capita (USD) |
|---|---|
| 🇱🇺 Luxembourg | $109,602.32 |
| 🇨🇭 Switzerland | $81,867.46 |
| 🇮🇪 Ireland | $79,668.50 |
| 🇳🇴 Norway | $67,988.59 |
| 🇺🇸 United States | $63,051.40 |
| 🇸🇬 Singapore | $58,483.96 |
| 🇩🇰 Denmark | $58,438.85 |
| 🇮🇸 Iceland | $57,189.03 |
| 🇶🇦 Qatar | $52,751.11 |
| 🇦🇺 Australia | $51,885.47 |
| 🇳🇱 Netherlands | $51,289.57 |
| 🇸🇪 Sweden | $50,339.20 |
| 🇦🇹 Austria | $48,634.34 |
| 🇫🇮 Finland | $48,461.48 |
| 🇩🇪 Germany | $45,466.12 |
| 🇭🇰 Hong Kong SAR | $45,175.73 |
| 🇧🇪 Belgium | $43,813.80 |
| 🇨🇦 Canada | $42,080.10 |
| 🇸🇲 San Marino | $41,682.81 |
| 🇮🇱 Israel | $41,559.51 |
| 🇫🇷 France | $39,257.43 |
| 🇬🇧 United Kingdom | $39,228.52 |
| 🇯🇵 Japan | $39,047.90 |
| 🇲🇴 Macao SAR | $38,769.20 |
| 🇳🇿 New Zealand | $38,675.32 |
Although number one on the global stage in terms of total GDP, the U.S. places fifth with a GDP per capita of $63,051.
Interestingly, a number of countries with smaller population sizes have a high GDP per capita. For example, Iceland makes the top 10 at $57,189, but the island’s population is only around 342,000 people. Similarly, Luxembourg’s population is just under 633,000—but it’s the richest country in the world on a per capita basis.
Building Wealth
So how did these countries become so well off?
Looking at history, most high-income countries went through a similar linear journey. Beginning with agriculture-based economies, they went through a period of rapid industrialization, and finally became service-based economies.
In Luxembourg today, one of the top industries is banking and financial services, for example. Here’s a look at some of the top industries in the next five richest countries:
- 🇨🇭 Switzerland:
Banking and financial services, agriculture - 🇮🇪 Ireland:
Natural resources (including agriculture, fisheries, forestry, and mining), pharmaceuticals - 🇳🇴 Norway:
Oil and gas, hydropower, seafood - 🇺🇸 U.S.:
Real estate, healthcare, technology - 🇸🇬 Singapore:
Financial services, manufacturing, oil and gas
The world’s wealthiest economies will likely remain on top for the foreseeable future, though some may experience plateauing growth. In Japan, for example, the domestic market is beginning to shrink due to an aging population.
Regardless, the wealth of these countries today is astounding, with the richest country in the world having a GDP per capita of 415x more than the poorest country in the world.
Where does this data come from?
Source: IMF
Details: GDP per capita is measured in $USD, 2020. In IMF’s database, Macao SAR and Hong Kong SAR are both listed separately from China.


Datastream
Can You Calculate Your Daily Carbon Footprint?
Discover how the average person’s carbon footprint impacts the environment and learn how carbon credits can offset your carbon footprint.


The Briefing
- A person’s carbon footprint is substantial, with activities such as food consumption creating as much as 4,500 g of CO₂ emissions daily.
- By purchasing carbon credits from Carbon Streaming Corporation, you can offset your own emissions and fund positive climate action.
Your Everyday Carbon Footprint
While many large businesses and countries have committed to net-zero goals, it is essential to acknowledge that your everyday activities also contribute to global emissions.
In this graphic, sponsored by Carbon Streaming Corporation, we will explore how the choices we make and the products we use have a profound impact on our carbon footprint.
Carbon Emissions by Activity
Here are some of the daily activities and products of the average person and their carbon footprint, according to Clever Carbon.
| Household Activities & Products | CO2 Emissions (g) |
|---|---|
| 💡 Standard Light Bulb (100 watts, four hours) | 172 g |
| 📱 Mobile Phone Use (195 minutes per day)* | 189 g |
| 👕 Washing Machine (0.63 kWh) | 275 g |
| 🔥 Electric Oven (1.56 kWh) | 675 g |
| ♨️ Tumble Dryer (2.5 kWh) | 1,000 g |
| 🧻 Toilet Roll (2 ply) | 1,300 g |
| 🚿 Hot Shower (10 mins) | 2,000 g |
| 🚙 Daily Commute (one hour, by car) | 3,360 g |
| 🍽️ Average Daily Food Consumption (three meals of 600 calories) | 4,500 g |
| *Phone use based on yearly use of 69kg per the source, Reboxed | |
Your choice of transportation plays a crucial role in determining your carbon footprint. For instance, a 15 km daily commute to work on public transport generates an average of 1,464 g of CO₂ emissions. Compared to 3,360 g—twice the volume for a journey the same length by car.
By opting for more sustainable modes of transport, such as cycling, walking, or public transportation, you can significantly reduce your carbon footprint.
Addressing Your Carbon Footprint
One way to compensate for your emissions is by purchasing high-quality carbon credits.
Carbon credits are used to help fund projects that avoid, reduce or remove CO₂ emissions. This includes nature-based solutions such as reforestation and improved forest management, or technology-based solutions such as the production of biochar and carbon capture and storage (CCS).
While carbon credits offer a potential solution for individuals to help reduce global emissions, public awareness remains a significant challenge. A BCG-Patch survey revealed that only 34% of U.S. consumers are familiar with carbon credits, and only 3% have purchased them in the past.
About Carbon Streaming
By financing the creation or expansion of carbon projects, Carbon Streaming Corporation secures the rights to future carbon credits generated by these sustainable projects. You can then purchase these carbon credits to help fund climate solutions around the world and compensate for your own emissions.
Ready to get involved?
>> Learn more about purchasing carbon credits at Carbon Streaming

-

 Debt1 week ago
How Debt-to-GDP Ratios Have Changed Since 2000
-

 Markets2 weeks ago
Ranked: The World’s Top Flight Routes, by Revenue
-

 Countries2 weeks ago
Population Projections: The World’s 6 Largest Countries in 2075
-

 Markets2 weeks ago
The Top 10 States by Real GDP Growth in 2023
-

 Demographics2 weeks ago
The Smallest Gender Wage Gaps in OECD Countries
-

 United States2 weeks ago
Where U.S. Inflation Hit the Hardest in March 2024
-

 Green2 weeks ago
Top Countries By Forest Growth Since 2001
-

 United States2 weeks ago
Ranked: The Largest U.S. Corporations by Number of Employees