Datastream
Mapped: The 25 Poorest Countries in the World


The Briefing
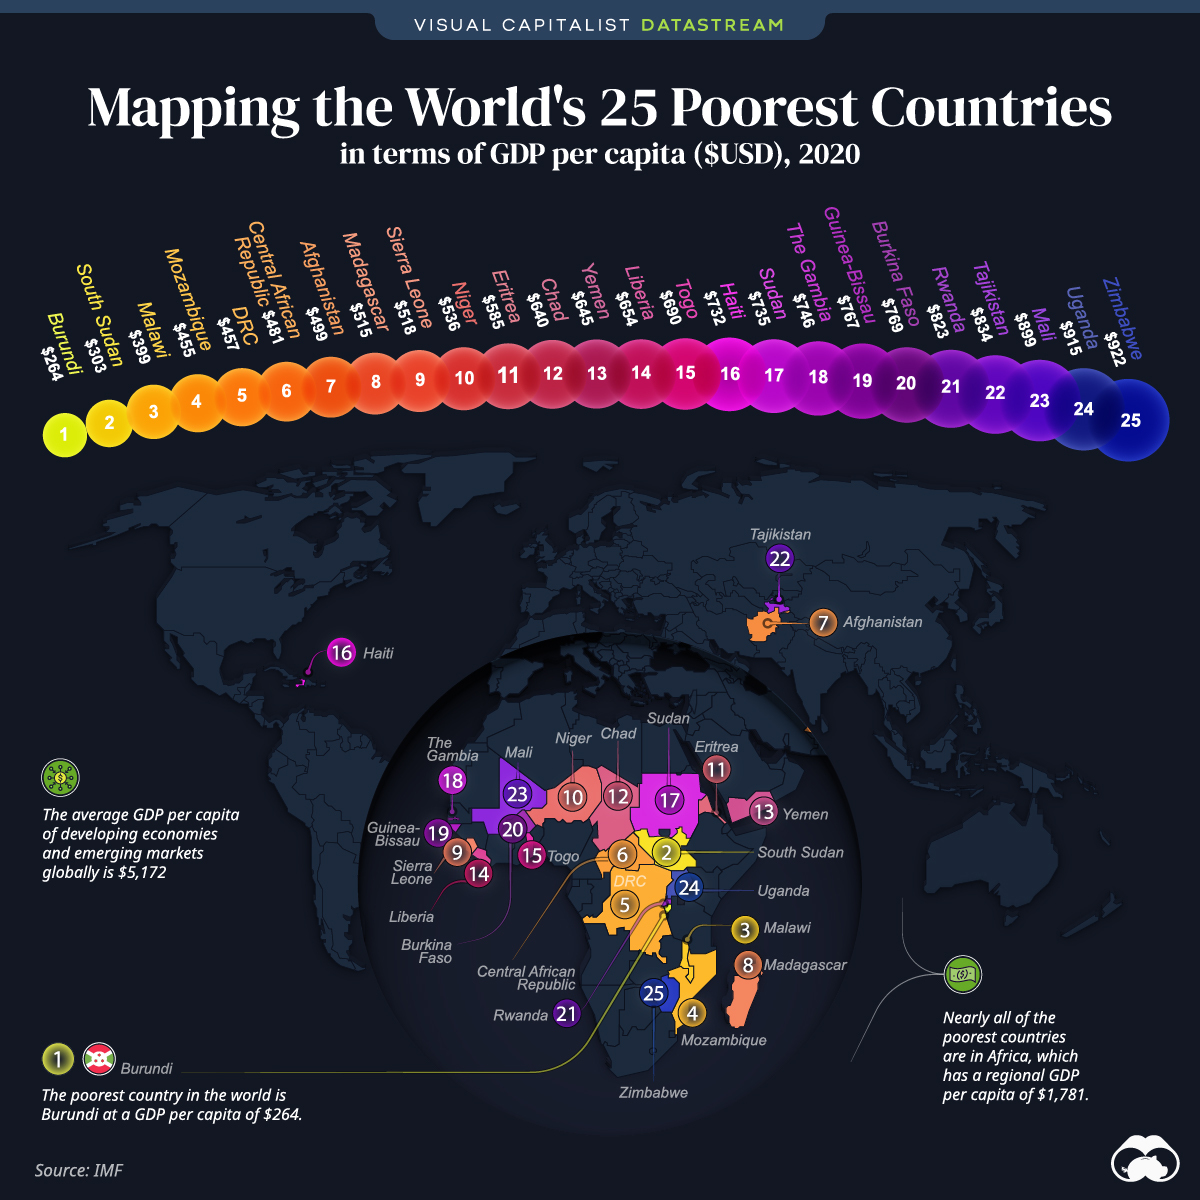
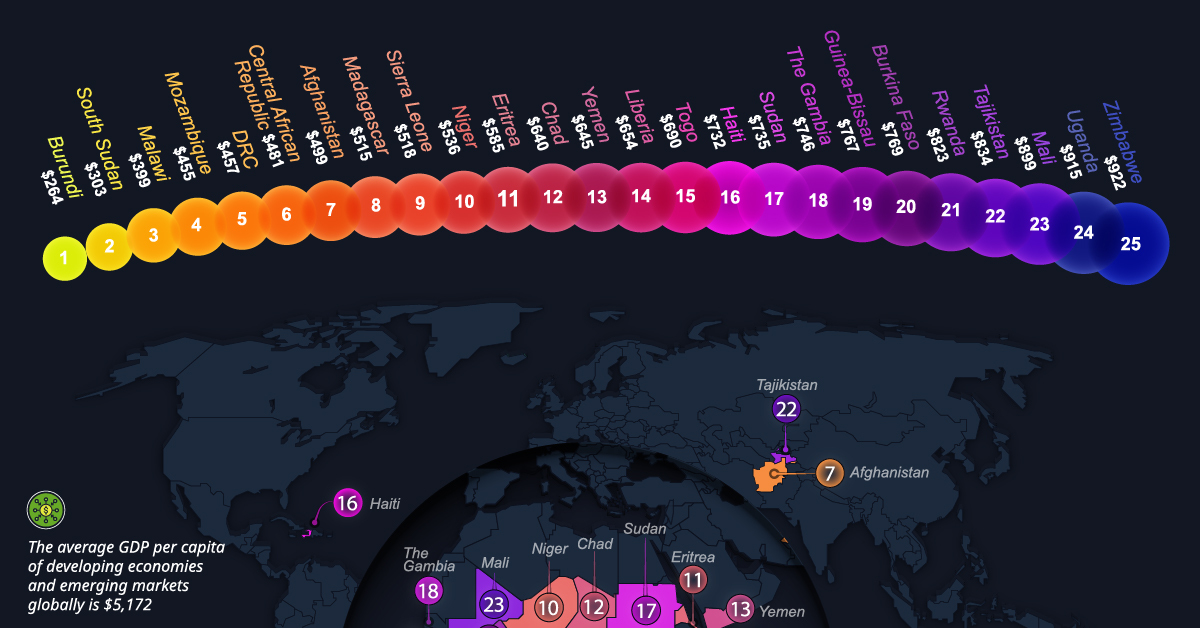
- The poorest country in the world is Burundi with a GDP per capita of $264
- Nearly all of the world’s poorest countries are in Africa, though Haiti, Tajikistan, Yemen, and Afghanistan are notable exceptions
Mapped: The 25 Poorest Countries in the World
Having looked at the richest countries in the world, which nations are at the bottom of the list in terms of GDP per capita, in nominal terms?
This map looks at the world’s 25 poorest countries by this metric.
| Country | GDP per capita (USD) |
|---|---|
| 🇧🇮 Burundi | $263.67 |
| 🇸🇸 South Sudan | $303.15 |
| 🇲🇼 Malawi | $399.10 |
| 🇲🇿 Mozambique | $455.01 |
| 🇨🇩 Democratic Republic of the Congo (DRC) | $456.89 |
| 🇨🇫 Central African Republic | $480.50 |
| 🇦🇫 Afghanistan | $499.44 |
| 🇲🇬 Madagascar | $514.85 |
| 🇸🇱 Sierra Leone | $518.47 |
| 🇳🇪 Niger | $535.83 |
| 🇪🇷 Eritrea | $585.16 |
| 🇹🇩 Chad | $639.85 |
| 🇾🇪 Yemen | $645.13 |
| 🇱🇷 Liberia | $653.60 |
| 🇹🇬 Togo | $690.28 |
| 🇭🇹 Haiti | $732.07 |
| 🇸🇩 Sudan | $734.60 |
| 🇬🇲 The Gambia | $746.33 |
| 🇬🇼 Guinea-Bissau | $766.75 |
| 🇧🇫 Burkina Faso | $768.83 |
| 🇷🇼 Rwanda | $823.40 |
| 🇹🇯 Tajikistan | $833.55 |
| 🇲🇱 Mali | $899.22 |
| 🇺🇬 Uganda | $915.35 |
| 🇿🇼 Zimbabwe | $921.85 |
All but four of these countries are located on the African continent.
Additionally, all of the 25 poorest countries, with the exception of Zimbabwe and Tajikistan, are considered Least Developed Countries (LDCs) by the UN. LDCs are categorized by criteria based on per capita income, human assets (such as education level), and economic vulnerability. Today, more than 75% of the population in LDCs live below the poverty line.
For added perspective, the average GDP per capita of all developing economies and emerging markets globally is $5,172.
Emerging Markets
Developing countries, while having much smaller economies, have one thing that the richest countries don’t have: immense room for economic growth.
Most of the poorest countries’ strongest industries are agriculture, mining, manufacturing, and so on, and the world is heavily reliant on the flow of raw materials and resources coming from developing nations.
Focusing on the African countries listed, the economic potential is significant. Africa’s infrastructure is currently improving at a rapid rate, opening the door for foreign direct investment and increased capacity for industrialization. In large part, this progress is thanks to China’s Belt and Road initiative and investment in multiple African countries.
Another signal of Africa’s potential is the extremely large share of young people on the continent. Here’s a look at the five countries in the world with the highest shares of their population aged younger than 15, all of which are in Africa:
- 🇳🇪 Niger: 49.8%
- 🇲🇱 Mali: 47.3%
- 🇹🇩 Chad: 46.8%
- 🇦🇴 Angola: 46.6%
- 🇺🇬 Uganda: 46.5%
In Niger, an astounding near half of the population is under the age of 15 years old. This could translate into a large future workforce, a growing domestic market, and potential for innovation and economic progress.
Overall, while today the poorest countries still have extremely low standards of living, the economic potential is there for future growth.
Where does this data come from?
Source: IMF
Details: GDP per capita is measured in $USD, 2020.


Datastream
Can You Calculate Your Daily Carbon Footprint?
Discover how the average person’s carbon footprint impacts the environment and learn how carbon credits can offset your carbon footprint.


The Briefing
- A person’s carbon footprint is substantial, with activities such as food consumption creating as much as 4,500 g of CO₂ emissions daily.
- By purchasing carbon credits from Carbon Streaming Corporation, you can offset your own emissions and fund positive climate action.
Your Everyday Carbon Footprint
While many large businesses and countries have committed to net-zero goals, it is essential to acknowledge that your everyday activities also contribute to global emissions.
In this graphic, sponsored by Carbon Streaming Corporation, we will explore how the choices we make and the products we use have a profound impact on our carbon footprint.
Carbon Emissions by Activity
Here are some of the daily activities and products of the average person and their carbon footprint, according to Clever Carbon.
| Household Activities & Products | CO2 Emissions (g) |
|---|---|
| 💡 Standard Light Bulb (100 watts, four hours) | 172 g |
| 📱 Mobile Phone Use (195 minutes per day)* | 189 g |
| 👕 Washing Machine (0.63 kWh) | 275 g |
| 🔥 Electric Oven (1.56 kWh) | 675 g |
| ♨️ Tumble Dryer (2.5 kWh) | 1,000 g |
| 🧻 Toilet Roll (2 ply) | 1,300 g |
| 🚿 Hot Shower (10 mins) | 2,000 g |
| 🚙 Daily Commute (one hour, by car) | 3,360 g |
| 🍽️ Average Daily Food Consumption (three meals of 600 calories) | 4,500 g |
| *Phone use based on yearly use of 69kg per the source, Reboxed | |
Your choice of transportation plays a crucial role in determining your carbon footprint. For instance, a 15 km daily commute to work on public transport generates an average of 1,464 g of CO₂ emissions. Compared to 3,360 g—twice the volume for a journey the same length by car.
By opting for more sustainable modes of transport, such as cycling, walking, or public transportation, you can significantly reduce your carbon footprint.
Addressing Your Carbon Footprint
One way to compensate for your emissions is by purchasing high-quality carbon credits.
Carbon credits are used to help fund projects that avoid, reduce or remove CO₂ emissions. This includes nature-based solutions such as reforestation and improved forest management, or technology-based solutions such as the production of biochar and carbon capture and storage (CCS).
While carbon credits offer a potential solution for individuals to help reduce global emissions, public awareness remains a significant challenge. A BCG-Patch survey revealed that only 34% of U.S. consumers are familiar with carbon credits, and only 3% have purchased them in the past.
About Carbon Streaming
By financing the creation or expansion of carbon projects, Carbon Streaming Corporation secures the rights to future carbon credits generated by these sustainable projects. You can then purchase these carbon credits to help fund climate solutions around the world and compensate for your own emissions.
Ready to get involved?
>> Learn more about purchasing carbon credits at Carbon Streaming

-

 Misc1 week ago
How Hard Is It to Get Into an Ivy League School?
-

 Technology2 weeks ago
Ranked: Semiconductor Companies by Industry Revenue Share
-

 Markets2 weeks ago
Ranked: The World’s Top Flight Routes, by Revenue
-

 Countries2 weeks ago
Population Projections: The World’s 6 Largest Countries in 2075
-

 Markets2 weeks ago
The Top 10 States by Real GDP Growth in 2023
-

 Demographics2 weeks ago
The Smallest Gender Wage Gaps in OECD Countries
-

 United States2 weeks ago
Where U.S. Inflation Hit the Hardest in March 2024
-

 Green2 weeks ago
Top Countries By Forest Growth Since 2001