Datastream
Top Smartphone Brands, By Global Sales


The Briefing
- In 2020, Samsung remained the top smartphone vendor based on units sold
- Of the top five brands, Apple and Xiaomi were the only ones that saw sales increase in 2020
- China is expected to see the most sales in 2021, but the highest growth areas are projected to be in Western Europe, Latin America, and in more mature markets in the Asia-Pacific
Top Smartphone Brands, By Global Sales
Many industries took a hit last year, and the smartphone market was no exception—in 2020, smartphone sales worldwide dropped by 12%.
Yet, despite an overall decrease, two of the top five global brands—Apple and Xiaomi—experienced an uptick in sales from the year prior.
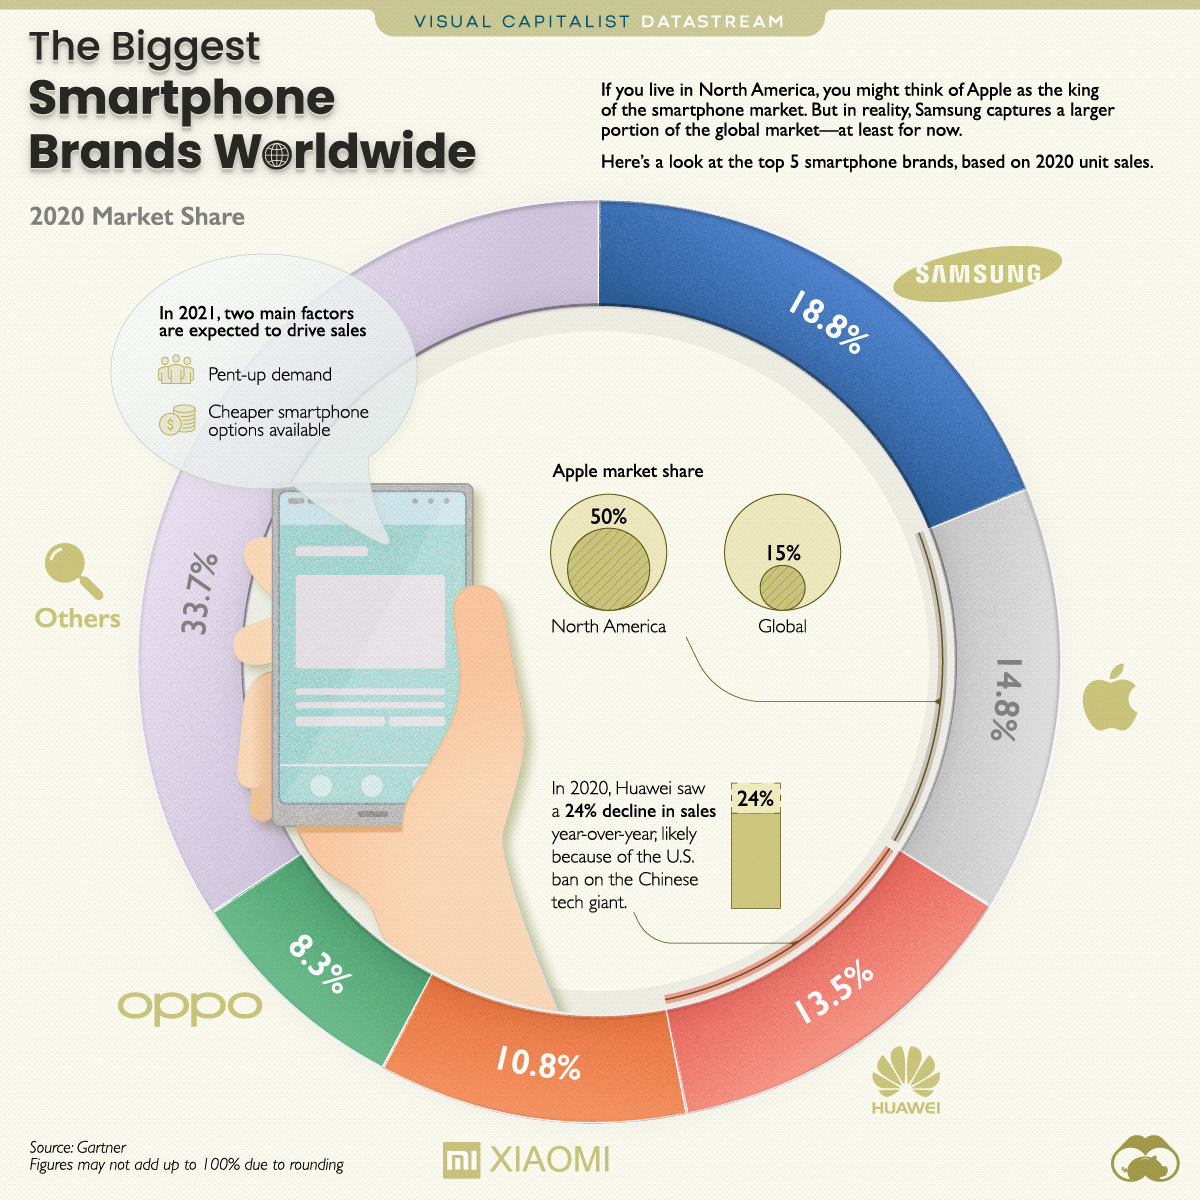
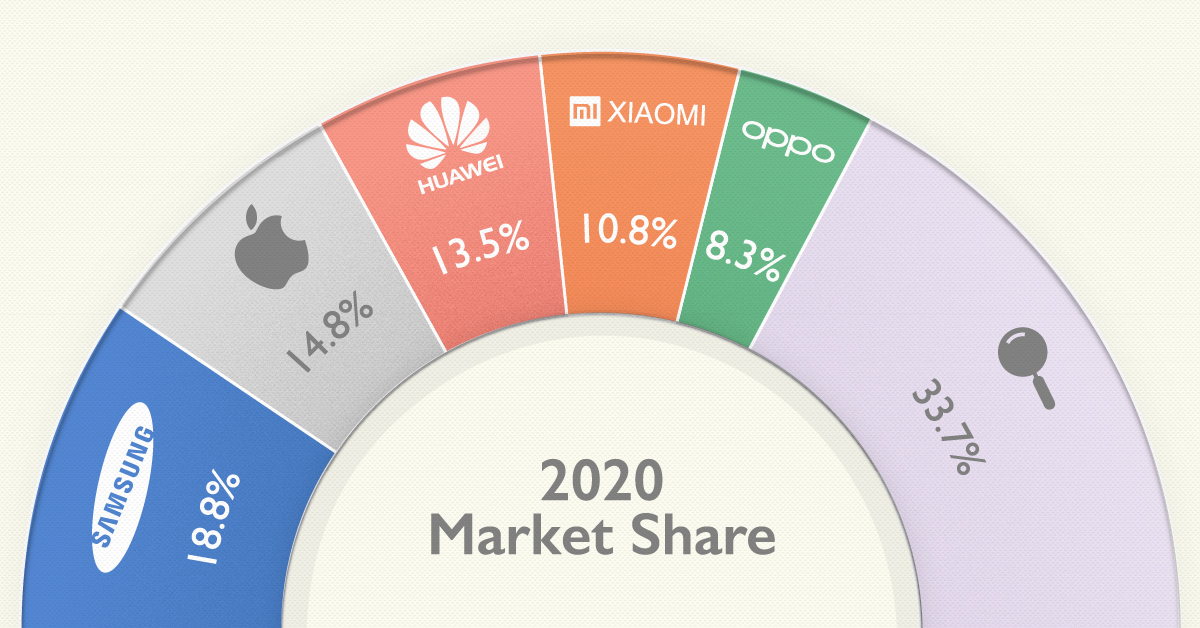
Here’s a look at the top smartphone brands in 2020, by units sold:
| Vendor | 2020 Sales (millions of units) | 2020 Market Share | 2020-2019 Growth |
|---|---|---|---|
| Samsung | 253.0 | 18.8% | -14.6% |
| Apple | 199.8 | 14.8% | 3.3% |
| Huawei | 182.6 | 13.5% | -24.1% |
| Xiaomi | 145.8 | 10.8% | 15.7% |
| OPPO | 111.8 | 8.3% | -5.8% |
| Others | 454.8 | 33.7% | -19.6% |
| Total | 1,347.9 | 100.0% | -12.5% |
Samsung is King, For Now At Least
Samsung remains the top smartphone manufacturer—at least for now—capturing almost 19% of the global market in 2020. That’s about the same portion of market share it held back in 2019.
Yet, while Samsung’s market share remains relatively intact, sales did drop by almost 15% in 2020. That’s a slightly bigger dip than the overall market, which experienced a 12.5% decline in sales last year.
Meanwhile, Apple crawled up the ranks in 2020, surpassing Huawei and claiming the number two spot on the list. The U.S. company launched the iPhone 12 in October 2020, which boosted Q4 2020 unit sales by almost 15% compared to Q4 2019.
Forecast for 2021
The future looks promising for global smartphone sales, and this year is no exception. In fact, Gartner expects 11.4% growth in comparison to last year.
According to Gartner, growth is on the horizon for two main reasons—delayed device replacement, which was reflected in last year’s sales slump, and increased availability of new, more affordable products.
» Like this? Then you might also like: Visualized: A Snapshot of the Global Personal Tech Market
Where does this data come from?
Source: Gartner
Notes: According to Gartner, Mature Asia Pacific refers to Australia, Japan, New Zealand, Singapore, and South Korea. Sales data is from 2020.


Datastream
Can You Calculate Your Daily Carbon Footprint?
Discover how the average person’s carbon footprint impacts the environment and learn how carbon credits can offset your carbon footprint.


The Briefing
- A person’s carbon footprint is substantial, with activities such as food consumption creating as much as 4,500 g of CO₂ emissions daily.
- By purchasing carbon credits from Carbon Streaming Corporation, you can offset your own emissions and fund positive climate action.
Your Everyday Carbon Footprint
While many large businesses and countries have committed to net-zero goals, it is essential to acknowledge that your everyday activities also contribute to global emissions.
In this graphic, sponsored by Carbon Streaming Corporation, we will explore how the choices we make and the products we use have a profound impact on our carbon footprint.
Carbon Emissions by Activity
Here are some of the daily activities and products of the average person and their carbon footprint, according to Clever Carbon.
| Household Activities & Products | CO2 Emissions (g) |
|---|---|
| 💡 Standard Light Bulb (100 watts, four hours) | 172 g |
| 📱 Mobile Phone Use (195 minutes per day)* | 189 g |
| 👕 Washing Machine (0.63 kWh) | 275 g |
| 🔥 Electric Oven (1.56 kWh) | 675 g |
| ♨️ Tumble Dryer (2.5 kWh) | 1,000 g |
| 🧻 Toilet Roll (2 ply) | 1,300 g |
| 🚿 Hot Shower (10 mins) | 2,000 g |
| 🚙 Daily Commute (one hour, by car) | 3,360 g |
| 🍽️ Average Daily Food Consumption (three meals of 600 calories) | 4,500 g |
| *Phone use based on yearly use of 69kg per the source, Reboxed | |
Your choice of transportation plays a crucial role in determining your carbon footprint. For instance, a 15 km daily commute to work on public transport generates an average of 1,464 g of CO₂ emissions. Compared to 3,360 g—twice the volume for a journey the same length by car.
By opting for more sustainable modes of transport, such as cycling, walking, or public transportation, you can significantly reduce your carbon footprint.
Addressing Your Carbon Footprint
One way to compensate for your emissions is by purchasing high-quality carbon credits.
Carbon credits are used to help fund projects that avoid, reduce or remove CO₂ emissions. This includes nature-based solutions such as reforestation and improved forest management, or technology-based solutions such as the production of biochar and carbon capture and storage (CCS).
While carbon credits offer a potential solution for individuals to help reduce global emissions, public awareness remains a significant challenge. A BCG-Patch survey revealed that only 34% of U.S. consumers are familiar with carbon credits, and only 3% have purchased them in the past.
About Carbon Streaming
By financing the creation or expansion of carbon projects, Carbon Streaming Corporation secures the rights to future carbon credits generated by these sustainable projects. You can then purchase these carbon credits to help fund climate solutions around the world and compensate for your own emissions.
Ready to get involved?
>> Learn more about purchasing carbon credits at Carbon Streaming

-

 Education1 week ago
How Hard Is It to Get Into an Ivy League School?
-

 Technology2 weeks ago
Ranked: Semiconductor Companies by Industry Revenue Share
-

 Markets2 weeks ago
Ranked: The World’s Top Flight Routes, by Revenue
-

 Demographics2 weeks ago
Population Projections: The World’s 6 Largest Countries in 2075
-

 Markets2 weeks ago
The Top 10 States by Real GDP Growth in 2023
-

 Demographics2 weeks ago
The Smallest Gender Wage Gaps in OECD Countries
-

 Economy2 weeks ago
Where U.S. Inflation Hit the Hardest in March 2024
-

 Green2 weeks ago
Top Countries By Forest Growth Since 2001