Real Estate
Charting 20 Years of Home Price Changes in Every U.S. City
At the turn of the century, the average U.S. home value was $126,000. Today, that figure is at a record high $259,000 – a 106% increase in just two decades.
Of course, the path from A to B was anything but linear with a financial crisis, housing bubbles in major cities, and now COVID-19, which is drastically altering market dynamics.
How has the housing market evolved, on a city-by-city basis?
Two Decades of Housing Prices
The interactive visual below – created by Avison Young Global, using data from Zillow – is a comprehensive look at U.S. home price data over the past two decades.
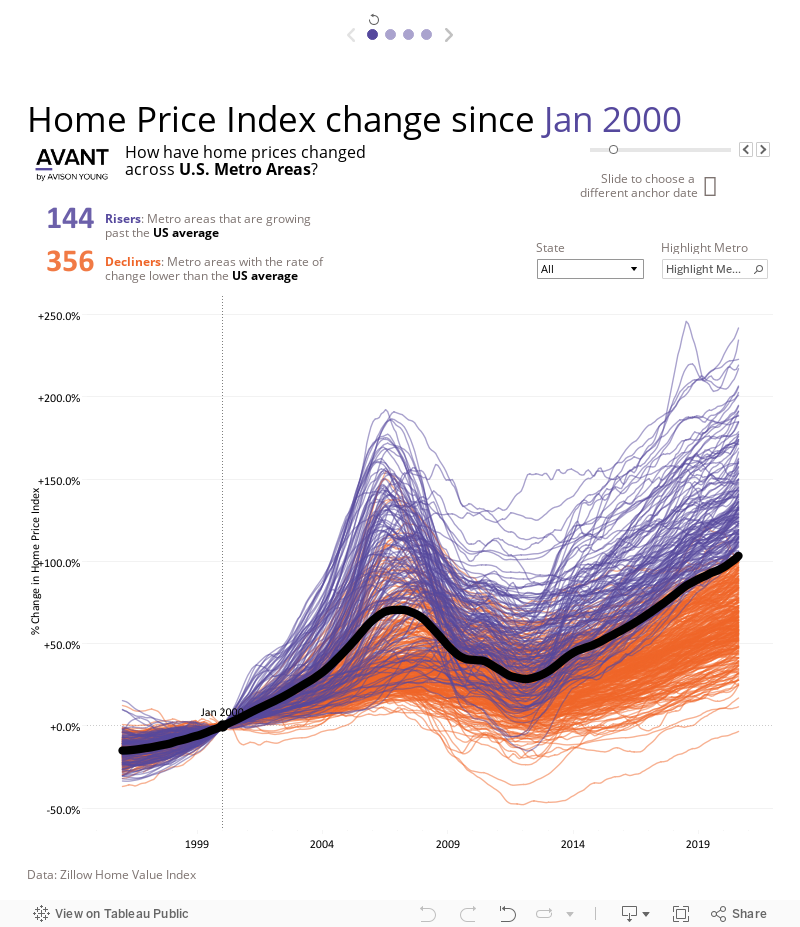
Editor’s note: Click the circles at the top of the visualization to see other versions of the data, including price changes at the state and zip code level.
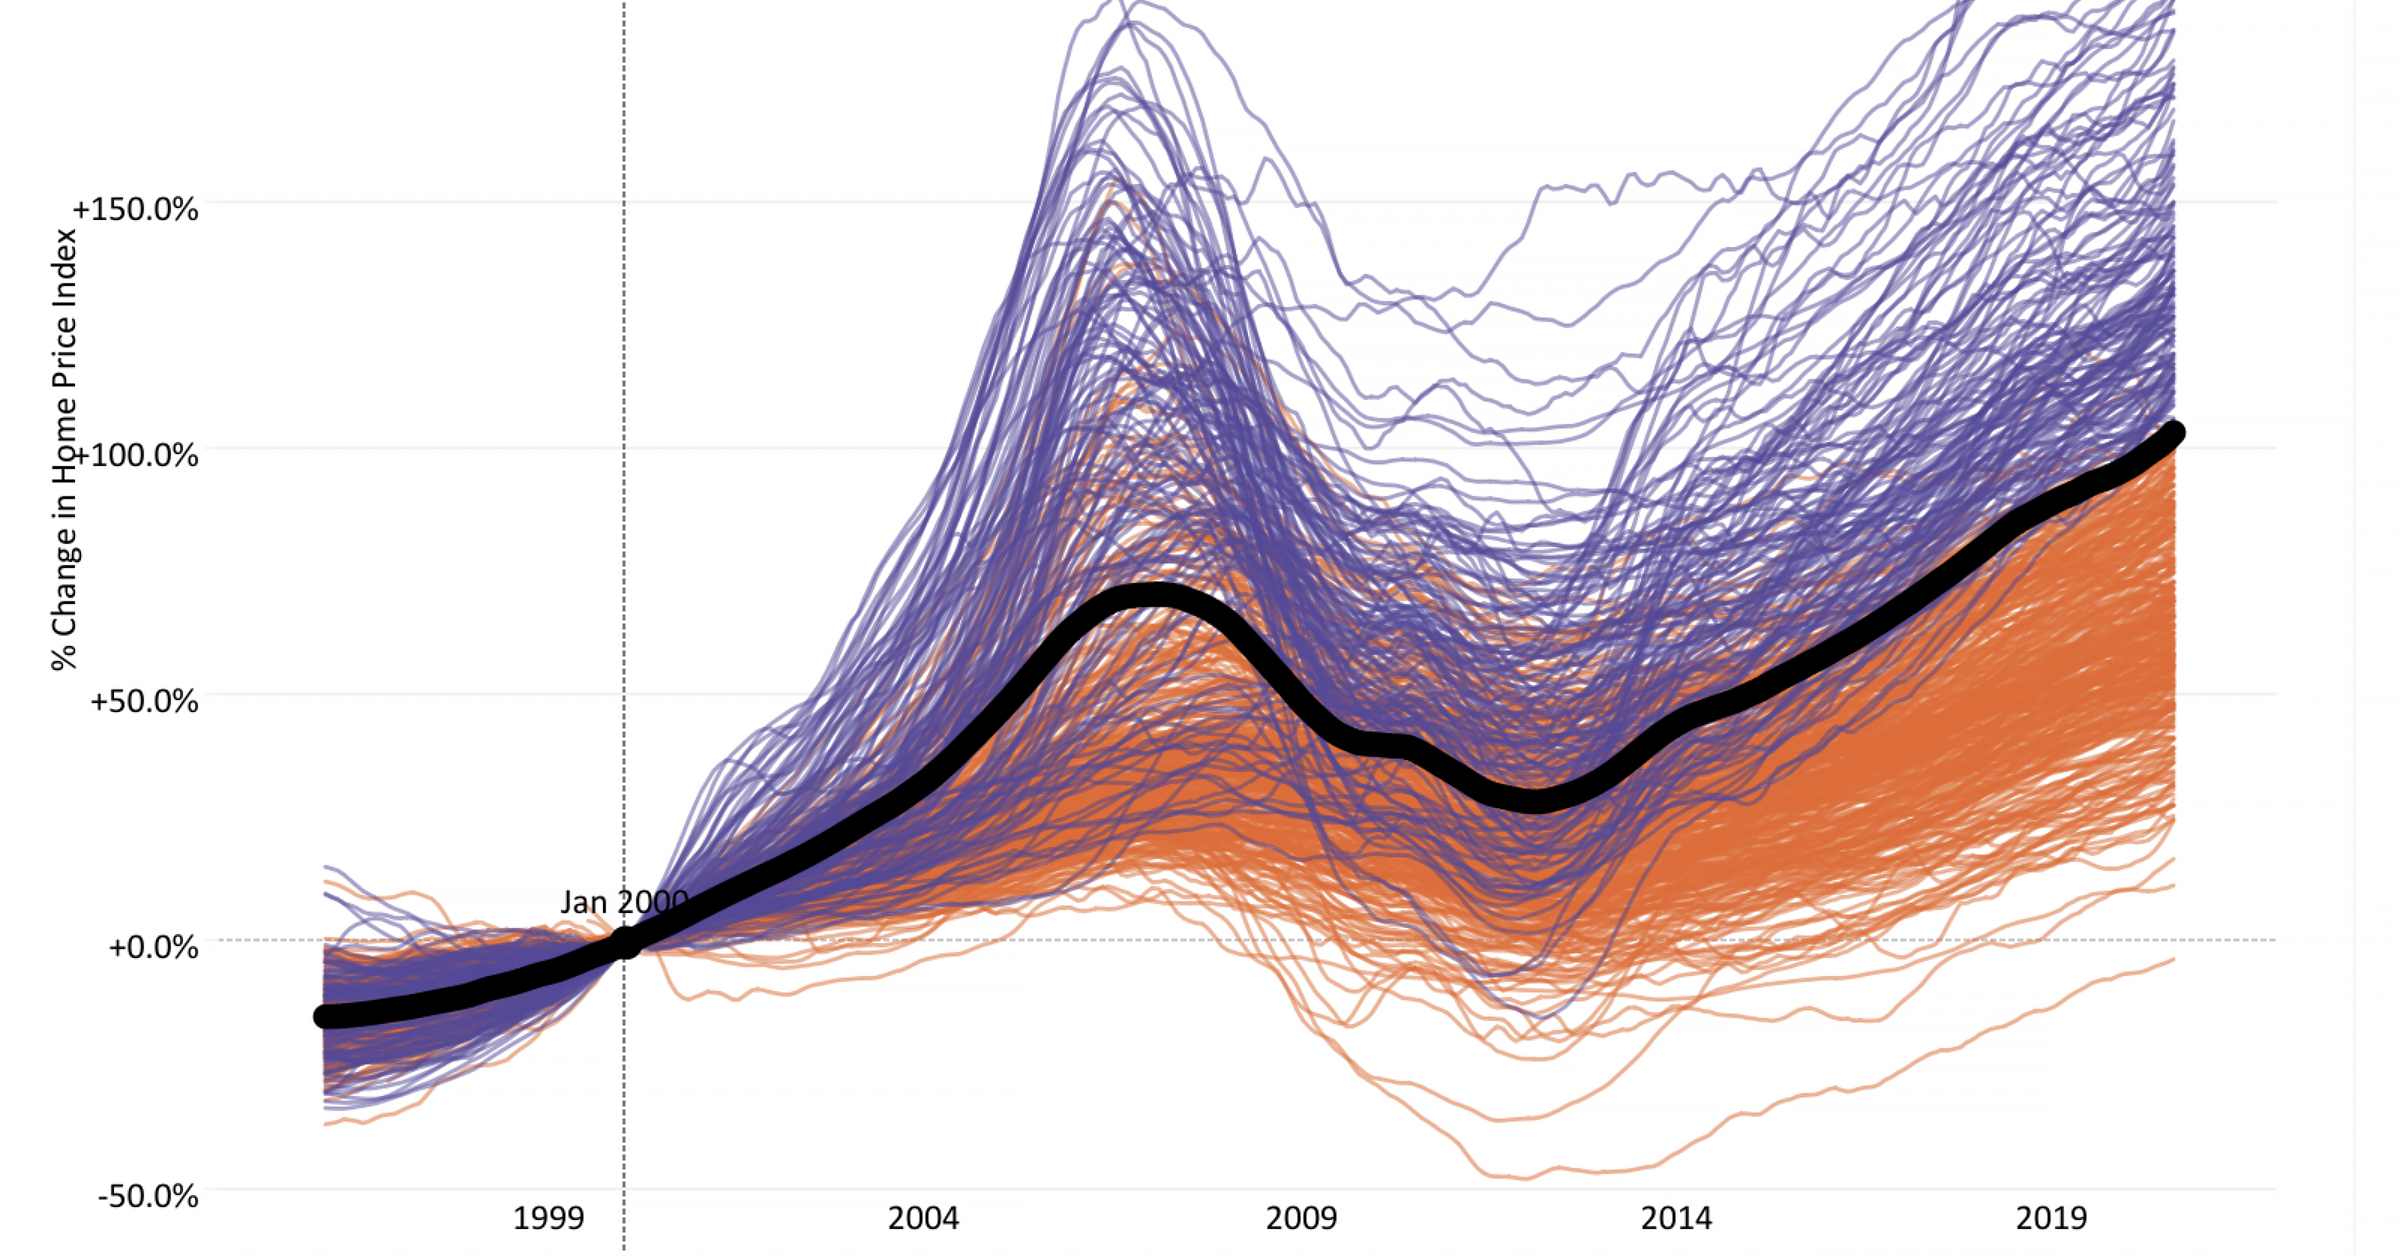
The Lay of the Land
A number of things become apparent when looking at historical data of hundreds of U.S. cities.
First, the trajectory of home prices is defined by the 2008 Financial Crisis. After prices took a steep dive, it took a full decade for the average home price to rise back up to the 2007 peak.
Next, broadly speaking, the U.S. average is being “pulled up” by the hottest regional markets. The majority of housing markets have seen between a 50% and 100% increase in price over the past 20 years. This is also true at the state level, where booming markets such as Hawaii saw price increases double the U.S. average.
Going West
The West Coast has seen dramatic home price appreciation in over the last two decades, a trend that permeated the entire region. Every single city tracked in this database beat the U.S. average.
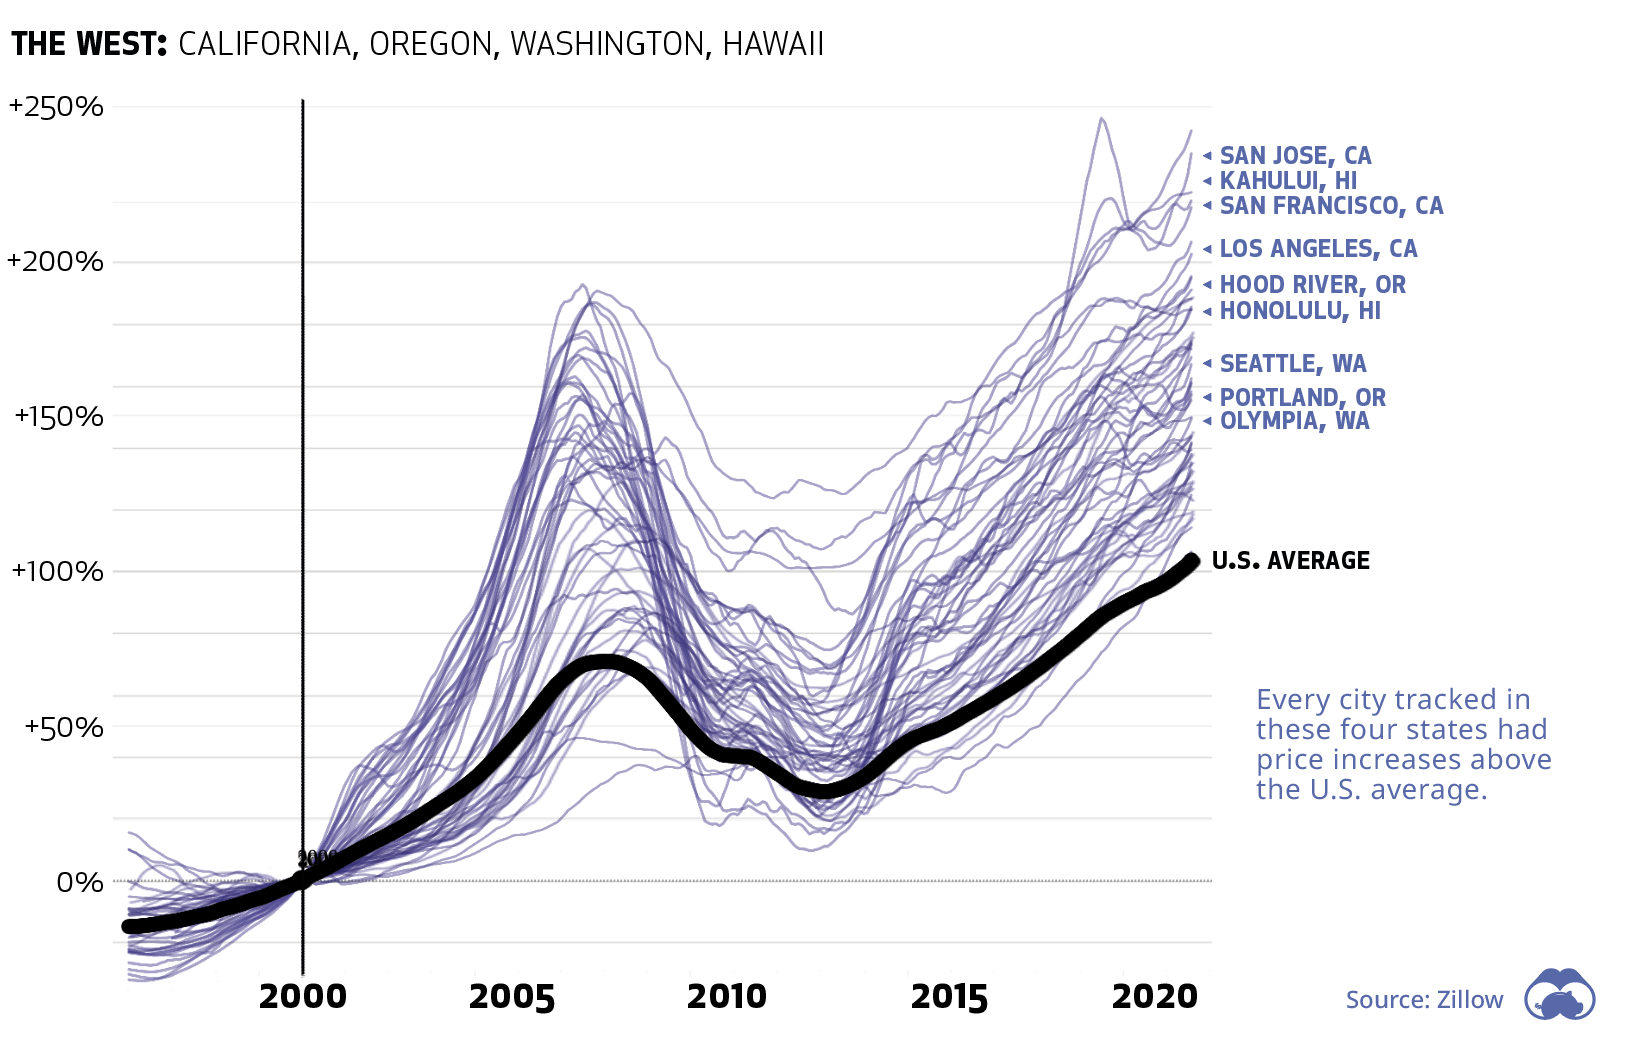
California and Hawaii saw the biggest gains, with a number of cities ending up with a 200%+ increase over prices in 2000.
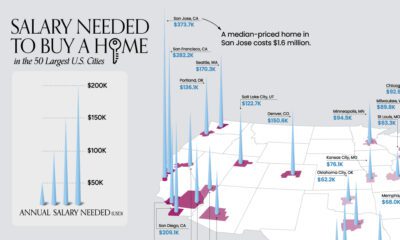
The biggest gains in the entire country over the time period was Madera, California, which is located just north of Fresno. The nearby cities of San Jose and San Francisco rose by an impressive 235% and 219%, respectively. As a practical example – during the meteoric rise of Silicon Valley, average prices in San Francisco shot up from $364,000 to $1.12 million.
Even the bottom city (Yakima, Washington) on the left coast saw an increase of 114%.
Slower Home Price Changes
In general, cities located in America’s “Rust Belt” states saw slower home price growth. In fact, every city in these five states saw price growth below the U.S. average.
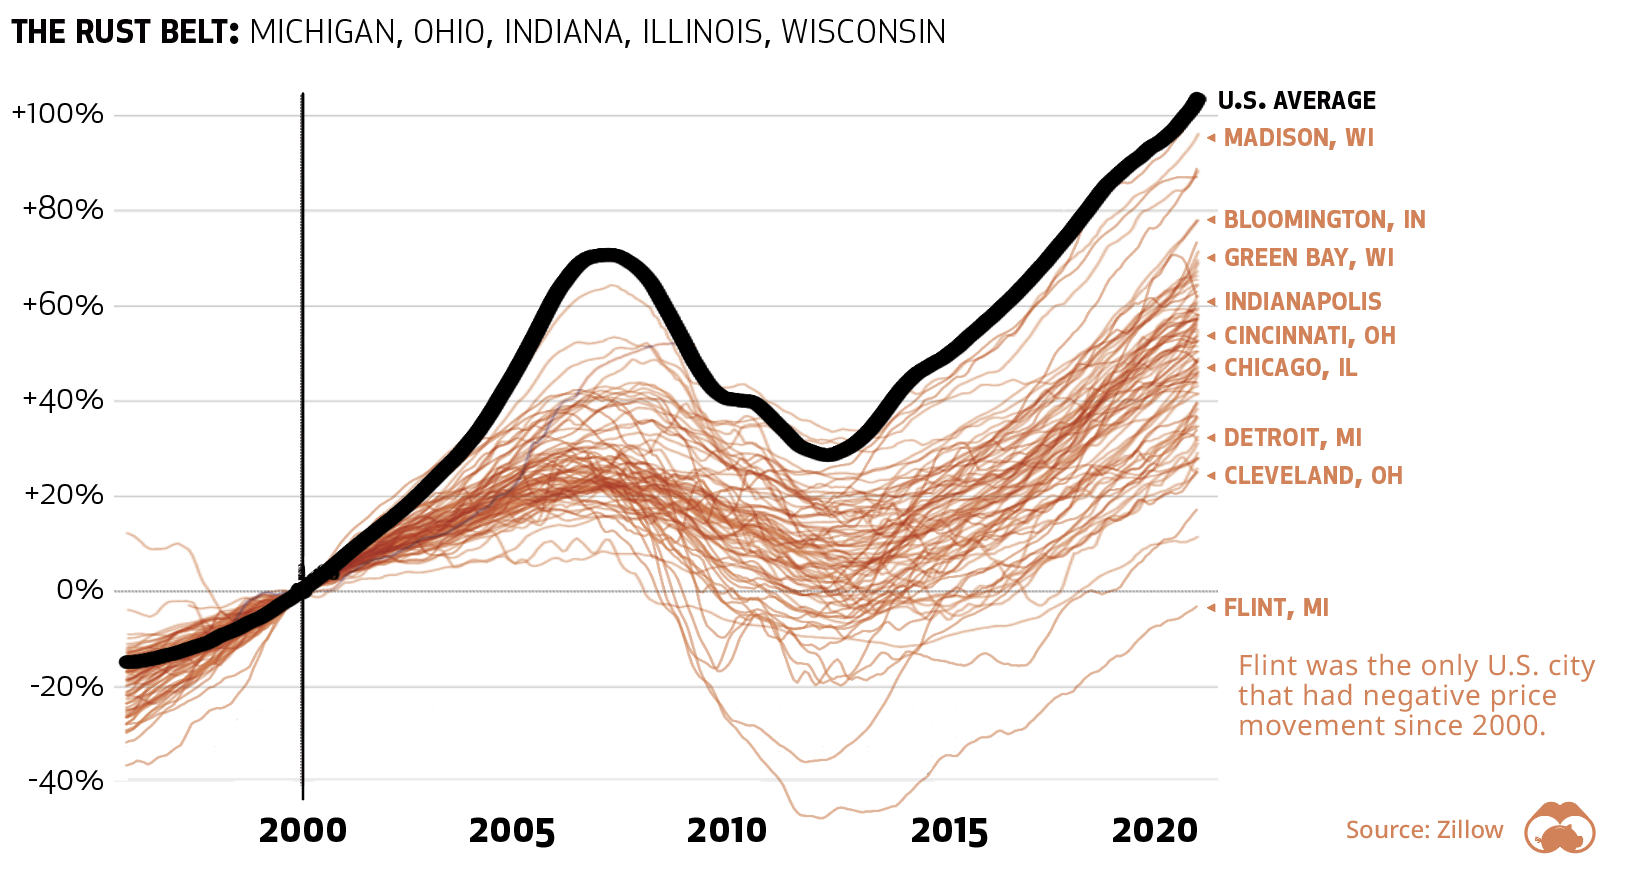
Of the top 20 U.S. metros, Detroit and Chicago saw the slowest price growth over the past two decades. Flint, Michigan, was the only city in the country to see a price decline.
At the state level, Illinois, Michigan, and Ohio were the bottom three in terms of home price appreciation.
A Useful Barometer
Looking at country or state level data fails to capture the incredible nuance of home values around the country.
That said, since the value of a primary residence makes a significant portion of wealth for most Americans, these price movements serve as a useful barometer of the health of the real estate market, and the economy as a whole.


Real Estate
Ranked: The Most Valuable Housing Markets in America
The U.S. residential real estate market is worth a staggering $47.5 trillion. Here are the most valuable housing markets in the country.
The Most Valuable Housing Markets in America
This was originally posted on our Voronoi app. Download the app for free on iOS or Android and discover incredible data-driven charts from a variety of trusted sources.
The residential real estate market in the U.S. stands as one of the largest asset classes in the country, worth $47.5 trillion in 2023.
Despite a slowdown in home sales, the total value of homes increased $2.4 trillion last year as low inventory levels pushed up prices. Affordable metropolitan areas saw steady price growth, while expensive metros experienced slower price appreciation.
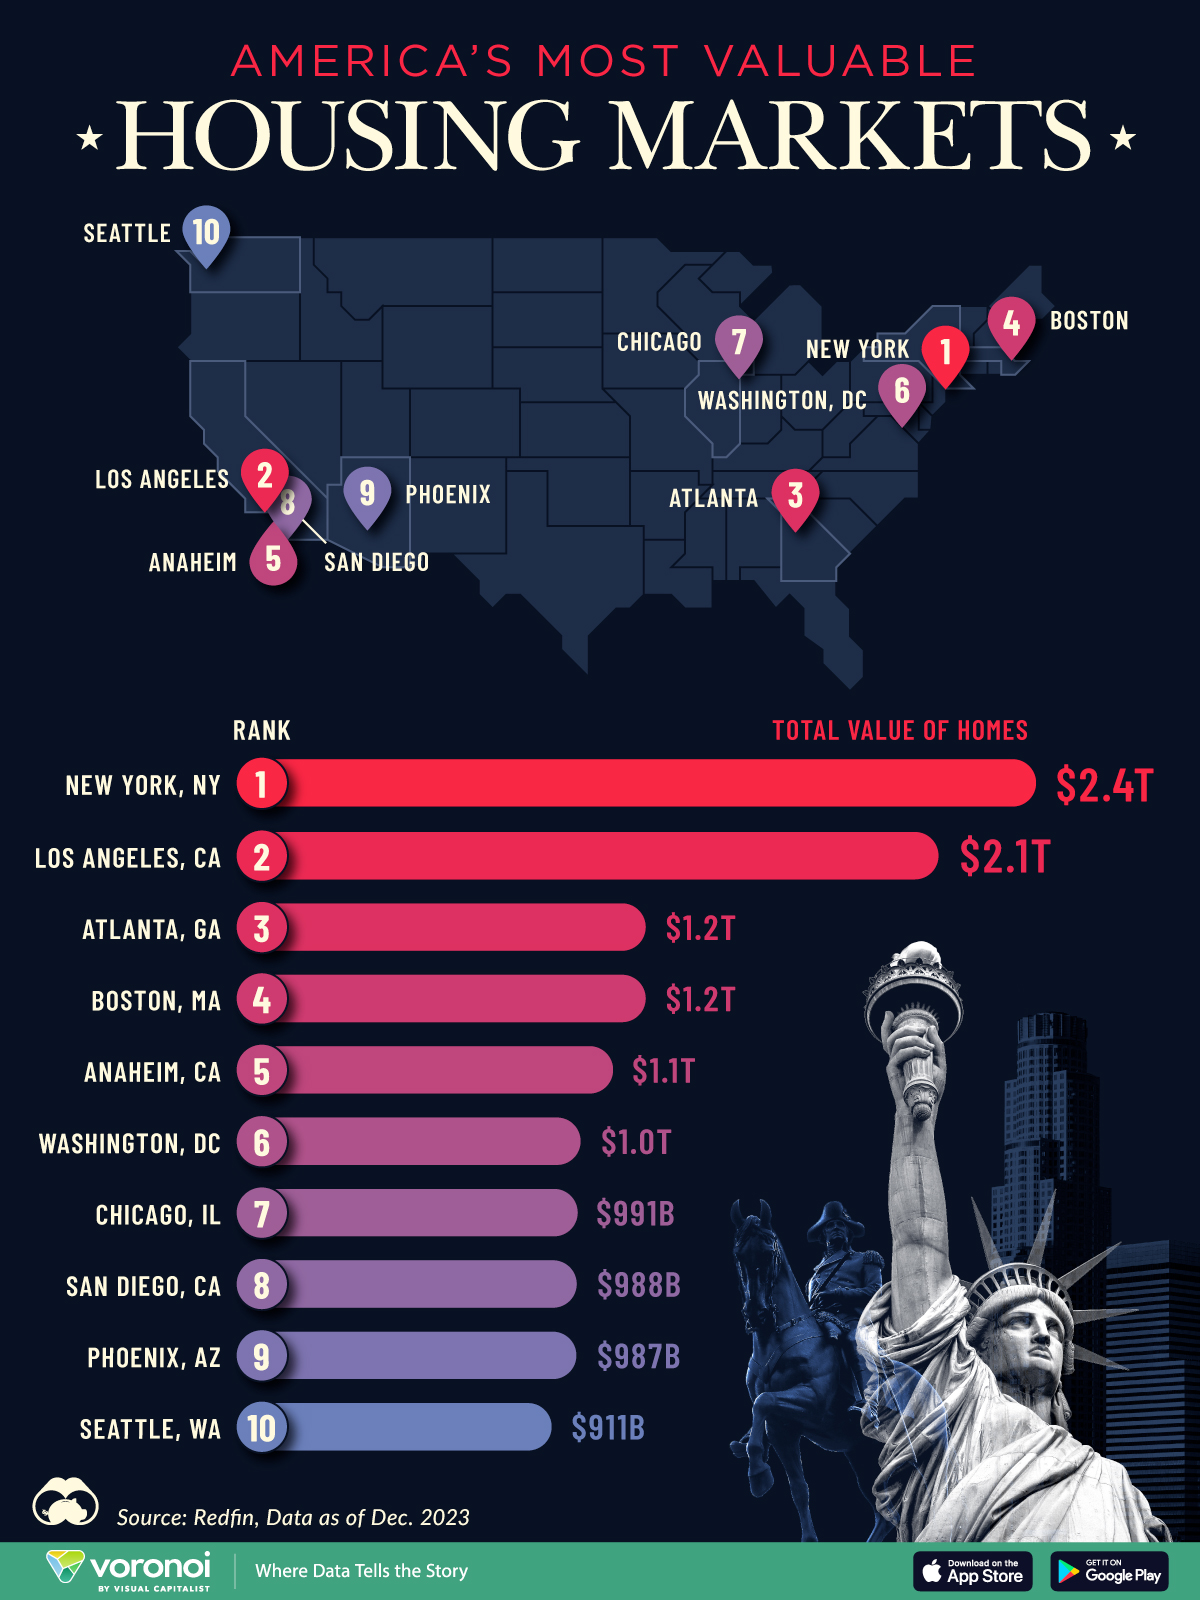
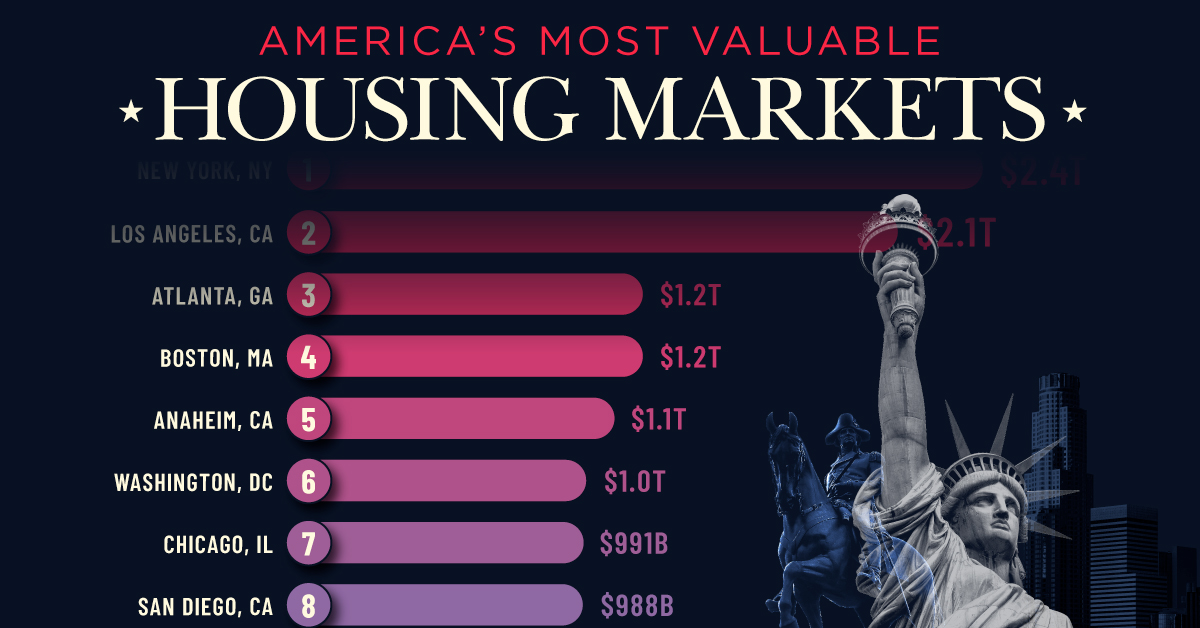
This graphic shows America’s most valuable housing markets, using data from Redfin.
Top U.S. Residential Real Estate Markets
To calculate the largest U.S. housing markets, Redfin analyzed 90 million properties covering single-family homes, townhouses, condos, and two-to four-unit multifamily properties.
Below, we show the most valuable residential markets as of December 2023:
| Rank | U.S. Metro | Total Value of Homes | Total Value of Homes YoY Change |
|---|---|---|---|
| 1 | New York, NY | $2.4T | -1.0% |
| 2 | Los Angeles, CA | $2.1T | +4.3% |
| 3 | Atlanta, GA | $1.2T | +6.2% |
| 4 | Boston, MA | $1.2T | +8.3% |
| 5 | Anaheim, CA | $1.1T | +8.0% |
| 6 | Washington, DC | $1.0T | +6.2% |
| 7 | Chicago, IL | $991B | +7.4% |
| 8 | San Diego, CA | $988B | +9.4% |
| 9 | Phoenix, AZ | $987B | +4.2% |
| 10 | Seattle, WA | $911B | +4.6% |
With a housing market worth $2.4 trillion, New York, NY tops the list.
Unlike the majority of large U.S. cities, the aggregate value of homes declined as buyers became increasingly priced out of the market. At the same time, homeowners hesitated to sell in order to lock in low mortgage rates. In fact, more than 80% of mortgage holders in New York City have interest rates that are 5% or lower.
Los Angeles, CA falls in second, with a residential real estate market worth $2.0 trillion. Last year, existing home sales tumbled 24.8%, falling to the lowest point since 2007. However, the housing shortage led prices to increase amid high demand. The median sale price climbed to $975,000 in February 2024, a 5.9% jump compared to the same time last year.
Atlanta, GA ranks third and is the most overpriced housing market in the country according to one countrywide analysis. Homes have been selling for 41.7% more than their worth as of the February 2024 data update.
People are flocking to the city for many reasons. General housing affordability is a major driver, along with its thriving tech center. Along with this, state tax credits have increasingly made it a hub for the TV and film industries, earning it the moniker “Y’allywood”. Another factor in Atlanta’s inflating housing market are large investment firms, which own a huge footprint of homes in the city.
Editor’s note: For those wondering about the Bay Area, the data groups cities like San Francisco ($657 billion), San Jose ($821 billion), and Oakland ($881 billion) as individual entities, which puts them outside the cutoff. See the Redfin data for the full list of cities.

-

 Debt1 week ago
How Debt-to-GDP Ratios Have Changed Since 2000
-

 Countries2 weeks ago
Population Projections: The World’s 6 Largest Countries in 2075
-

 Markets2 weeks ago
The Top 10 States by Real GDP Growth in 2023
-

 Demographics2 weeks ago
The Smallest Gender Wage Gaps in OECD Countries
-

 United States2 weeks ago
Where U.S. Inflation Hit the Hardest in March 2024
-

 Green2 weeks ago
Top Countries By Forest Growth Since 2001
-

 United States2 weeks ago
Ranked: The Largest U.S. Corporations by Number of Employees
-

 Maps2 weeks ago
The Largest Earthquakes in the New York Area (1970-2024)