Money
Ranked: The Most Affordable U.S. Cities for Home Buyers
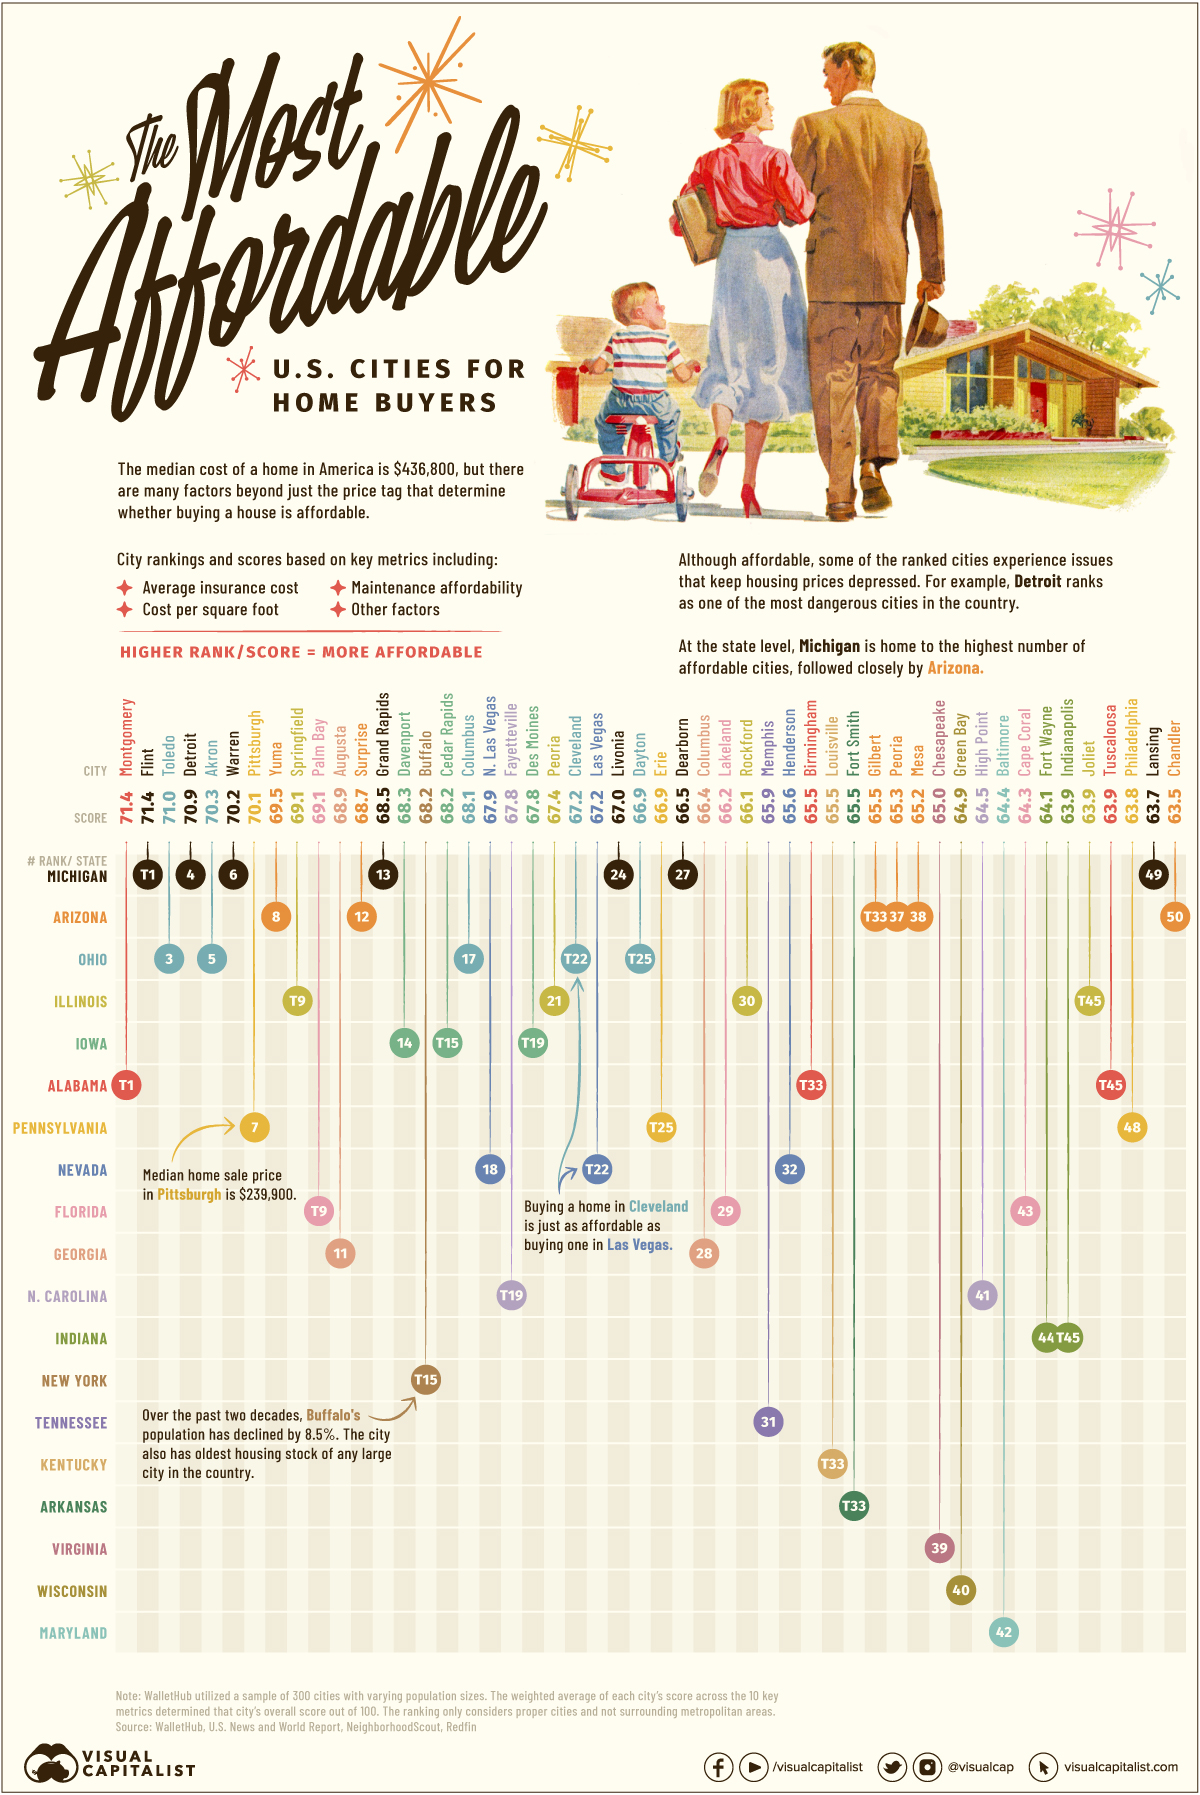


Ranked: The Most Affordable U.S. Cities for Home Buyers
Just before the pandemic, the average home price in the U.S. was $313,000—a figure that has since jumped by 40% to $436,800 today. As home prices and mortgage rates increase, home ownership is becoming an unrealistic dream for some.
In the cities ranked above, however, buying a house is a much more attainable goal.
By looking at factors like the real estate tax rate, median home price appreciation, and cost of living, this study from WalletHub assesses the most affordable cities in the U.S. for home buyers. The scores in the ranking are out of 100 and the higher a score, the more affordable that city is for home buyers.
The Methodology
This ranking considers much more than just the price tag on a house when it comes to affordability. Using 10 metrics, which cover an array of important considerations for home buyers, the overall affordability score is measured for each city.
Here’s a closer look at the 10 categories and how each one was weighted and measured:
| Metric | Weight |
|---|---|
| Housing Affordability | 25.00 points |
| Cost per Square Foot | 16.67 points |
| Maintenance Affordability | 8.33 points |
| Average Cost of Homeowner's Insurance | 8.33 points |
| Cost of Living | 8.33 points |
| Real Estate Tax Rate | 8.33 points |
| Rent-to-Price-Ratio | 8.33 points |
| Median Home Price Appreciation | 8.33 points |
| Quarterly Active Listings per Capita | 4.17 points |
| Vacancy Rate | 4.17 points |
The highest-weighted metric is the median price of the home itself divided by the median household income in that area, or house affordability.
Other important metrics assessed include the availability of homes for sale, the average cost of homeowner’s insurance, maintenance costs, and many other vital things people must consider when purchasing a home.
Which U.S. Cities are the Most Affordable for Home Buyers?
Here’s a closer look at the 50 most affordable cities for home buyers in the U.S.:
| Rank | City | Score |
|---|---|---|
| T1 | Montgomery, AL | 71.4 |
| T1 | Flint, MI | 71.4 |
| 3 | Toledo, OH | 71.0 |
| 4 | Detroit, MI | 70.9 |
| 5 | Akron, OH | 70.3 |
| 6 | Warren, MI | 70.2 |
| 7 | Pittsburgh, PA | 70.1 |
| 8 | Yuma, AZ | 69.5 |
| T9 | Springfield, Il | 69.1 |
| T9 | Palm Bay, FL | 69.1 |
| 11 | Augusta, GA | 68.9 |
| 12 | Surpise, AZ | 68.7 |
| 13 | Grand Rapids, MI | 68.5 |
| 14 | Davenport, IA | 68.3 |
| T15 | Buffalo, NY | 68.2 |
| T15 | Cedar Rapids, IA | 68.2 |
| 17 | Columbus, OH | 68.1 |
| 18 | North Las Vegas, NV | 67.9 |
| T19 | Fayetteville, NC | 67.8 |
| T19 | Des Moines, IA | 67.8 |
| 21 | Peoria, IL | 67.4 |
| T22 | Cleveland, OH | 67.2 |
| T22 | Las Vegas, NV | 67.2 |
| 24 | Livonia, MI | 67.0 |
| T25 | Dayton, OH | 66.9 |
| T25 | Erie, PA | 66.9 |
| 27 | Dearborn, MI | 66.5 |
| 28 | Columbus, GA | 66.4 |
| 29 | Lakeland, FL | 66.2 |
| 30 | Rockford, IL | 66.1 |
| 31 | Memphis, TN | 65.9 |
| 32 | Henderson, NV | 65.6 |
| T33 | Birmingham, AL | 65.5 |
| T33 | Louisville, KY | 65.5 |
| T33 | Fort Smith, AR | 65.5 |
| T33 | Gilbert, AZ | 65.5 |
| 37 | Peoria, AZ | 65.3 |
| 38 | Mesa, AZ | 65.2 |
| 39 | Chesapeake, VA | 65.0 |
| 40 | Green Bay, WI | 64.9 |
| 41 | High Point, NC | 64.5 |
| 42 | Baltimore, MD | 64.4 |
| 43 | Cape Coral, FL | 64.3 |
| 44 | Fort Wayne, IN | 64.1 |
| T45 | Indianapolis, IN | 63.9 |
| T45 | Joliet, IL | 63.9 |
| T45 | Tuscaloosa, AL | 63.9 |
| 48 | Philadelphia, PA | 63.8 |
| 49 | Lansing, MI | 63.7 |
| 50 | Chandler, AZ | 63.5 |
When it comes to the individual metrics, here’s a look at some cities which had the best scores in a few of the unique categories:
- #1 in Housing Affordability: Springfield, IL
- #1 in Maintenance Affordability: Sunnyvale, CA
- #1 in Rent-to-Price Ratio: Flint, MI
- #1 in Vacancy Rate: Miami Beach, FL
Location, Location, Location
Narrowing down which locations are feasible from a lifestyle and financial standpoint is a critical first step in the home-buying journey. Popular suburban communities and iconic hubs like Los Angeles or NYC hold great appeal, but these places command a higher price point or have housing stock that is incompatible with lifestyle needs.
On the flip side, some of the most affordable cities may have issues that negatively affect desirability. Flint, Michigan (#1), for example, is still widely perceived to have issues with its drinking water. Other places are high in crime or have a narrow range of economic opportunities, like Detroit (#4) or Yuma, Arizona (#9), respectively.
Many of the cities in the ranking are concentrated in Michigan, Arizona, and Ohio. In terms of big cities that are actually affordable, Pittsburgh, Columbus, Philadelphia, and Baltimore are examples of well-known spots to make the list.
There are also a number of ties in the ranking, with makes for interesting juxtapositions. For instance, Las Vegas is just as affordable as Cleveland, Ohio (#22). Here’s a look at some other cities that are equally affordable for home buyers:
- Montgomery, Alabama and Flint, Michigan (#1)
- Springfield, Illinois and Palm Bay, Florida (#9)
- Buffalo, New York and Cedar Rapids, Iowa (#15)
- Fayetteville, North Carolina and Des Moines, Iowa (#19)
- Dayton, Ohio and Erie, Pennsylvania (#25)
- Birmingham, Alabama; Louisville, Kentucky; Fort Smith, Arkansas; and Gilbert, Arizona (#33)
- Indianapolis, Indiana; Joliet, Illinois; and Tuscaloosa, Alabama (#45)
Overall, the home ownership rate in the U.S.—the share of homes that are occupied by their owners—is currently 66%, according to FRED data. While the trend shows a general recovery from the steep drop off that occurred during the pandemic, there is a while to go before the U.S. reaches pre-2020 figures. Perhaps, these affordable towns could offer a solution.
Where Does This Data Come From?
Source: WalletHub using data from the U.S. Census Bureau, The National Association of Realtors, Council for Community and Economic Research and Insurance Information Institute.
Data notes: To determine the most affordable cities for home buyers, WalletHub compared a sample of 300 U.S. cities (varying in size) across ten key metrics, which are listed below with their corresponding weights. Each metric was graded on a 100-point scale, with a score of 100 representing the most favorable conditions for home affordability. The ranking only considers proper cities and not surrounding metropolitan areas. Visit the source for further details.


Money
Charted: Which City Has the Most Billionaires in 2024?
Just two countries account for half of the top 20 cities with the most billionaires. And the majority of the other half are found in Asia.


Charted: Which Country Has the Most Billionaires in 2024?
This was originally posted on our Voronoi app. Download the app for free on iOS or Android and discover incredible data-driven charts from a variety of trusted sources.
Some cities seem to attract the rich. Take New York City for example, which has 340,000 high-net-worth residents with investable assets of more than $1 million.
But there’s a vast difference between being a millionaire and a billionaire. So where do the richest of them all live?
Using data from the Hurun Global Rich List 2024, we rank the top 20 cities with the highest number of billionaires in 2024.
A caveat to these rich lists: sources often vary on figures and exact rankings. For example, in last year’s reports, Forbes had New York as the city with the most billionaires, while the Hurun Global Rich List placed Beijing at the top spot.
Ranked: Top 20 Cities with the Most Billionaires in 2024
The Chinese economy’s doldrums over the course of the past year have affected its ultra-wealthy residents in key cities.
Beijing, the city with the most billionaires in 2023, has not only ceded its spot to New York, but has dropped to #4, overtaken by London and Mumbai.
| Rank | City | Billionaires | Rank Change YoY |
|---|---|---|---|
| 1 | 🇺🇸 New York | 119 | +1 |
| 2 | 🇬🇧 London | 97 | +3 |
| 3 | 🇮🇳 Mumbai | 92 | +4 |
| 4 | 🇨🇳 Beijing | 91 | -3 |
| 5 | 🇨🇳 Shanghai | 87 | -2 |
| 6 | 🇨🇳 Shenzhen | 84 | -2 |
| 7 | 🇭🇰 Hong Kong | 65 | -1 |
| 8 | 🇷🇺 Moscow | 59 | No Change |
| 9 | 🇮🇳 New Delhi | 57 | +6 |
| 10 | 🇺🇸 San Francisco | 52 | No Change |
| 11 | 🇹🇭 Bangkok | 49 | +2 |
| 12 | 🇹🇼 Taipei | 45 | +2 |
| 13 | 🇫🇷 Paris | 44 | -2 |
| 14 | 🇨🇳 Hangzhou | 43 | -5 |
| 15 | 🇸🇬 Singapore | 42 | New to Top 20 |
| 16 | 🇨🇳 Guangzhou | 39 | -4 |
| 17T | 🇮🇩 Jakarta | 37 | +1 |
| 17T | 🇧🇷 Sao Paulo | 37 | No Change |
| 19T | 🇺🇸 Los Angeles | 31 | No Change |
| 19T | 🇰🇷 Seoul | 31 | -3 |
In fact all Chinese cities on the top 20 list have lost billionaires between 2023–24. Consequently, they’ve all lost ranking spots as well, with Hangzhou seeing the biggest slide (-5) in the top 20.
Where China lost, all other Asian cities—except Seoul—in the top 20 have gained ranks. Indian cities lead the way, with New Delhi (+6) and Mumbai (+3) having climbed the most.
At a country level, China and the U.S combine to make up half of the cities in the top 20. They are also home to about half of the world’s 3,200 billionaire population.
In other news of note: Hurun officially counts Taylor Swift as a billionaire, estimating her net worth at $1.2 billion.

-

 Science1 week ago
Visualizing the Average Lifespans of Mammals
-

 Markets2 weeks ago
The Top 10 States by Real GDP Growth in 2023
-

 Demographics2 weeks ago
The Smallest Gender Wage Gaps in OECD Countries
-

 United States2 weeks ago
Where U.S. Inflation Hit the Hardest in March 2024
-

 Green2 weeks ago
Top Countries By Forest Growth Since 2001
-

 United States2 weeks ago
Ranked: The Largest U.S. Corporations by Number of Employees
-

 Maps2 weeks ago
The Largest Earthquakes in the New York Area (1970-2024)
-

 Green2 weeks ago
Ranked: The Countries With the Most Air Pollution in 2023