Personal Finance
Mapped: What You Need to Earn to Own a Home in 50 American Cities
Click to view this graphic in a higher-resolution.
What You Need to Earn to Own a Home in 50 American Cities
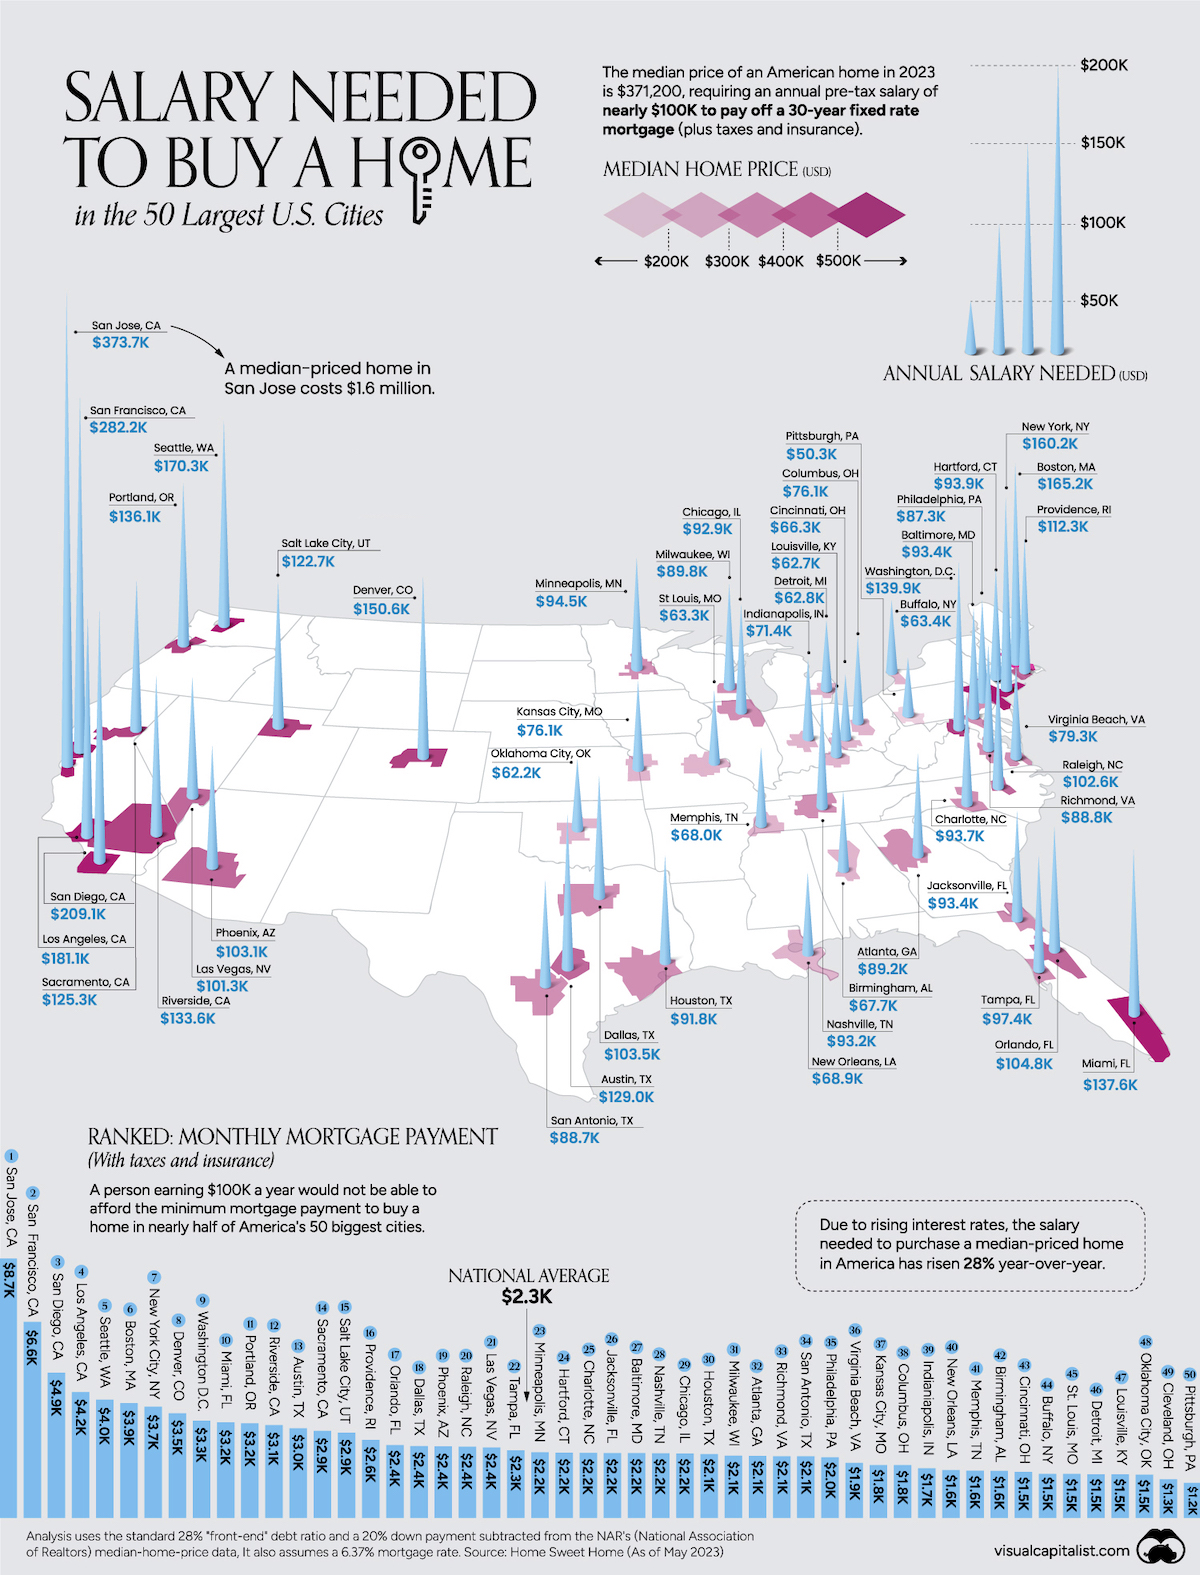
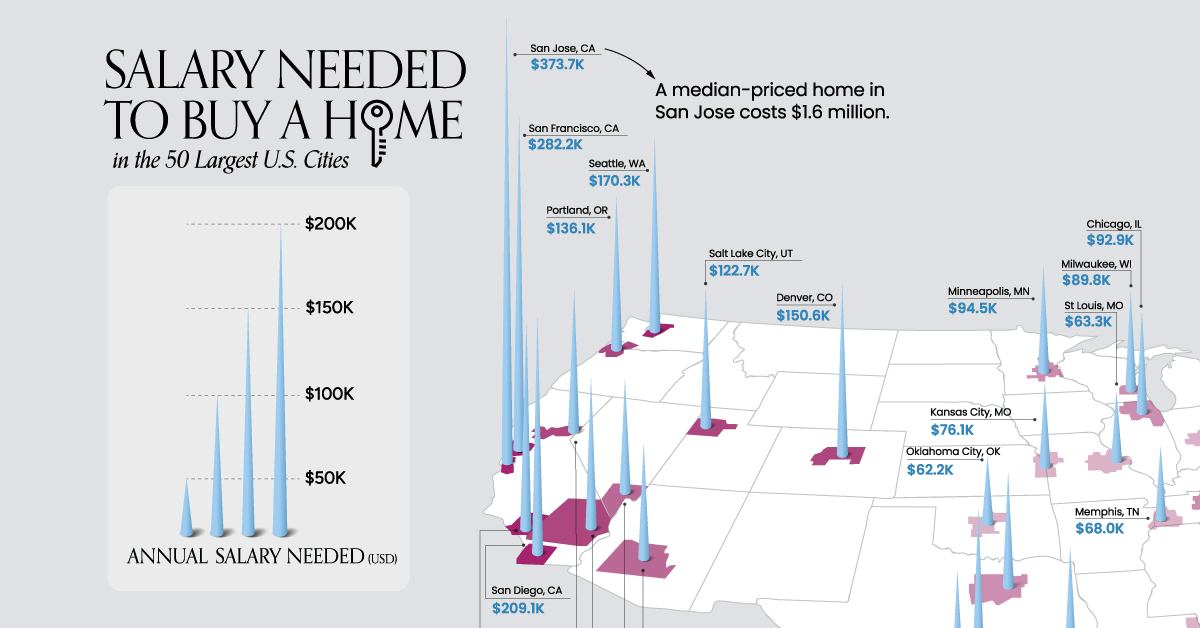
Once a fundamental part of the American dream, the ability to own a home is drifting farther and farther away for many Americans.
Between skyrocketing prices, stagnating wages, and now rising interest rates, the deck seems to be increasingly stacked against home ownership.
Using May 2023 data tabulated by Home Sweet Home, we map out the annual salary needed to afford a 30-year mortgage (at 6.37%) to buy a home in America’s 50 most populous metropolitan areas.
The monthly minimum mortgage payment includes taxes and insurance as well, and is capped at roughly one-third of the income. This analysis also assumes that the homeowner will put down a 20% down payment.
The Least and Most Affordable American Cities to Own a Home
At the top of the list, and at the very west of the country, San Jose is the least affordable city to own a home for the average American.
One would have to earn at least $374,000 a year to afford a $1.6 million dollar home in the city.
To put those numbers into perspective, the median American annual income is $75,000, about one-fifth what’s required to buy a home in San Jose.
Here’s a look at the annual earnings needed to afford a home in all 50 largest cities in the U.S., ranked from least to most affordable.
| Rank | Metro Area | State | Median Home Price | Annual Salary |
|---|---|---|---|---|
| 1 | San Jose | California | $1,618,400 | $373,696 |
| 2 | San Francisco | California | $1,192,600 | $282,167 |
| 3 | San Diego | California | $880,000 | $209,110 |
| 4 | Los Angeles | California | $746,800 | $181,106 |
| 5 | Seattle | Washington | $699,300 | $170,340 |
| 6 | Boston | Massachusetts | $644,400 | $165,239 |
| 7 | New York City | New York | $577,300 | $160,233 |
| 8 | Denver | Colorado | $636,100 | $150,622 |
| 9 | Washington, D.C. | N/A | $557,200 | $139,911 |
| 10 | Miami | Florida | $560,000 | $137,574 |
| 11 | Portland | Oregon | $556,800 | $136,147 |
| 12 | Riverside/San Bernardino | California | $550,000 | $133,607 |
| 13 | Austin | Texas | $467,900 | $128,995 |
| 14 | Sacramento | California | $500,000 | $125,304 |
| 15 | Salt Lake City | Utah | $522,700 | $122,717 |
| 16 | Providence | Rhode Island | $417,000 | $112,281 |
| 17 | Orlando | Florida | $419,900 | $104,772 |
| 18 | Dallas | Texas | $372,400 | $103,460 |
| 19 | Phoenix | Arizona | $439,700 | $103,112 |
| 20 | Raleigh | North Carolina | $420,000 | $102,572 |
| 21 | Las Vegas | Nevada | $431,400 | $101,310 |
| 22 | Tampa | Florida | $390,000 | $97,387 |
| 23 | Minneapolis | Michigan | $361,500 | $94,466 |
| 24 | Hartford | Connecticut | $314,900 | $93,861 |
| 25 | Charlotte | North Carolina | $387,200 | $93,735 |
| 26 | Jacksonville | Florida | $370,000 | $93,422 |
| 27 | Baltimore | Maryland | $357,800 | $93,378 |
| 28 | Nashville | Tennessee | $385,800 | $93,168 |
| 29 | Chicago | Illinois | $321,000 | $92,868 |
| 30 | Houston | Texas | $327,000 | $91,826 |
| 31 | Milwaukee | Wisconsin | $339,600 | $89,752 |
| 32 | Atlanta | Georgia | $354,300 | $89,198 |
| 33 | Richmond | Virginia | $362,300 | $88,769 |
| 34 | San Antonio | Texas | $320,500 | $88,683 |
| 35 | Philadelphia | Pennsylvania | $315,300 | $87,293 |
| 36 | Virginia Beach | Virginia | $313,200 | $79,336 |
| 37 | Kansas City | Missouri | $291,000 | $76,147 |
| 38 | Columbus | Ohio | $284,700 | $76,133 |
| 39 | Indianapolis | Indiana | $289,300 | $71,409 |
| 40 | New Orleans | Louisiana | $265,200 | $68,946 |
| 41 | Memphis | Tennessee | $268,600 | $68,005 |
| 42 | Birmingham | Alabama | $276,500 | $67,773 |
| 43 | Cincinnati | Ohio | $252,200 | $66,260 |
| 44 | Buffalo | New York | $206,800 | $63,386 |
| 45 | St Louis | Missouri | $231,100 | $63,260 |
| 46 | Detroit | Michigan | $227,000 | $62,758 |
| 47 | Louisville | Kentucky | $246,000 | $62,741 |
| 48 | Oklahoma City | Oklahoma | $227,300 | $62,161 |
| 49 | Cleveland | Ohio | $191,400 | $55,515 |
| 50 | Pittsburgh | Pennsylvania | $175,000 | $50,316 |
| National | $371,200 | $97,204 |
Other Californian cities, San Francisco (ranked 2nd), San Diego (3rd), and Los Angeles (4th) all require an annual income of at least $180,000 to attempt home ownership within their metropolitan boundaries.
Boston (ranked 6th) and New York (ranked 7th) represent unaffordability on the East Coast, both requiring at least $160,000 a year to buy homes there.
It’s not just the coasts that are expensive however. To buy a home in Denver (ranked 8th) and Salt Lake City (15th) means earning more than $120,000 a year.
However, cities in the Midwest and South, like Pittsburgh, Detroit, Oklahoma City, and Louisville, are far more affordable, requiring less than $63,000 a year to buy a home.
Interest Rates Rock Home Ownership Chances
Aside from the obvious price differences in housing markets, a key factor that has elevated income requirements across the board is the rapid rise in interest rates in the last year. In fact the average 30-year mortgage has pushed past 7%, the highest it’s been since the 2000s.
This means that while the median price of a house in San Jose has actually come down between 2022 and 2023, the minimum monthly payment has increased from $7,717 to $8,720 this year.
| Rank | Metro Area | State | Median Home Price | Monthly Payment |
|---|---|---|---|---|
| 1 | San Jose | California | $1,618,400 | $8,720 |
| 2 | San Francisco | California | $1,192,600 | $6,584 |
| 3 | San Diego | California | $880,000 | $4,879 |
| 4 | Los Angeles | California | $746,800 | $4,226 |
| 5 | Seattle | Washington | $699,300 | $3,975 |
| 6 | Boston | Massachusetts | $644,400 | $3,856 |
| 7 | New York City | New York | $577,300 | $3,739 |
| 8 | Denver | Colorado | $636,100 | $3,515 |
| 9 | Washington, D.C. | N/A | $557,200 | $3,265 |
| 10 | Miami | Florida | $560,000 | $3,210 |
| 11 | Portland | Oregon | $556,800 | $3,177 |
| 12 | Riverside/San Bernardino | California | $550,000 | $3,118 |
| 13 | Austin | Texas | $467,900 | $3,010 |
| 14 | Sacramento | California | $500,000 | $2,924 |
| 15 | Salt Lake City | Utah | $522,700 | $2,863 |
| 16 | Providence | Rhode Island | $417,000 | $2,620 |
| 17 | Orlando | Florida | $419,900 | $2,445 |
| 18 | Dallas | Texas | $372,400 | $2,414 |
| 19 | Phoenix | Arizona | $439,700 | $2,406 |
| 20 | Raleigh | North Carolina | $420,000 | $2,393 |
| 21 | Las Vegas | Nevada | $431,400 | $2,364 |
| 22 | Tampa | Florida | $390,000 | $2,272 |
| 23 | Minneapolis | Michigan | $361,500 | $2,204 |
| 24 | Hartford | Connecticut | $314,900 | $2,190 |
| 25 | Charlotte | North Carolina | $387,200 | $2,187 |
| 26 | Jacksonville | Florida | $370,000 | $2,180 |
| 27 | Baltimore | Maryland | $357,800 | $2,179 |
| 28 | Nashville | Tennessee | $385,800 | $2,174 |
| 29 | Chicago | Illinois | $321,000 | $2,167 |
| 30 | Houston | Texas | $327,000 | $2,143 |
| 31 | Milwaukee | Wisconsin | $339,600 | $2,094 |
| 32 | Atlanta | Georgia | $354,300 | $2,081 |
| 33 | Richmond | Virginia | $362,300 | $2,071 |
| 34 | San Antonio | Texas | $320,500 | $2,069 |
| 35 | Philadelphia | Pennsylvania | $315,300 | $2,037 |
| 36 | Virginia Beach | Virginia | $313,200 | $1,851 |
| 37 | Kansas City | Missouri | $291,000 | $1,777 |
| 38 | Columbus | Ohio | $284,700 | $1,776 |
| 39 | Indianapolis | Indiana | $289,300 | $1,666 |
| 40 | New Orleans | Louisiana | $265,200 | $1,609 |
| 41 | Memphis | Tennessee | $268,600 | $1,587 |
| 42 | Birmingham | Alabama | $276,500 | $1,581 |
| 43 | Cincinnati | Ohio | $252,200 | $1,546 |
| 44 | Buffalo | New York | $206,800 | $1,479 |
| 45 | St Louis | Missouri | $231,100 | $1,476 |
| 46 | Detroit | Michigan | $227,000 | $1,464 |
| 47 | Louisville | Kentucky | $246,000 | $1,464 |
| 48 | Oklahoma City | Oklahoma | $227,300 | $1,450 |
| 49 | Cleveland | Ohio | $191,400 | $1,295 |
| 50 | Pittsburgh | Pennsylvania | $175,000 | $1,174 |
| National | $371,200 | $2,268 |
So to afford a median-priced home in the country, an American needs to earn closer to $100,000 a year, up from $75,500 in 2022. And even then, they would be priced out of owning a home in nearly half of the 50 largest cities in the country.
As a result Americans may yet further delay home ownership. Renting is now a far more attractive option, thanks to the biggest difference between rent and mortgages in over 50 years.
Where Does This Data Come From?
Source: Home Sweet Home (HSH).
Note: HSH used different sources for their median home prices, mortgage rate, property taxes and home insurance figures for their analysis. Please visit their website for more information.
Other: If other personal debts exceed 8% of one’s given monthly gross income, this may increase the salary needed to qualify for a mortgage.


Personal Finance
Chart: The Declining Value of the U.S. Federal Minimum Wage
This graphic compares the nominal vs. inflation-adjusted value of the U.S. minimum wage, from 1940 to 2023.


The Declining Value of the U.S. Federal Minimum Wage
This was originally posted on our Voronoi app. Download the app for free on iOS or Android and discover incredible data-driven charts from a variety of trusted sources.
This graphic illustrates the history of the U.S. federal minimum wage using data compiled by Statista, in both nominal and real (inflation-adjusted) terms. The federal minimum wage was raised to $7.25 per hour in July 2009, where it has remained ever since.
Nominal vs. Real Value
The data we used to create this graphic can be found in the table below.
| Year | Nominal value ($/hour) | Real value ($/hour) |
|---|---|---|
| 1940 | 0.3 | 6.5 |
| 1945 | 0.4 | 6.82 |
| 1950 | 0.75 | 9.64 |
| 1955 | 0.75 | 8.52 |
| 1960 | 1 | 10.28 |
| 1965 | 1.25 | 12.08 |
| 1970 | 1.6 | 12.61 |
| 1975 | 2.1 | 12.04 |
| 1980 | 3.1 | 11.61 |
| 1985 | 3.35 | 9.51 |
| 1990 | 3.8 | 8.94 |
| 1995 | 4.25 | 8.49 |
| 2000 | 5.15 | 9.12 |
| 2005 | 5.15 | 8.03 |
| 2010 | 7.25 | 10.09 |
| 2015 | 7.25 | 9.3 |
| 2018 | 7.25 | 8.78 |
| 2019 | 7.25 | 8.61 |
| 2020 | 7.25 | 8.58 |
| 2021 | 7.25 | 8.24 |
| 2022 | 7.25 | 7.61 |
| 2023 | 7.25 | 7.25 |
What our graphic shows is how inflation has eroded the real value of the U.S. minimum wage over time, despite nominal increases.
For instance, consider the year 1960, when the federal minimum wage was $1 per hour. After accounting for inflation, this would be worth around $10.28 today!
The two lines converge at 2023 because the nominal and real value are identical in present day terms.
Many States Have Their Own Minimum Wage
According to the National Conference of State Legislatures (NCSL), 30 states and Washington, D.C. have implemented a minimum wage that is higher than $7.25.
The following states have adopted the federal minimum: Georgia, Idaho, Indiana, Iowa, Kansas, Kentucky, New Hampshire, North Carolina, North Dakota, Oklahoma, Pennsylvania, Texas, Utah, Wisconsin, and Wyoming.
Meanwhile, the states of Alabama, Louisiana, Mississippi, South Carolina, and Tennessee have no wage minimums, but have to follow the federal minimum.
How Does the U.S. Minimum Wage Rank Globally?
If you found this topic interesting, check out Mapped: Minimum Wage Around the World to see which countries have the highest minimum wage in monthly terms, as of January 2023.

-

 Education1 week ago
How Hard Is It to Get Into an Ivy League School?
-

 Technology2 weeks ago
Ranked: Semiconductor Companies by Industry Revenue Share
-

 Markets2 weeks ago
Ranked: The World’s Top Flight Routes, by Revenue
-

 Demographics2 weeks ago
Population Projections: The World’s 6 Largest Countries in 2075
-

 Markets2 weeks ago
The Top 10 States by Real GDP Growth in 2023
-

 Demographics2 weeks ago
The Smallest Gender Wage Gaps in OECD Countries
-

 Economy2 weeks ago
Where U.S. Inflation Hit the Hardest in March 2024
-

 Green2 weeks ago
Top Countries By Forest Growth Since 2001