Money
Making Billions: The Richest People in the World
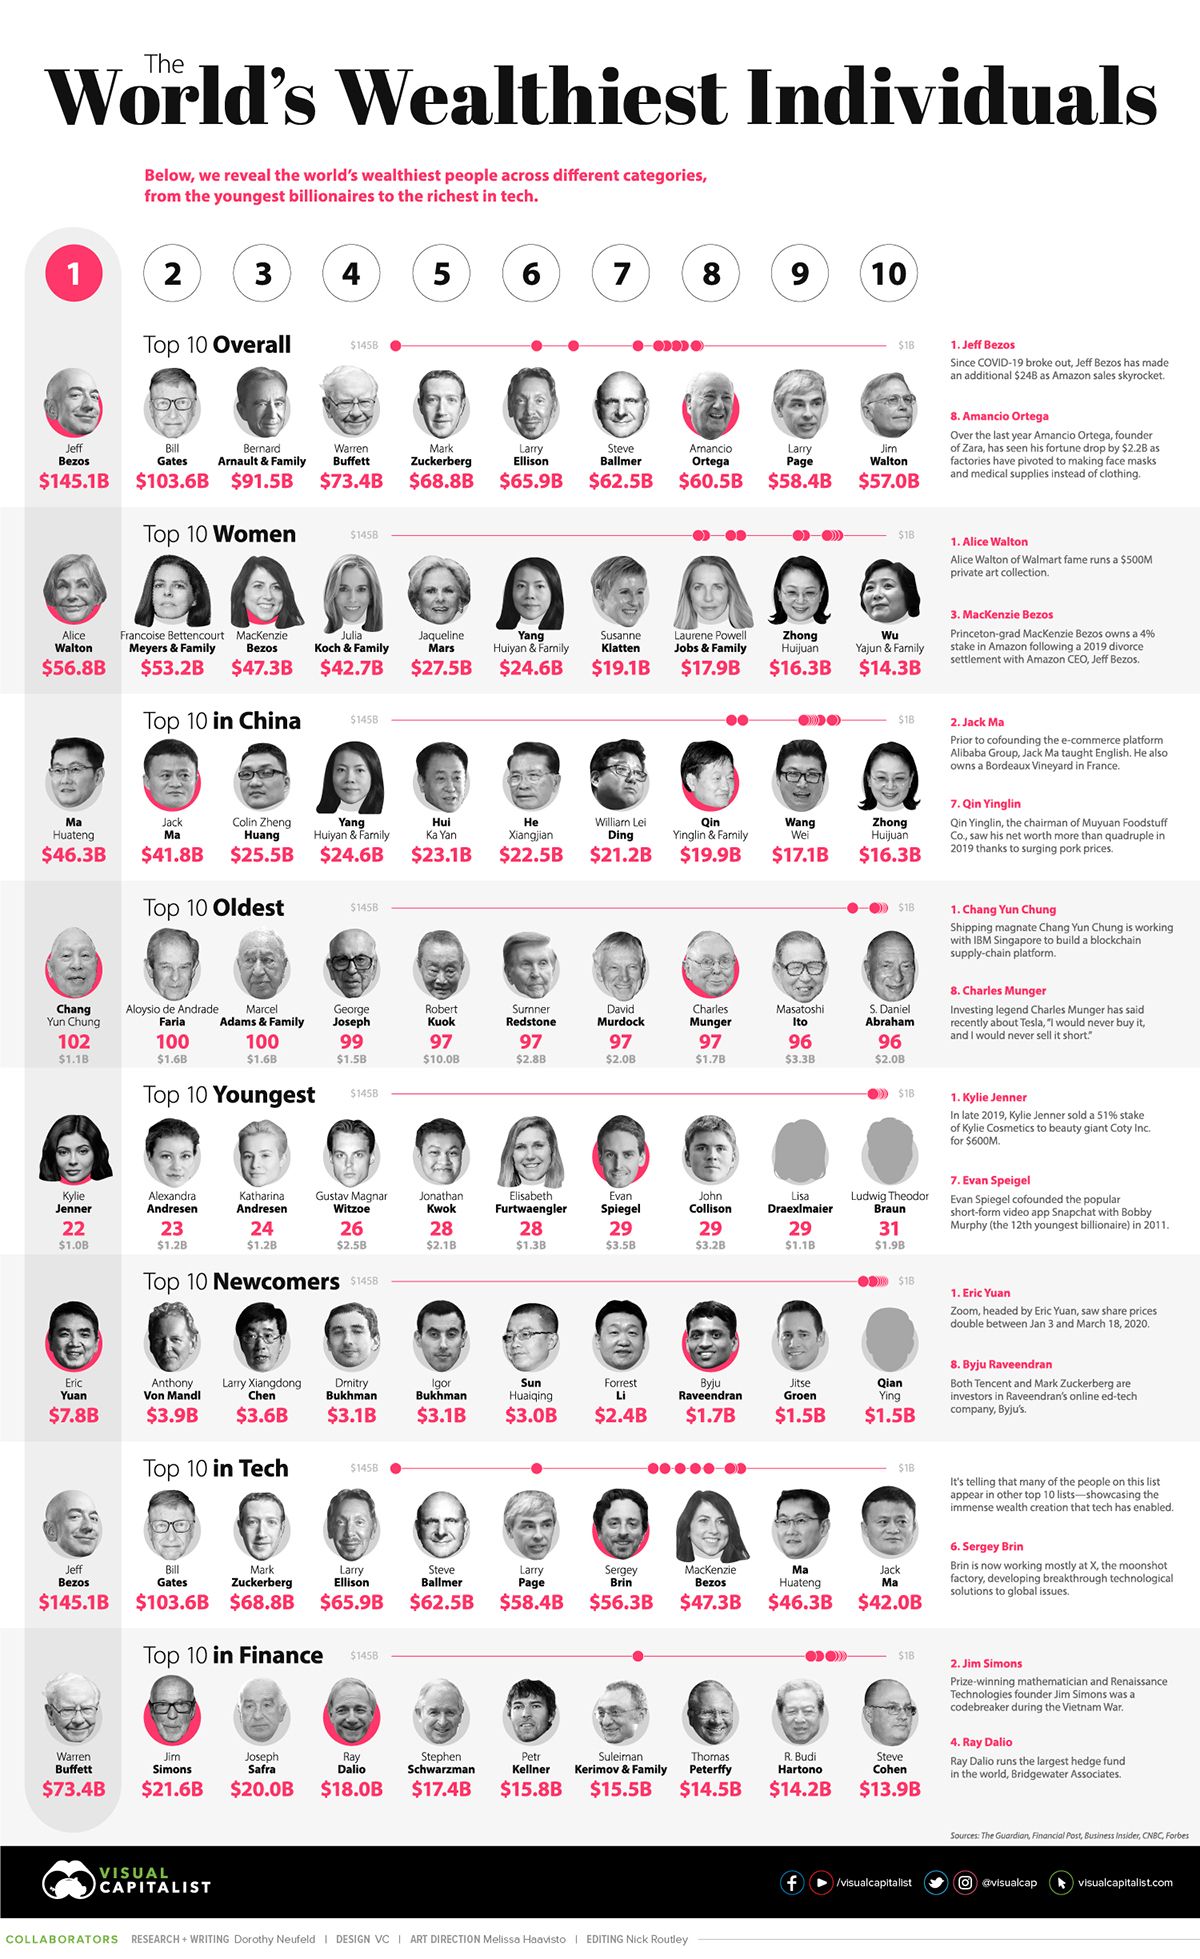
The Richest People in the World
In the last year, the wealth controlled by the world’s top 10 billionaires has jumped by over $76B.
Even in the teeth of jittery markets, many of the world’s richest people have seen their wealth surge to new heights as COVID-19 unfolds.
Today’s infographic draws data from Forbes Billionaire’s List and shows a broad cross-section of the world’s billionaires – highlighting their stratospheric wealth in the current economic climate.
Wealth in Astonishing Circumstances
The below table shows the fortunes of the world’s 10 richest people, comparing the numbers from March 5, 2019 to the most recent data from April 22, 2020.
| Rank | Name | Net Worth 2020* | Net Worth 2019* | Change 2019-2020 |
|---|---|---|---|---|
| #1 | Jeff Bezos | $145B | $131B | +$14.1B |
| #2 | Bill Gates | $104B | $97B | +$7.1B |
| #3 | Bernard Arnault & Family | $92B | $76B | +$15.5B |
| #4 | Warren Buffett | $73B | $83B | -$9.1B |
| #5 | Mark Zuckerberg | $69B | $62B | +$6.5B |
| #6 | Larry Ellison | $66B | $63B | +$3.4B |
| #7 | Steve Ballmer | $63B | $41B | +$21.3B |
| #8 | Amancio Ortega | $61B | $63B | -$2.2B |
| #9 | Larry Page | $58B | $51B | +$7.6B |
| #10 | Jim Walton | $57B | $45B | +$12.0B |
| Total Change | +$76.2B |
Source: Forbes – *As of April 22, 2020 **As of March 5, 2019
Gaining the highest across the top 10 is former Microsoft CEO Steve Ballmer, who saw his fortune rise over $21 billion since March 2019.
Facing the steepest losses belong to investing luminary Warren Buffett, whose net worth has dropped over $9 billion over the past year. At year-end 2019 Buffett was a 11% shareholder in Delta Airlines. In April, Buffett sold 13 million shares in the airline.
Meanwhile, Mark Zuckerberg’s fortune is holding steady. Amazingly, the Facebook founder still remains one of the world’s youngest billionaires (ranking 22nd out of 2,095) despite first joining the billionaire club a dozen years ago.
Newcomers to the List
As a new decade begins, who are among the most newly-minted billionaires?
Eric Yuan, CEO of Zoom has climbed in the ranks as online video communication demand soars. Zoom went public in April 2019 at a stunning $9.2 billion IPO valuation. As of April 24, 2020, Zoom was valued at over $44.3 billion.
| Rank | Name | Net Worth | Source of Wealth |
|---|---|---|---|
| #1 | Eric Yuan | $7.8B | Zoom |
| #2 | Anthony von Mandl | $3.9B | Mark Anthony Brands |
| #3 | Larry Xiangdong Chen | $3.6B | GSX Techedu |
| #4 | Dmitry Bukhman | $3.1B | Playrix |
| #5 | Igor Bukhman | $3.1B | Playrix |
| #6 | Sun Huaiqing | $3.0B | Guangdong Marubi Biotechnology |
| #7 | Forrest Li | $2.4B | Sea Group |
| #8 | Byju Raveendran | $1.7B | Byju's |
| #9 | Jitse Groen | $1.5B | Takeaway.com |
| #10 | Qian Ying | $1.5B | Muyuan Foods |
*As of April 22, 2020
Similarly, Netherland’s Jitse Groen has witnessed his food-delivery company Takeaway.com expand extensively. Takeaway.com currently operates in 11 countries across Europe and received regulatory approval to complete a $7.6 billion merger with JustEat in April.
Forrest Li who runs Sea, an online-gaming and e-commerce company, has similarly joined the ranks. Tencent and private equity firm General Atlantic are among its major stakeholders.
The COVID-19 Response
As the global economy contends with a loss of confidence and job losses, some of the world’s richest people are stepping up to the plate.

Twitter CEO Jack Dorsey is donating roughly 25% of his net worth to COVID-19 in the form of Square stock, valued at $1B.
His donation, which was placed in a donor-advised fund called Start Small LLC, is more than four times higher than any other billionaire. That said, after the pandemic, Dorsey also stated that this money may also go towards girl’s health and education, as well as universal basic income (UBI).
| Rank | Name | COVID-19-Related Donation | % of Net Worth |
|---|---|---|---|
| #1 | Jack Dorsey | $1B | 25.6% |
| #2 | Bill & Melinda Gates | $255M | 0.2% |
| #3 | Azim Premji | $132M | 2.2% |
| #4 | Andrew Forrest | $100M+ | 1.2%+ |
| #5 | Jeff Bezos | $100M | 0.1% |
| #6 | Michael Dell | $100M | 0.4% |
| #7 | Lynn Schusterman, Stacy Schusterman | $70M | 2.1% |
| #8 | Amancio Ortega | $68M | 0.1% |
| #9 | Nicky Oppenheimer | $54.5M | 0.7% |
| #10 | Johann Rupert | $54.5M | 1.1% |
*As of April 15, 2020
Overall, 77 of the world’s billionaires have made public contributions related to the COVID-19 pandemic, just a fraction of the world’s ultra-rich.
As COVID-19 continues to spread globally, will the world’s billionaires still accumulate wealth at greater speeds, or will a different picture emerge as unconventional policies around the world become increasingly commonplace?


Money
Charted: Which City Has the Most Billionaires in 2024?
Just two countries account for half of the top 20 cities with the most billionaires. And the majority of the other half are found in Asia.


Charted: Which Country Has the Most Billionaires in 2024?
This was originally posted on our Voronoi app. Download the app for free on iOS or Android and discover incredible data-driven charts from a variety of trusted sources.
Some cities seem to attract the rich. Take New York City for example, which has 340,000 high-net-worth residents with investable assets of more than $1 million.
But there’s a vast difference between being a millionaire and a billionaire. So where do the richest of them all live?
Using data from the Hurun Global Rich List 2024, we rank the top 20 cities with the highest number of billionaires in 2024.
A caveat to these rich lists: sources often vary on figures and exact rankings. For example, in last year’s reports, Forbes had New York as the city with the most billionaires, while the Hurun Global Rich List placed Beijing at the top spot.
Ranked: Top 20 Cities with the Most Billionaires in 2024
The Chinese economy’s doldrums over the course of the past year have affected its ultra-wealthy residents in key cities.
Beijing, the city with the most billionaires in 2023, has not only ceded its spot to New York, but has dropped to #4, overtaken by London and Mumbai.
| Rank | City | Billionaires | Rank Change YoY |
|---|---|---|---|
| 1 | 🇺🇸 New York | 119 | +1 |
| 2 | 🇬🇧 London | 97 | +3 |
| 3 | 🇮🇳 Mumbai | 92 | +4 |
| 4 | 🇨🇳 Beijing | 91 | -3 |
| 5 | 🇨🇳 Shanghai | 87 | -2 |
| 6 | 🇨🇳 Shenzhen | 84 | -2 |
| 7 | 🇭🇰 Hong Kong | 65 | -1 |
| 8 | 🇷🇺 Moscow | 59 | No Change |
| 9 | 🇮🇳 New Delhi | 57 | +6 |
| 10 | 🇺🇸 San Francisco | 52 | No Change |
| 11 | 🇹🇭 Bangkok | 49 | +2 |
| 12 | 🇹🇼 Taipei | 45 | +2 |
| 13 | 🇫🇷 Paris | 44 | -2 |
| 14 | 🇨🇳 Hangzhou | 43 | -5 |
| 15 | 🇸🇬 Singapore | 42 | New to Top 20 |
| 16 | 🇨🇳 Guangzhou | 39 | -4 |
| 17T | 🇮🇩 Jakarta | 37 | +1 |
| 17T | 🇧🇷 Sao Paulo | 37 | No Change |
| 19T | 🇺🇸 Los Angeles | 31 | No Change |
| 19T | 🇰🇷 Seoul | 31 | -3 |
In fact all Chinese cities on the top 20 list have lost billionaires between 2023–24. Consequently, they’ve all lost ranking spots as well, with Hangzhou seeing the biggest slide (-5) in the top 20.
Where China lost, all other Asian cities—except Seoul—in the top 20 have gained ranks. Indian cities lead the way, with New Delhi (+6) and Mumbai (+3) having climbed the most.
At a country level, China and the U.S combine to make up half of the cities in the top 20. They are also home to about half of the world’s 3,200 billionaire population.
In other news of note: Hurun officially counts Taylor Swift as a billionaire, estimating her net worth at $1.2 billion.

-

 Debt1 week ago
How Debt-to-GDP Ratios Have Changed Since 2000
-

 Markets2 weeks ago
Ranked: The World’s Top Flight Routes, by Revenue
-

 Countries2 weeks ago
Population Projections: The World’s 6 Largest Countries in 2075
-

 Markets2 weeks ago
The Top 10 States by Real GDP Growth in 2023
-

 Demographics2 weeks ago
The Smallest Gender Wage Gaps in OECD Countries
-

 United States2 weeks ago
Where U.S. Inflation Hit the Hardest in March 2024
-

 Green2 weeks ago
Top Countries By Forest Growth Since 2001
-

 United States2 weeks ago
Ranked: The Largest U.S. Corporations by Number of Employees