Politics
U.S. Presidential Voting History from 1976-2020 (Animated Map)
How to Use: The below maps will animate automatically. To pause, move your cursor on the image. Arrows on left/right navigate.


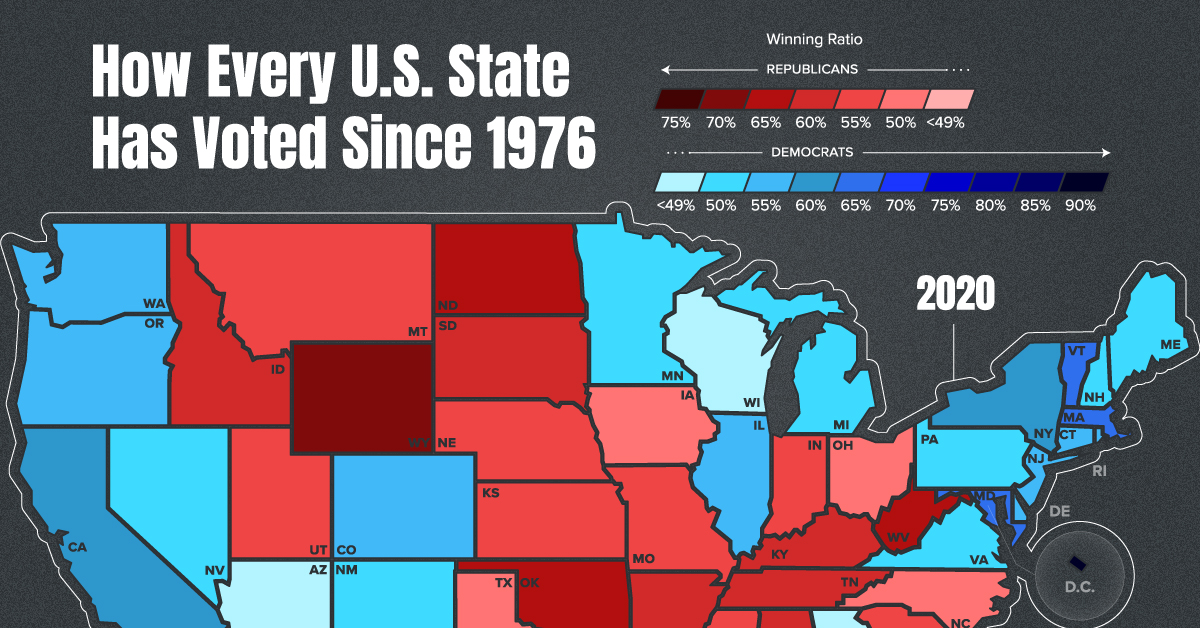
U.S. Presidential Voting History by State
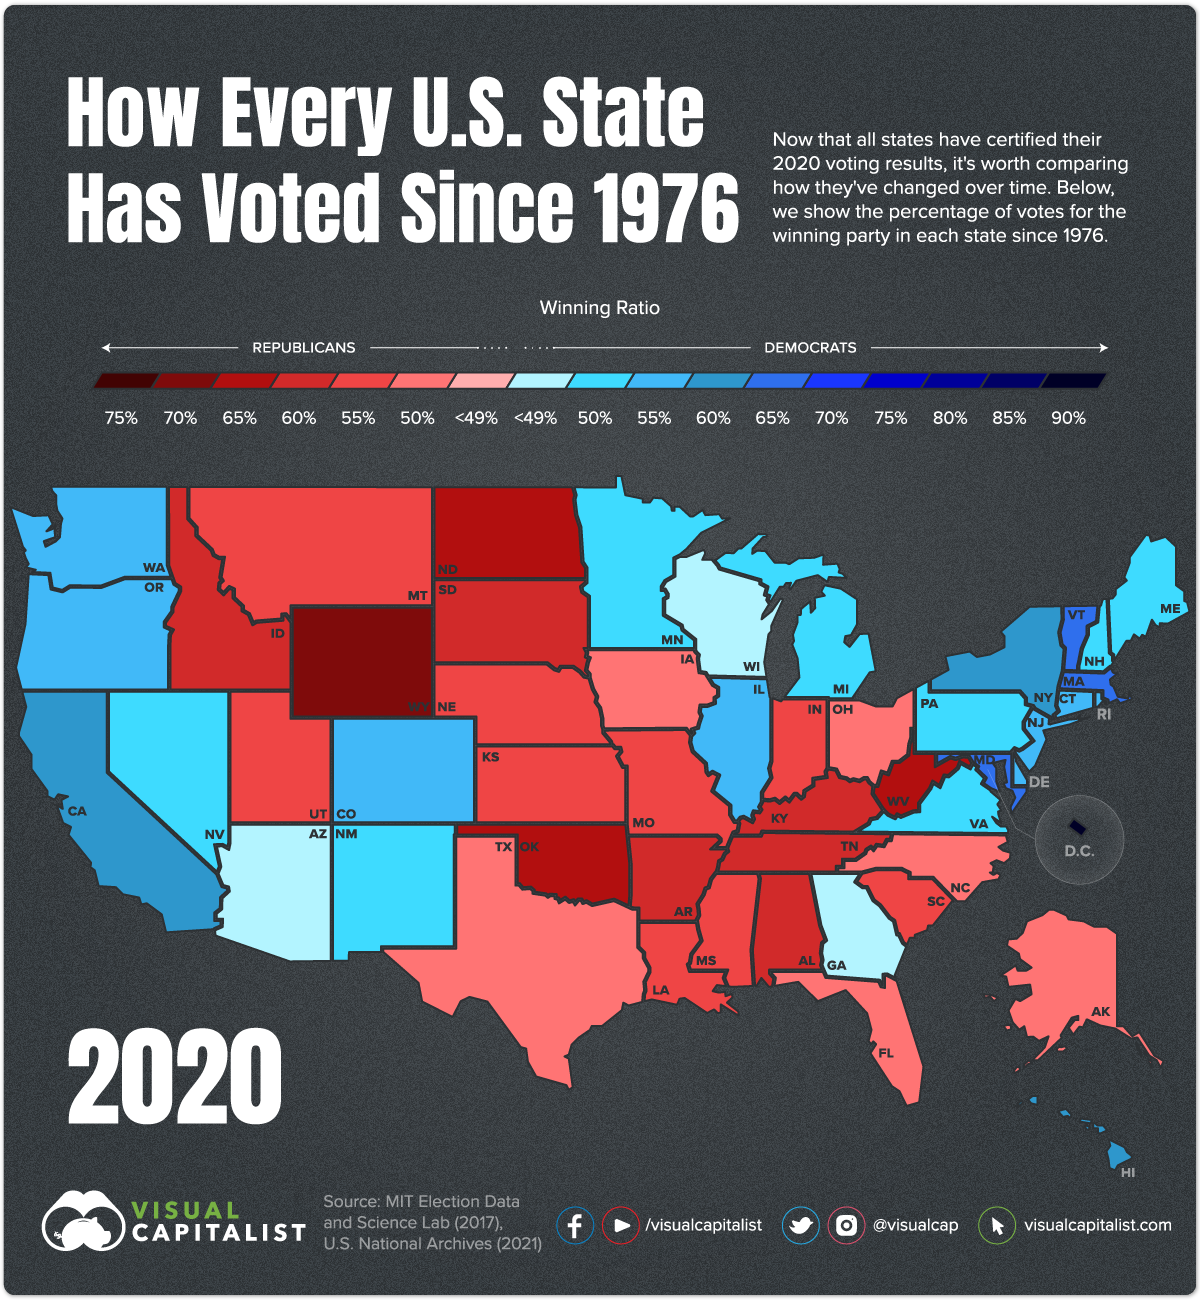
After a tumultuous election, all states have now certified their 2020 presidential voting results. Which states changed party allegiance, and how do the results compare to previous years?
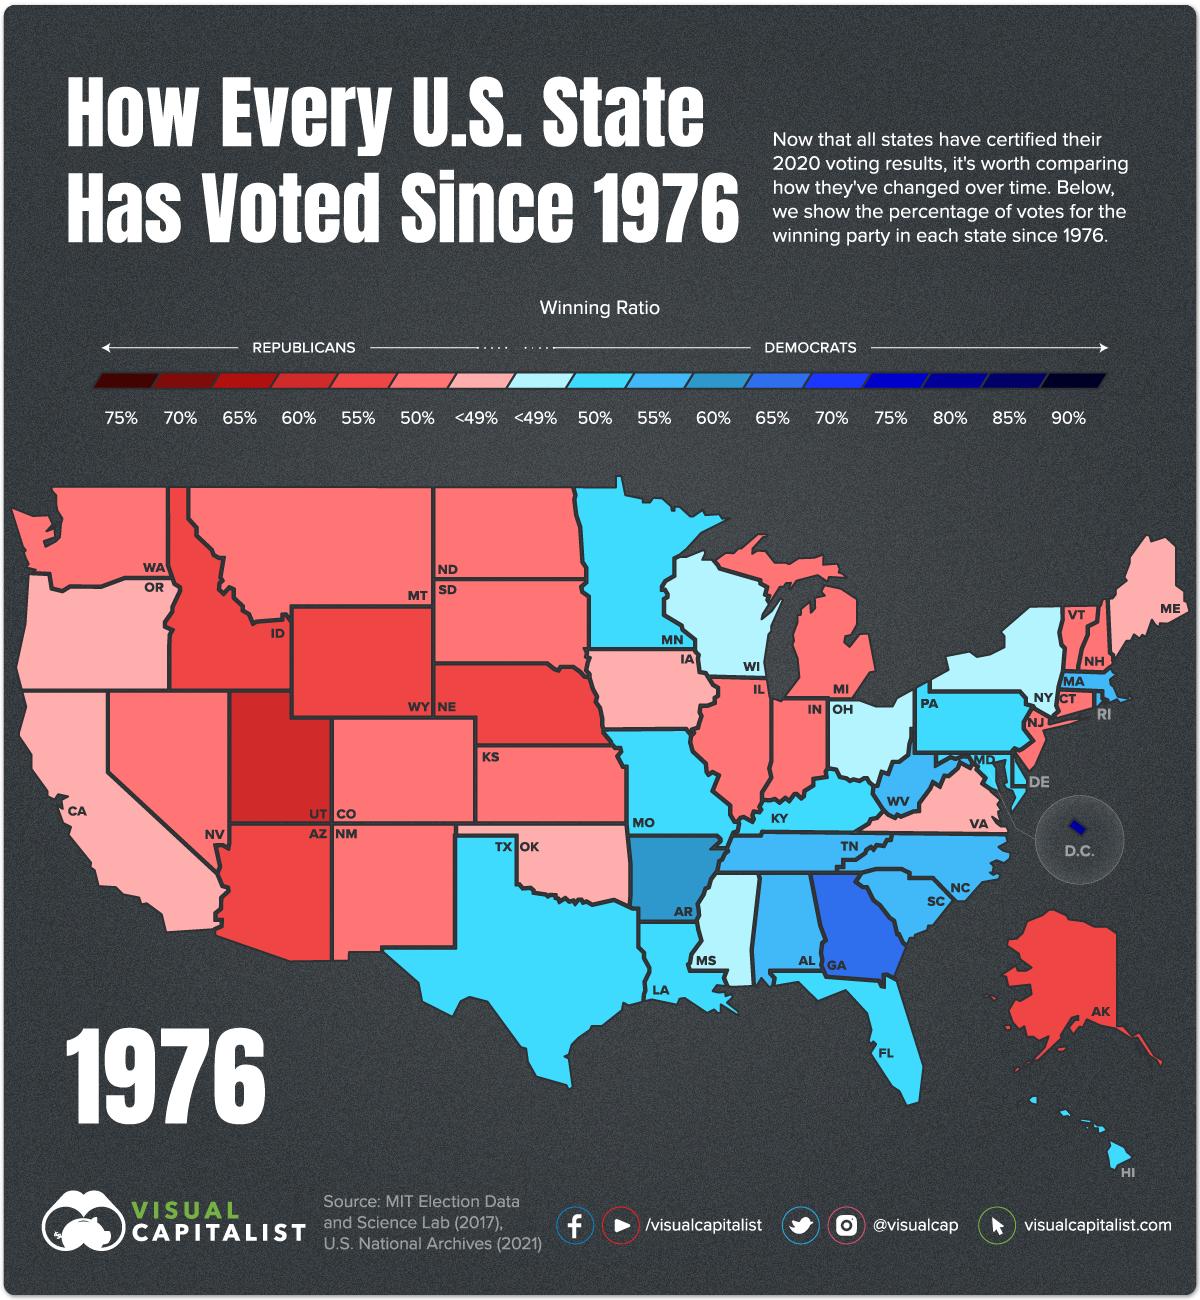
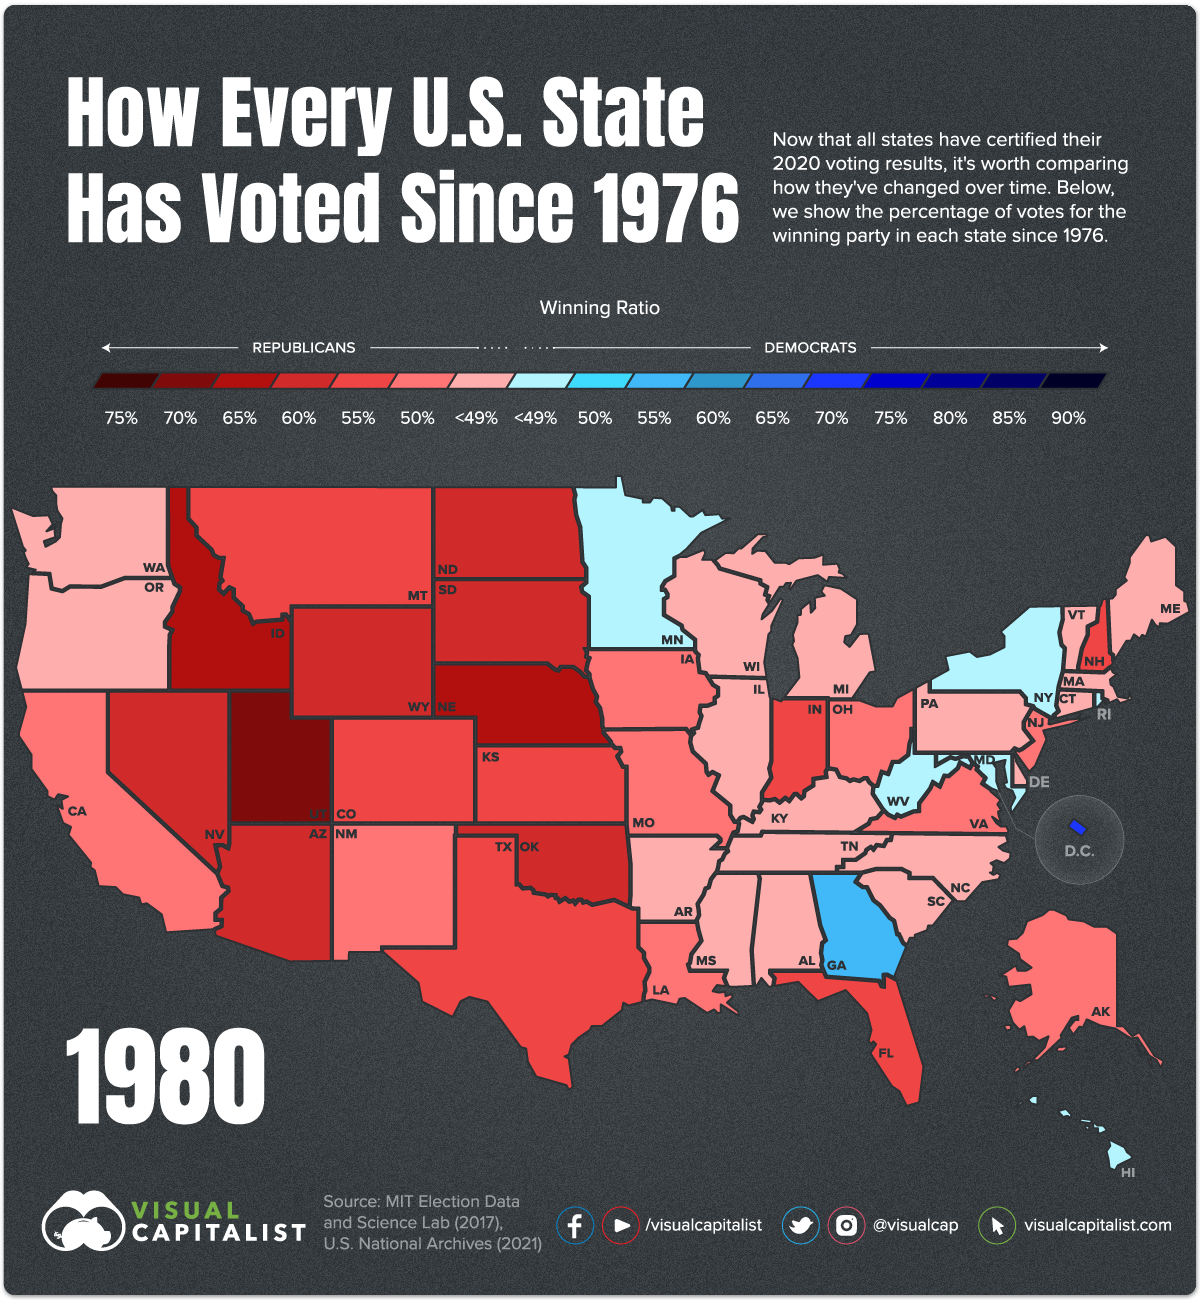
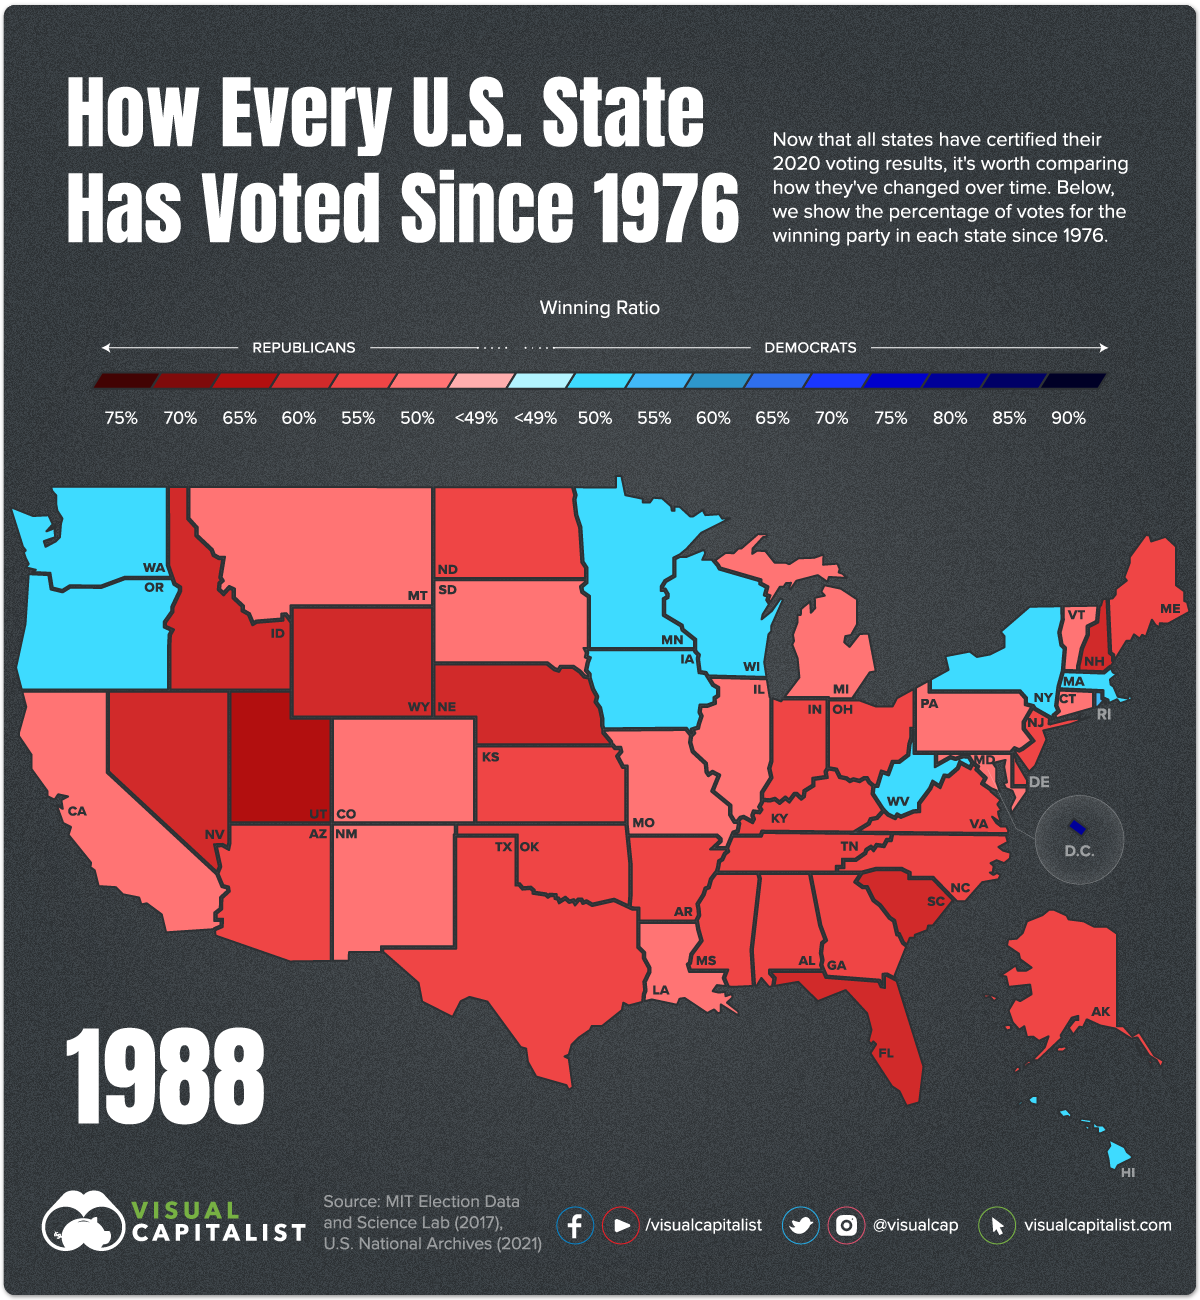
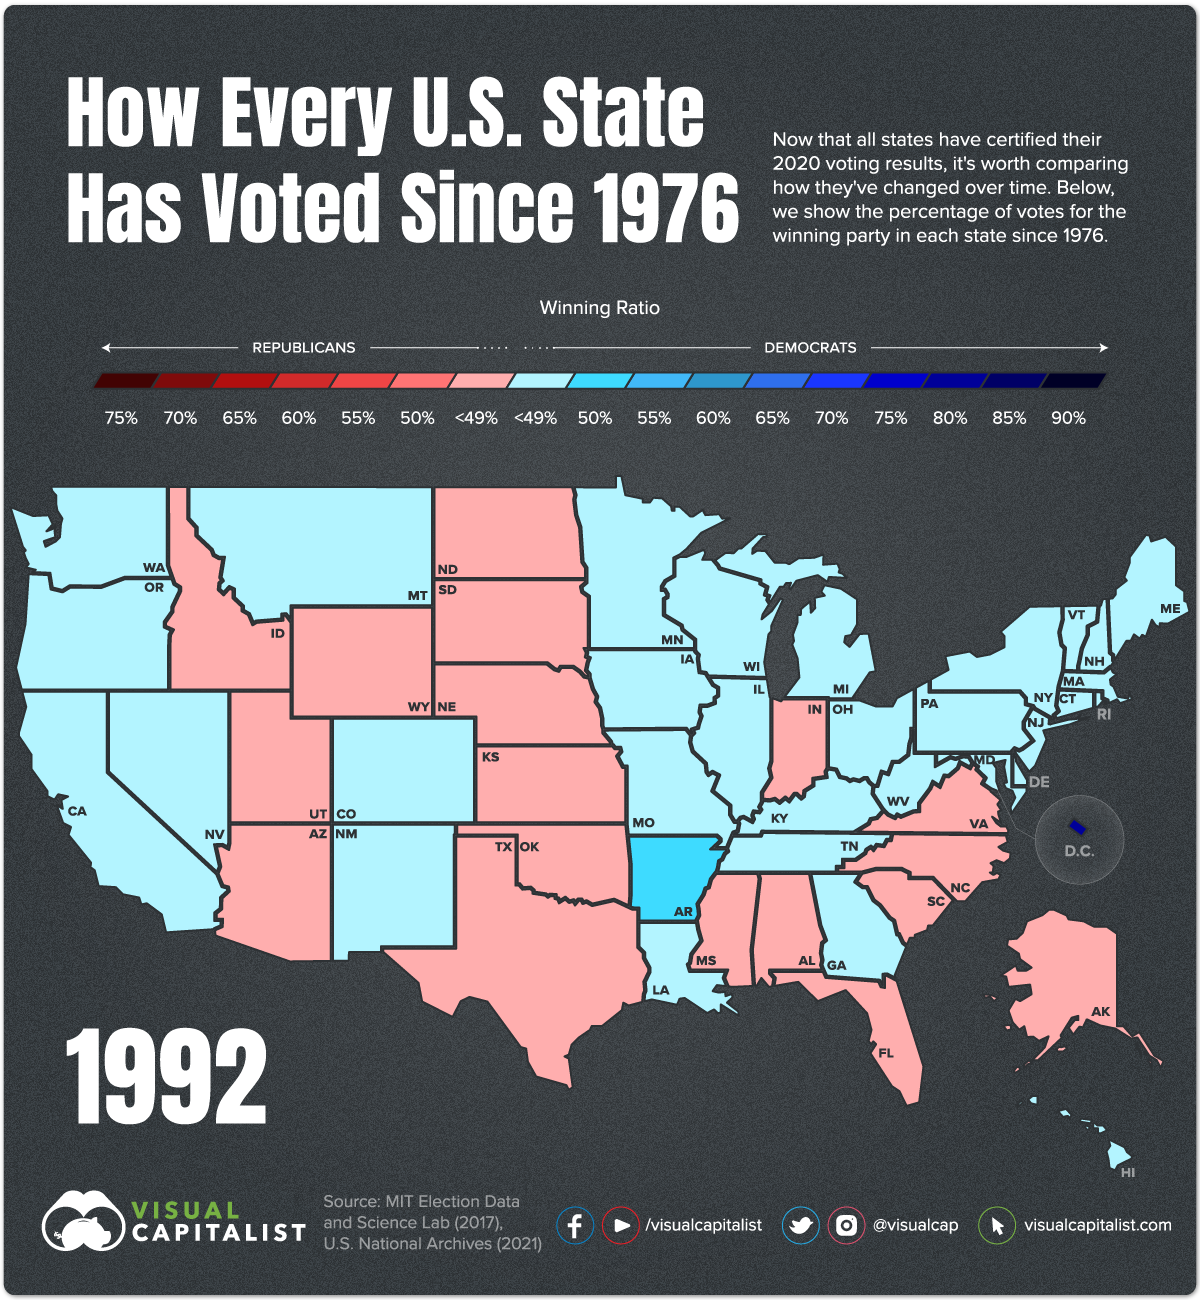
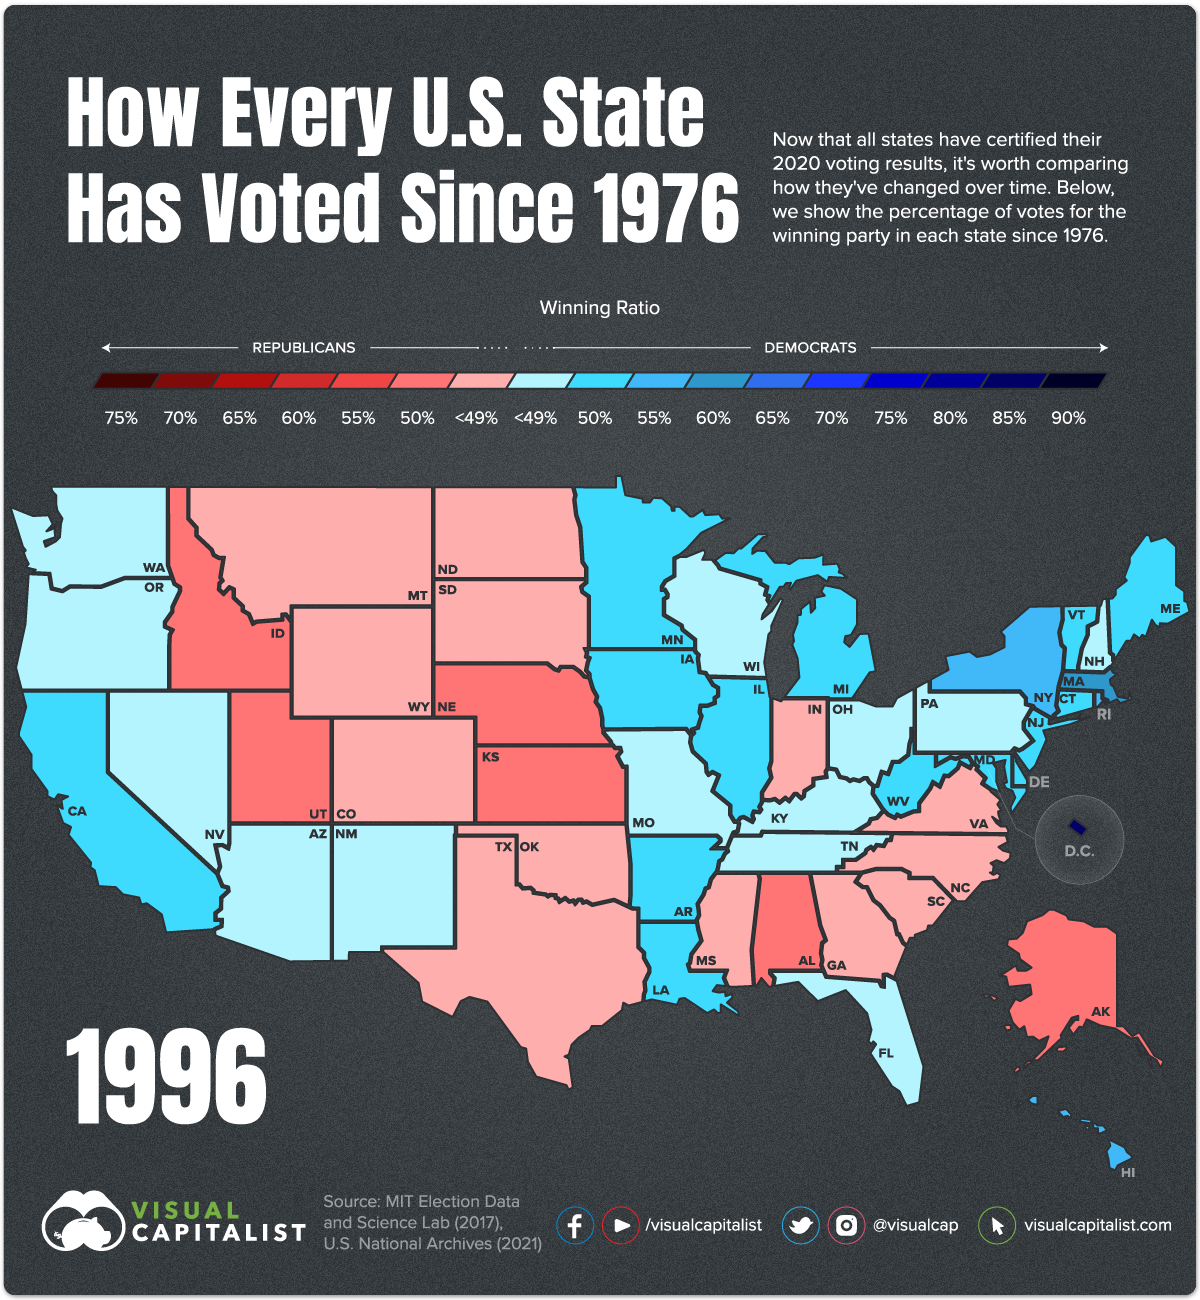
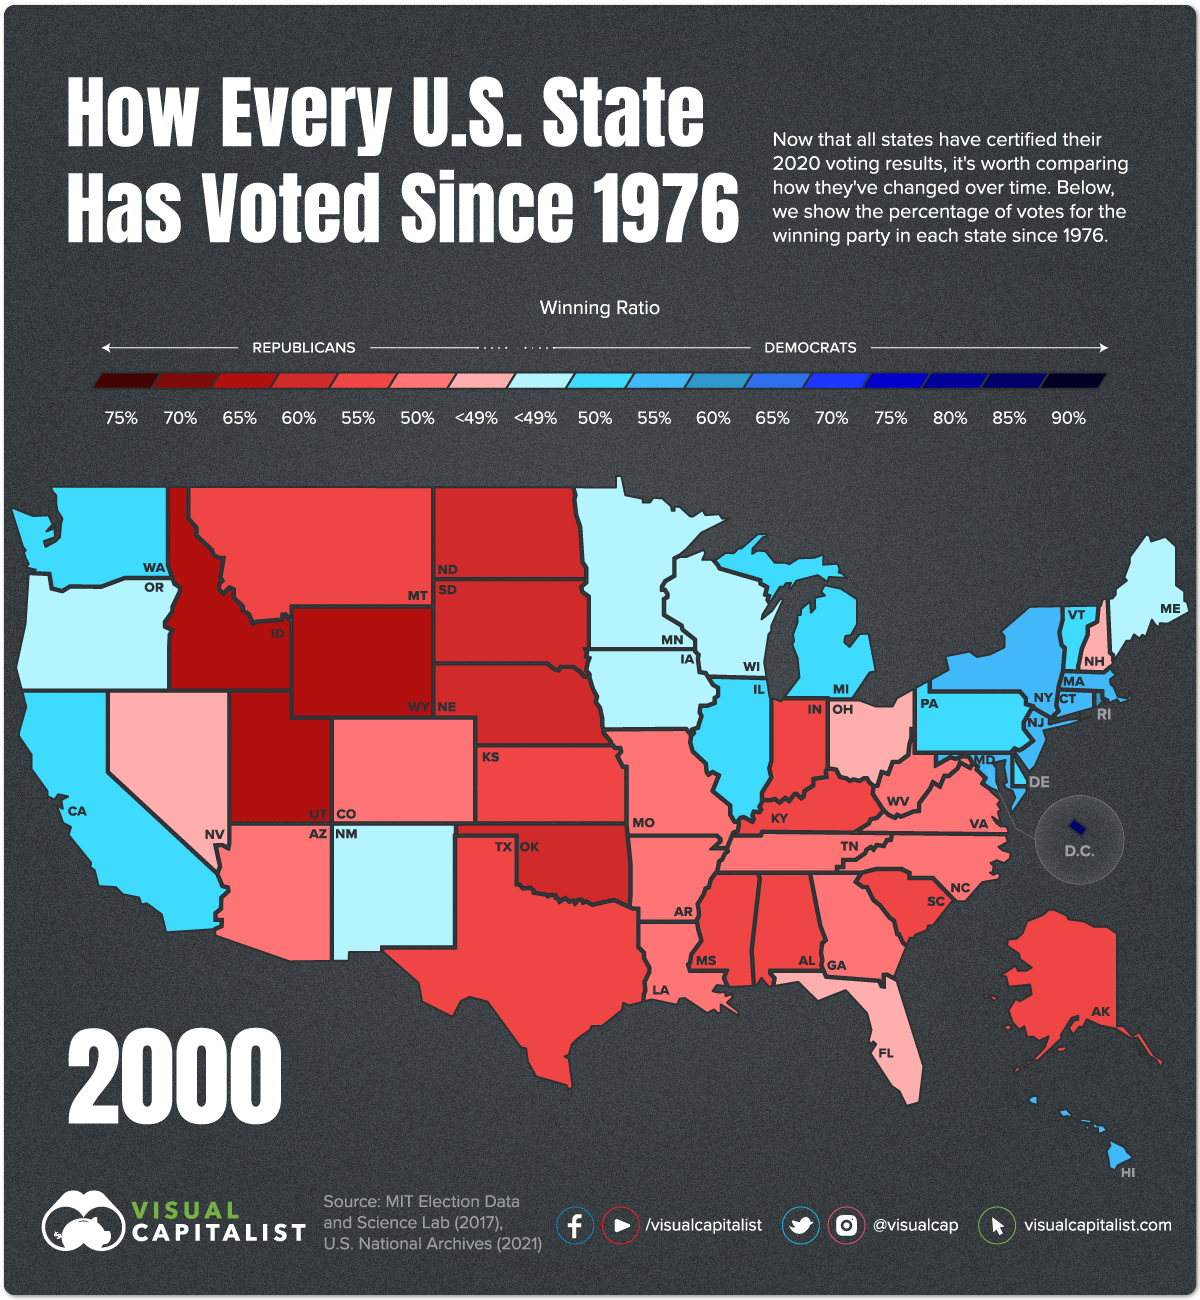
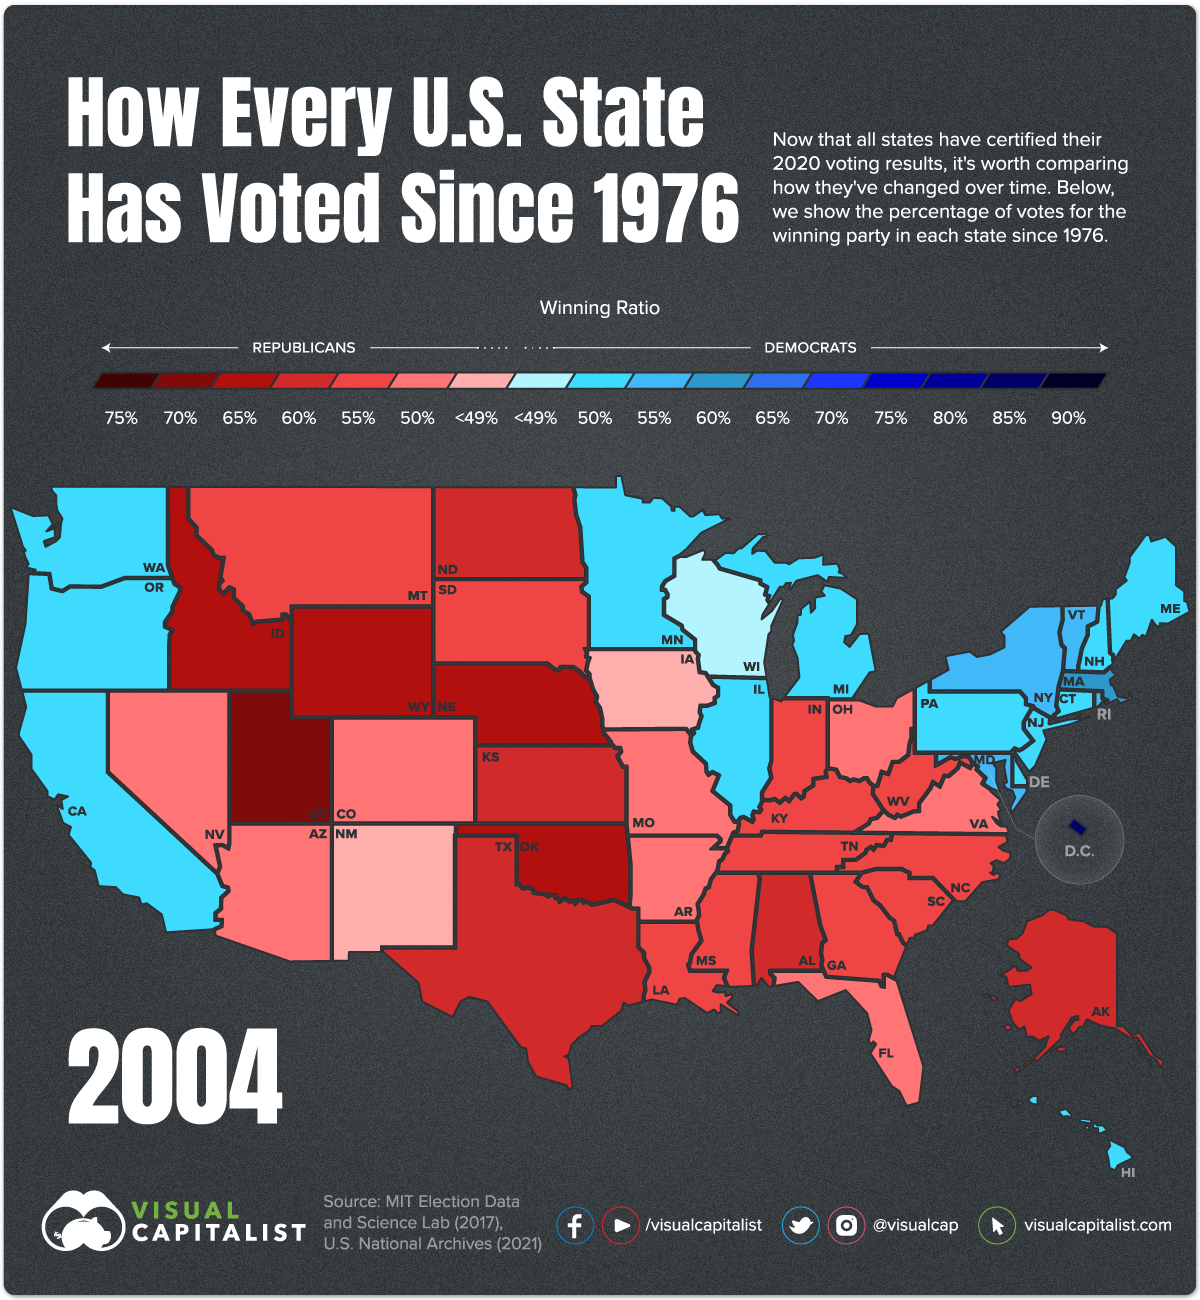
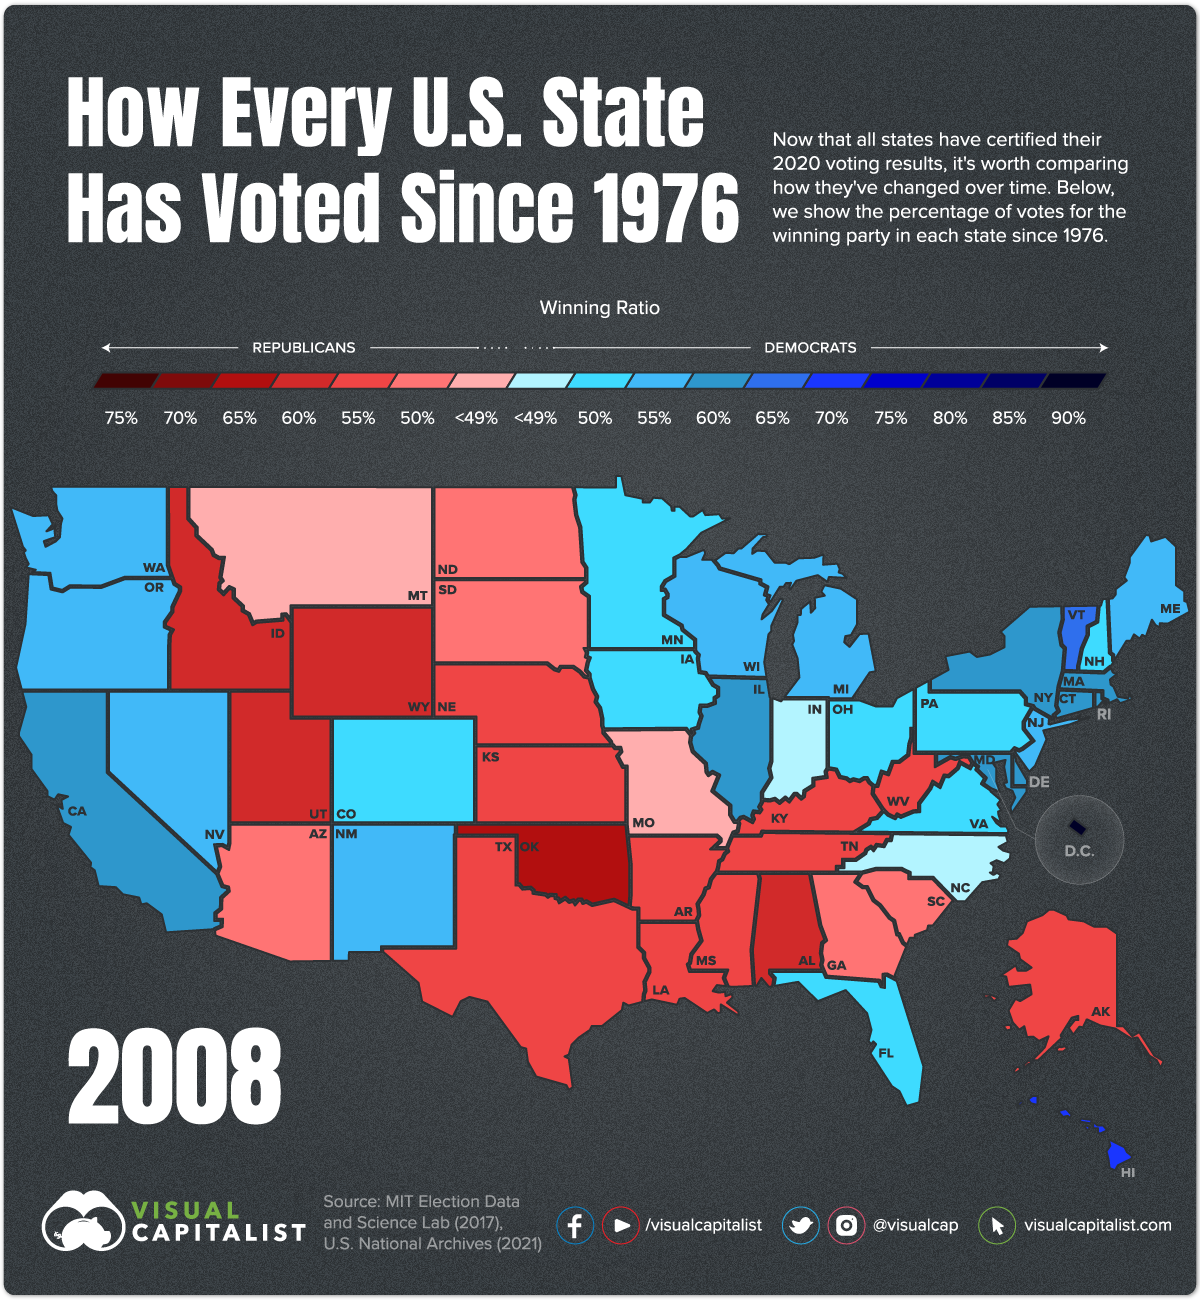
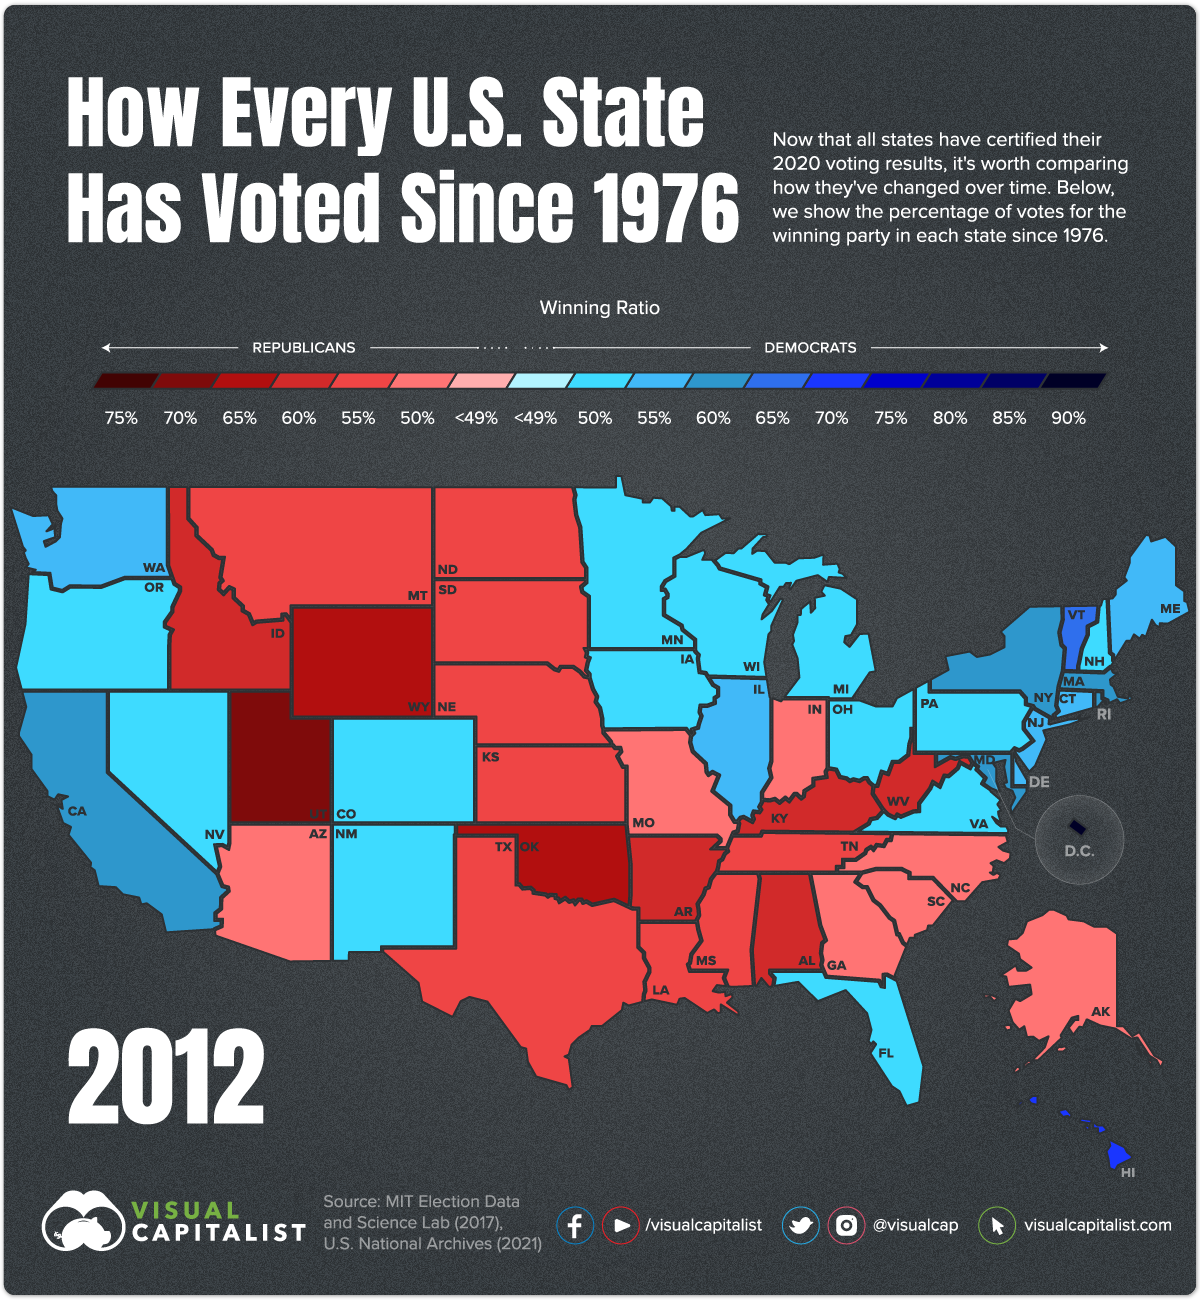
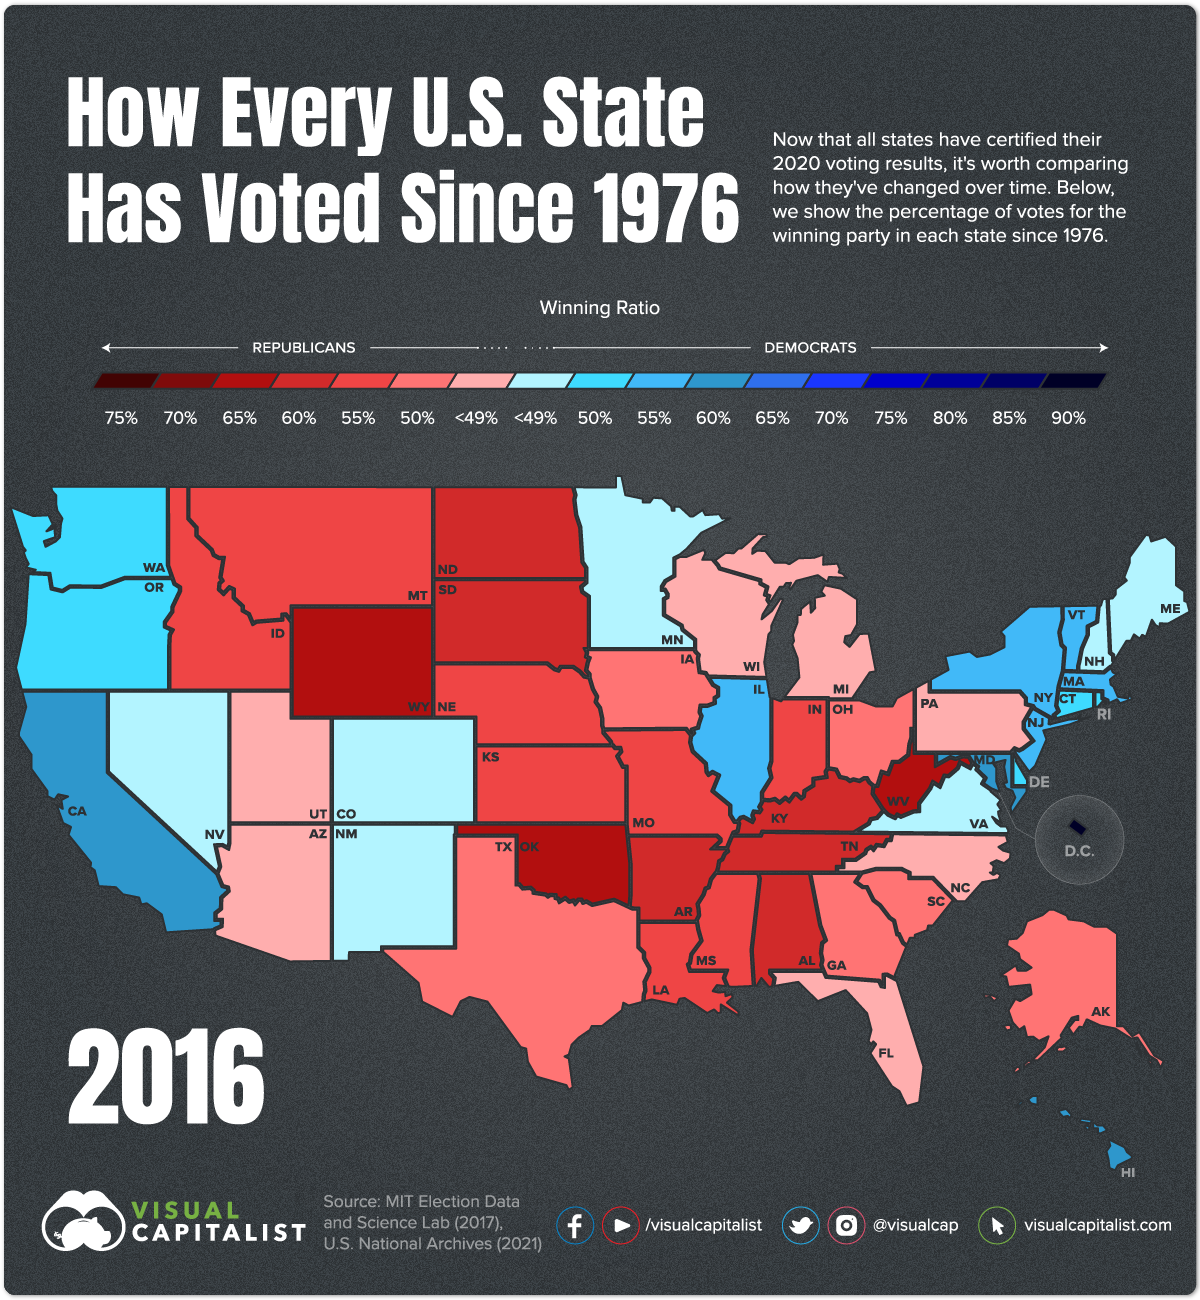
In this graphic, we use data from the U.S. National Archives and the MIT Election Data and Science Lab to show U.S. presidential voting history by state since 1976.
Note: this post has been updated on January 19, 2021 to reflect the latest data.
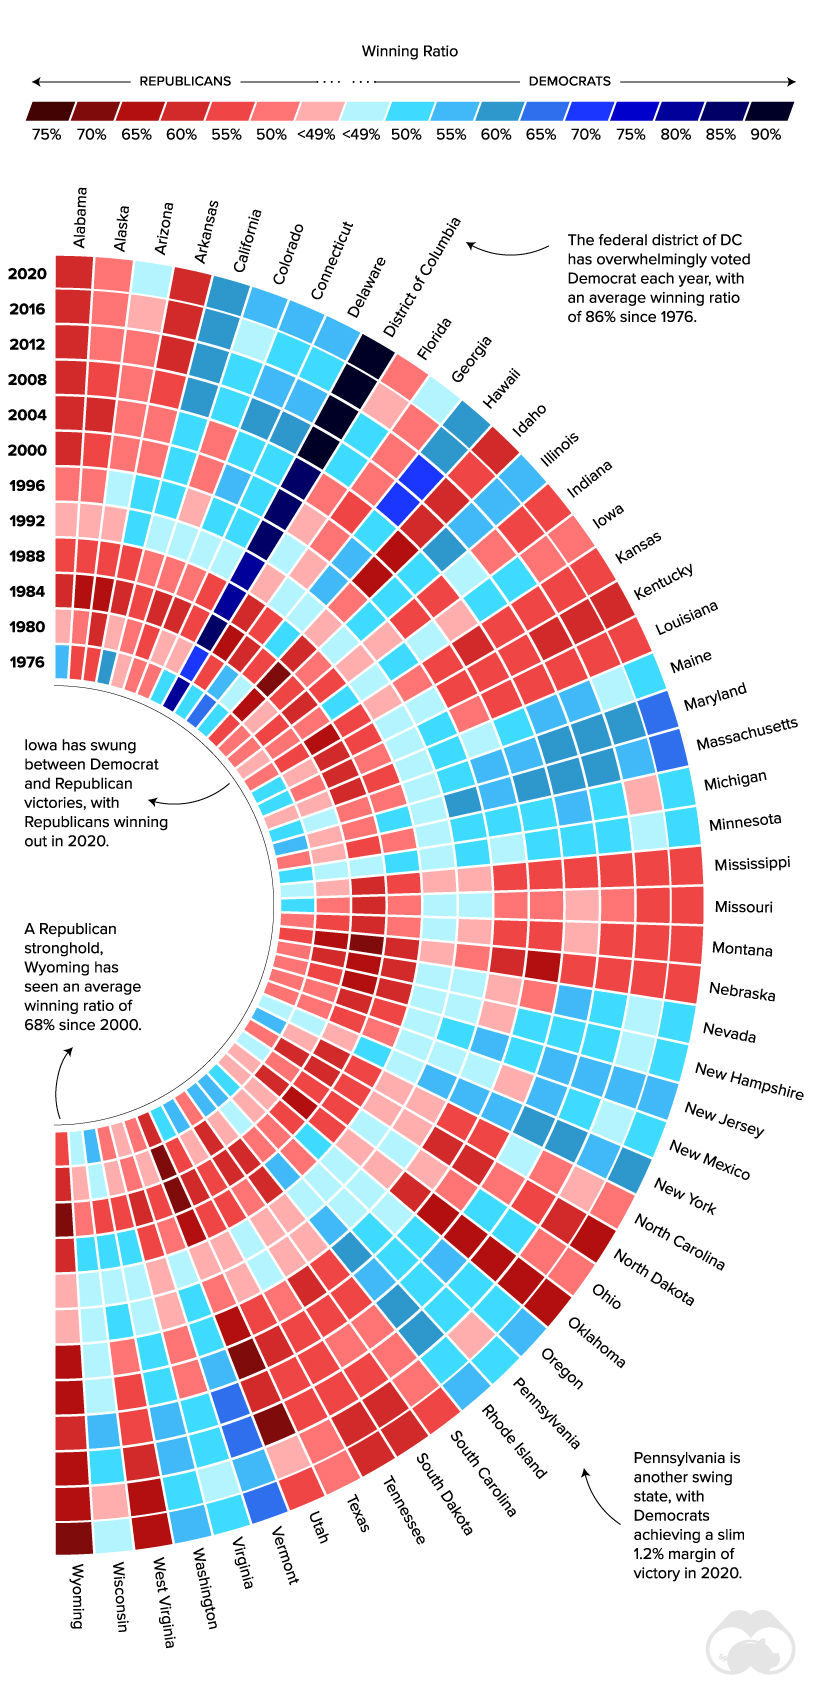
Each State’s Winning Party
To calculate the winning ratio, we divided the votes for the state’s winning party by the total number of state votes. Here’s another look at the same data, visualized in a different way.
This graphic was inspired by this Reddit post.
As the voting history shows, some states—such as Alaska, Oklahoma, and Wyoming—have consistently supported the Republican Party. On the other hand, Hawaii, Minnesota, and the District of Columbia have been Democrat strongholds for many decades.
The District of Columbia (D.C.) is a federal district, and is not part of any U.S. State. Its population is urban and has a large percentage of Black and college-educated citizens, all of which are groups that tend to identify as Democrat.
Swing states typically see a close contest between Democrats and Republicans. For example, Florida’s average margin of victory for presidential candidates has been just 2.7% since 1996. It’s often seen as a key battleground, and for good reason: the state has 29 electoral college votes, meaning it has a high weighting in the final outcome.
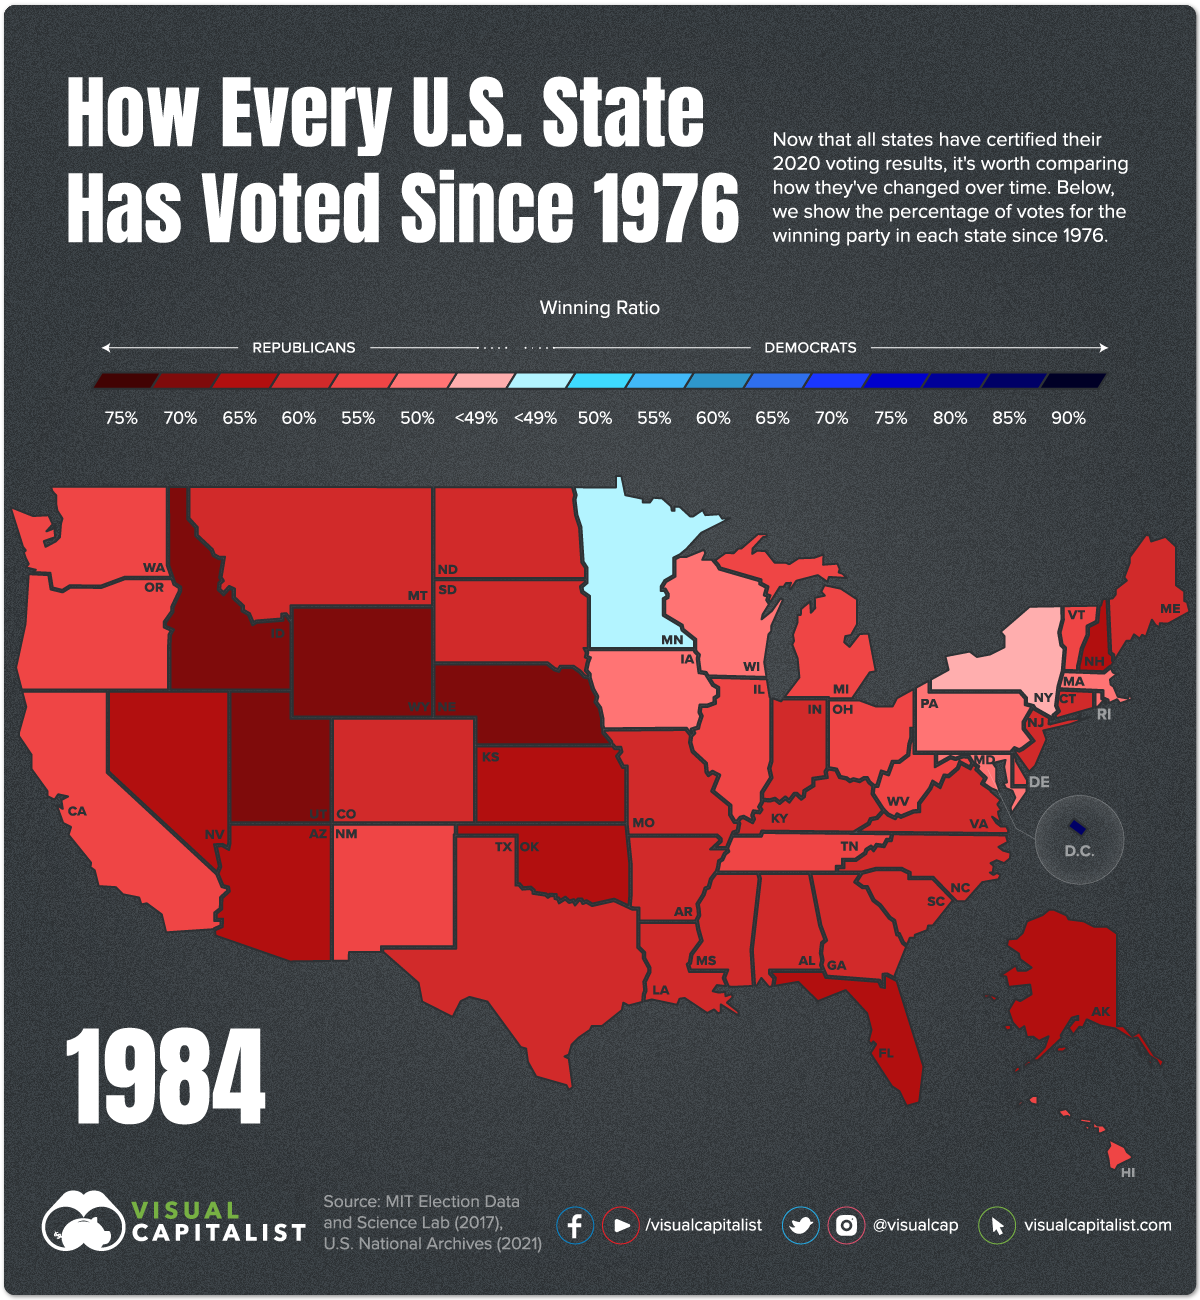
Memorable Election Years
Within U.S. presidential voting history, some election results stand out more than others. In 1984, President Reagan was re-elected in a landslide victory, winning 49 out of 50 states. The remarkable win has been credited to the economic recovery during Reagan’s first term, Reagan’s charisma, and voters’ opposition to the Democrat’s planned tax increases.
In 1992, self-made Texas billionaire Ross Perot ran as a third-party candidate. He captured almost 19% of the popular vote, the highest percentage of any third-party presidential candidate in over 80 years. While he gained support from those looking for a change from traditional party politics, Bill Clinton ultimately went on to win the election.
Most recently, the 2020 election had a record voter turnout, with 66.3% of the eligible population casting a ballot. There was also a record number of mail-in ballots due to the COVID-19 pandemic. This led to widespread allegations of voter fraud, with President Trump and his allies filing 62 lawsuits seeking to overturn election results. In the end, 61 of the lawsuits were defeated and congress confirmed Joe Biden’s victory.
Voting History of Swing States
Both Trump and Biden focused on battleground states in 2020, but where were they successful? Here are nine of the swing states, and their voting history over the last two elections.
| 2020 Winning Ratio | 2020 Margin of Victory | 2016 Winning Ratio | 2016 Margin of Victory | |
|---|---|---|---|---|
| Arizona | 49.4% Democrat | 0.31% | 48.7% Republican | 3.60% |
| Florida | 51.2% Republican | 3.36% | 49.0% Republican | 1.20% |
| Georgia | 49.5% Democrat | 0.24% | 50.8% Republican | 5.20% |
| Iowa | 53.2% Republican | 8.20% | 51.2% Republican | 9.40% |
| Michigan | 50.6% Democrat | 2.78% | 47.5% Republican | 0.20% |
| North Carolina | 50.1% Republican | 1.35% | 49.8% Republican | 3.60% |
| Ohio | 53.3% Republican | 8.03% | 51.7% Republican | 8.10% |
| Pennsylvania | 50.0% Democrat | 1.16% | 48.9% Republican | 0.70% |
| Wisconsin | 49.5% Democrat | 0.63% | 47.2% Republican | 0.70% |
The Republican party won four of the swing states in 2020, including Florida. However, 2020 was the first year since 1964 that the candidate who won Florida did not go on to win the election.
Five of the states—Arizona, Georgia, Michigan, Pennsylvania, and Wisconsin—flipped allegiance to the Democrats. In Georgia, the margin of victory was as small as 0.24% or about 12,000 votes. Ultimately, winning over these states helped lead to a Biden victory.


Economy
The Bloc Effect: International Trade with Geopolitical Allies on the Rise
Rising geopolitical tensions are shaping the future of international trade, but what is the effect on trading among G7 and BRICS countries?


The Bloc Effect: International Trade with Allies on the Rise
International trade has become increasingly fragmented over the last five years as countries have shifted to trading more with their geopolitical allies.
This graphic from The Hinrich Foundation, the first in a three-part series covering the future of trade, provides visual context to the growing divide in trade in G7 and pre-expansion BRICS countries, which are used as proxies for geopolitical blocs.
Trade Shifts in G7 and BRICS Countries
This analysis uses IMF data to examine differences in shares of exports within and between trading blocs from 2018 to 2023. For example, we looked at the percentage of China’s exports with other BRICS members as well as with G7 members to see how these proportions shifted in percentage points (pp) over time.
Countries traded nearly $270 billion more with allies in 2023 compared to 2018. This shift came at the expense of trade with rival blocs, which saw a decline of $314 billion.
Country Change in Exports Within Bloc (pp) Change in Exports With Other Bloc (pp)
🇮🇳 India 0.0 3.9
🇷🇺 Russia 0.7 -3.8
🇮🇹 Italy 0.8 -0.7
🇨🇦 Canada 0.9 -0.7
🇫🇷 France 1.0 -1.1
🇪🇺 EU 1.1 -1.5
🇩🇪 Germany 1.4 -2.1
🇿🇦 South Africa 1.5 1.5
🇺🇸 U.S. 1.6 -0.4
🇯🇵 Japan 2.0 -1.7
🇨🇳 China 2.1 -5.2
🇧🇷 Brazil 3.7 -3.3
🇬🇧 UK 10.2 0.5
All shifts reported are in percentage points. For example, the EU saw its share of exports to G7 countries rise from 74.3% in 2018 to 75.4% in 2023, which equates to a 1.1 percentage point increase.
The UK saw the largest uptick in trading with other countries within the G7 (+10.2 percentage points), namely the EU, as the post-Brexit trade slump to the region recovered.
Meanwhile, the U.S.-China trade dispute caused China’s share of exports to the G7 to fall by 5.2 percentage points from 2018 to 2023, the largest decline in our sample set. In fact, partly as a result of the conflict, the U.S. has by far the highest number of harmful tariffs in place.
The Russia-Ukraine War and ensuing sanctions by the West contributed to Russia’s share of exports to the G7 falling by 3.8 percentage points over the same timeframe.
India, South Africa, and the UK bucked the trend and continued to witness advances in exports with the opposing bloc.
Average Trade Shifts of G7 and BRICS Blocs
Though results varied significantly on a country-by-country basis, the broader trend towards favoring geopolitical allies in international trade is clear.
Bloc Change in Exports Within Bloc (pp) Change in Exports With Other Bloc (pp)
Average 2.1 -1.1
BRICS 1.6 -1.4
G7 incl. EU 2.4 -1.0
Overall, BRICS countries saw a larger shift away from exports with the other bloc, while for G7 countries the shift within their own bloc was more pronounced. This implies that though BRICS countries are trading less with the G7, they are relying more on trade partners outside their bloc to make up for the lost G7 share.
A Global Shift in International Trade and Geopolitical Proximity
The movement towards strengthening trade relations based on geopolitical proximity is a global trend.
The United Nations categorizes countries along a scale of geopolitical proximity based on UN voting records.
According to the organization’s analysis, international trade between geopolitically close countries rose from the first quarter of 2022 (when Russia first invaded Ukraine) to the third quarter of 2023 by over 6%. Conversely, trade with geopolitically distant countries declined.
The second piece in this series will explore China’s gradual move away from using the U.S. dollar in trade settlements.
Visit the Hinrich Foundation to learn more about the future of geopolitical trade

-

 Economy3 days ago
Economic Growth Forecasts for G7 and BRICS Countries in 2024
The IMF has released its economic growth forecasts for 2024. How do the G7 and BRICS countries compare?
-

 United States2 weeks ago
Ranked: The Largest U.S. Corporations by Number of Employees
We visualized the top U.S. companies by employees, revealing the massive scale of retailers like Walmart, Target, and Home Depot.
-

 Economy2 weeks ago
Where U.S. Inflation Hit the Hardest in March 2024
We visualized product categories that saw the highest % increase in price due to U.S. inflation as of March 2024.
-

 Economy1 month ago
G20 Inflation Rates: Feb 2024 vs COVID Peak
We visualize inflation rates across G20 countries as of Feb 2024, in the context of their COVID-19 pandemic peak.
-

 Economy1 month ago
Mapped: Unemployment Claims by State
This visual heatmap of unemployment claims by state highlights New York, California, and Alaska leading the country by a wide margin.
-

 Economy2 months ago
Confidence in the Global Economy, by Country
Will the global economy be stronger in 2024 than in 2023?

-

 Debt1 week ago
How Debt-to-GDP Ratios Have Changed Since 2000
-

 Markets2 weeks ago
Ranked: The World’s Top Flight Routes, by Revenue
-

 Demographics2 weeks ago
Population Projections: The World’s 6 Largest Countries in 2075
-

 Markets2 weeks ago
The Top 10 States by Real GDP Growth in 2023
-

 Demographics2 weeks ago
The Smallest Gender Wage Gaps in OECD Countries
-
Economy2 weeks ago
Where U.S. Inflation Hit the Hardest in March 2024
-

 Green2 weeks ago
Top Countries By Forest Growth Since 2001
-
United States2 weeks ago
Ranked: The Largest U.S. Corporations by Number of Employees