Demographics
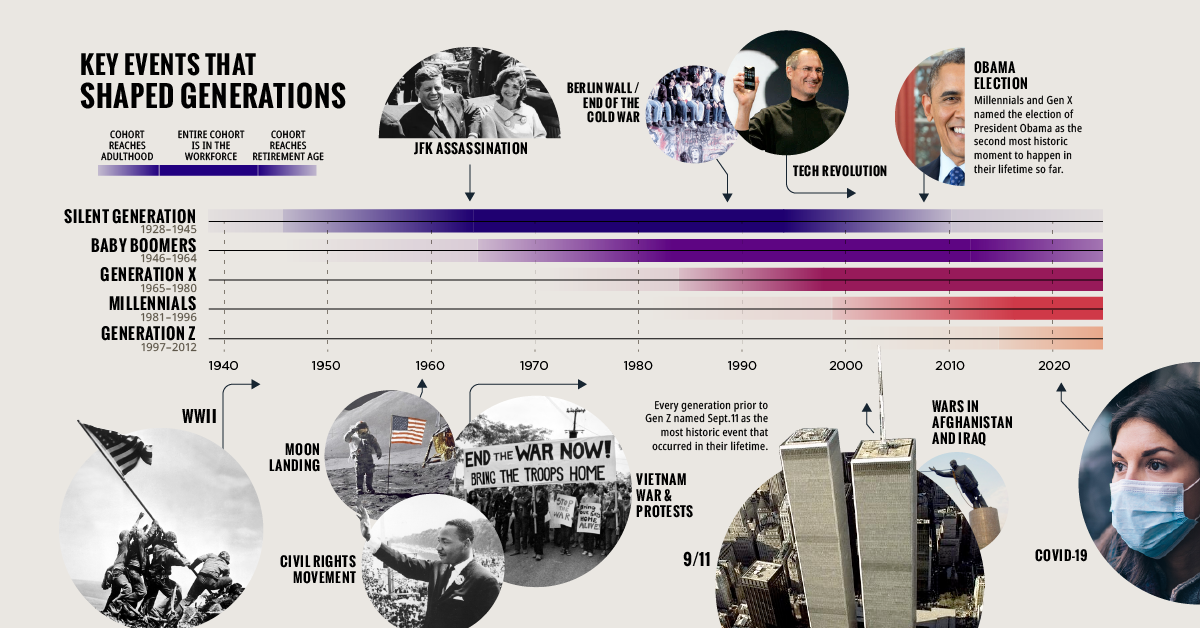
Timeline: Key Events in U.S. History that Defined Generations

Introducing our new index, which ranks U.S. generations on their economic, political, and cultural influence.
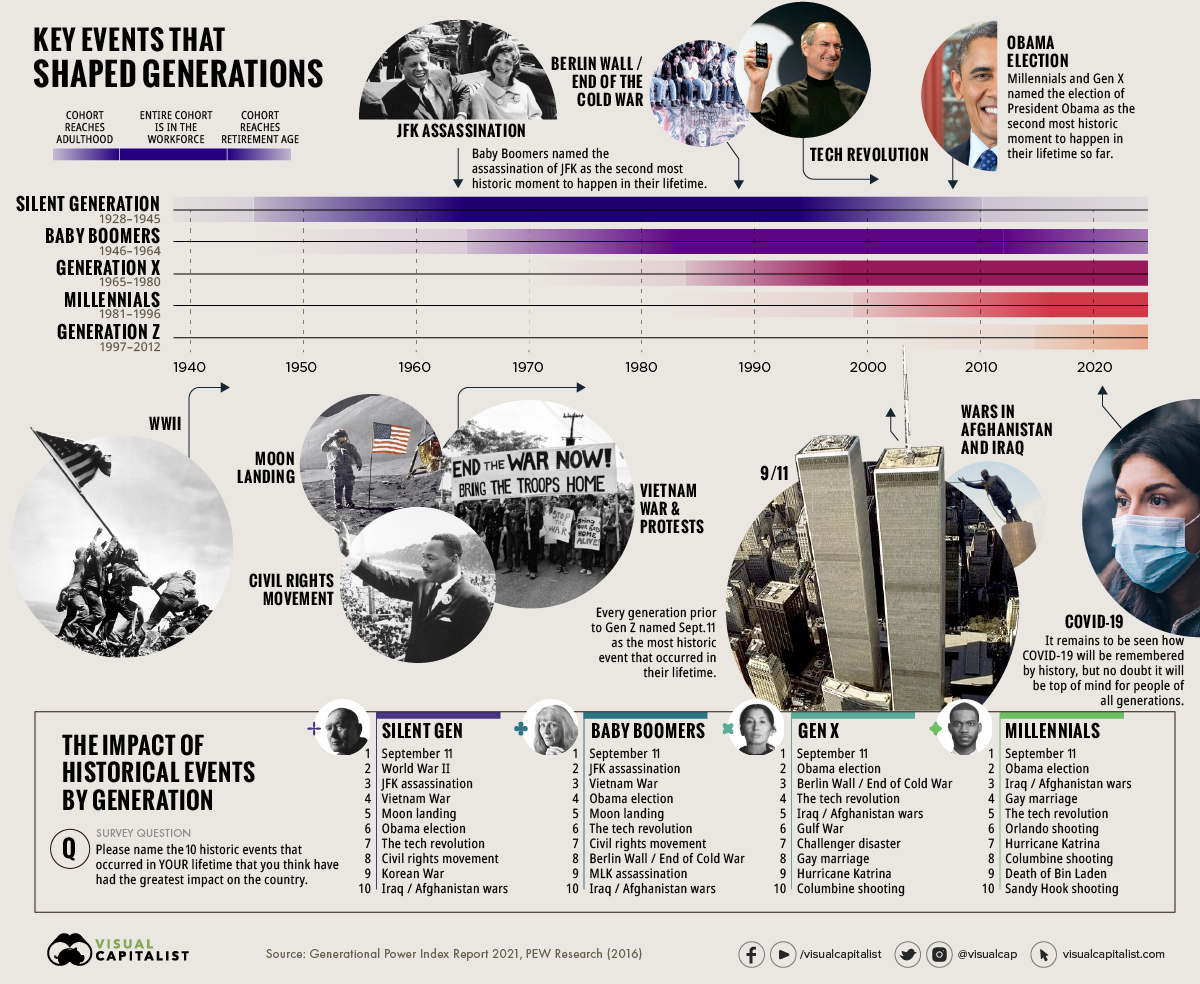


Key Events in U.S. History that Defined Generations
Looking back at history is a necessity when trying to understand what the future may hold.
Using insights from our Generational Power Index 2021 report, along with survey data from Pew Research in 2016, we identified some key milestones for each cohort, to understand how these events helped shape each generation’s unique perspectives.
Quick Context on Generational Definitions
Before diving in, it’s important to clarify which generations we’ve included in our research, along with their age and birth year ranges.
| Generation | Age range (years) | Birth year range |
|---|---|---|
| The Silent Generation | 76 and over | 1928-1945 |
| Baby Boomers | 57-75 | 1946-1964 |
| Gen X | 41-56 | 1965-1980 |
| Millennials | 25-40 | 1981-1996 |
| Gen Z | 9-24 | 1997-2012 |
| Gen Alpha | 8 and below | 2013-present |
These generational categories aren’t universal, but we went with the most widely cited definitions from reputable U.S. sources including the Pew Research and the U.S. Federal Reserve. It’s also worth noting that these generational definitions are somewhat specific to North America. For this reason, the focus is on U.S. historic events.
Defining Events: Silent Generation
The oldest members of the Silent Generation were 11 years old at the start of World War II, and were teenagers by the time it ended. In other words, their formative years fell smack dab in the middle of one of the biggest international conflicts in modern history.
Because of this, it makes sense that World War II ranks as the second most impactful event in their lifetimes, trailing only the far more recent Sept. 11 terrorist attacks (2001).
Most Impactful Historic Events, Silent Gen (Survey Results)
| Rank | Silent Gen | Survey % |
|---|---|---|
| #1 | Sept. 11 | 59% |
| #2 | WWII | 44% |
| #3 | JFK Assassination | 41% |
| #4 | Vietnam War | 37% |
| #5 | Moon landing | 29% |
| #6 | Obama election | 28% |
| #7 | The tech revolution | 27% |
| #8 | Civil rights movement | 18% |
| #9 | Korean War | 18% |
| #10 | Iraq/Afghanistan wars | 14% |
In fact, the Silent Generation cited four different wars on their list, more than any other cohort. For context, Boomers identified three conflicts (including the Cold War), while Millennials only referenced one (Iraq/Afghanistan).
Of course, other not-so-violent events made the list as well. And interestingly, some of these impressionable moments occurred later on in life.
For example, the youngest members of The Silent Generation were already in their mid-t0-late forties when cellphones became common in the ‘90s—yet, 27% identified the tech revolution as one of the top 10 most impactful events that happened in their lifetime.
Clearly, life never stops throwing you curve balls—no matter how far along you might be.
Most Notable Historical Events: Baby Boomers
Many of the historical experiences cited by Baby Boomers were related to war and violent acts. For instance, Boomers identified two assassinations on their list—John F. Kennedy’s in 1963, and Martin Luther King’s in 1968.
Most Impactful Historic Events, Boomers (Survey Results)
| Rank | Baby Boomers | Survey % |
|---|---|---|
| #1 | Sept. 11 | 70% |
| #2 | JFK Assassination | 45% |
| #3 | Vietnam War | 41% |
| #4 | Obama election | 38% |
| #5 | Moon landing | 35% |
| #6 | The tech revolution | 26% |
| #7 | Civil rights movement | 18% |
| #8 | Fall of Berlin Wall/end of Cold War | 16% |
| #9 | MLK assassination | 15% |
| #10 | Iraq/Afghanistan wars | 11% |
For this generation, the moon landing in 1969 made the cut, as did Barack Obama’s election win in 2008.
Baby Boomers only identified one event that was unique to their cohort (Martin Luther King’s death). It’s worth noting that responses varied between Americans of different racial backgrounds. Not surprisingly, Black Americans were far more likely to name MLK’s death as a top defining moment.
Most Notable Historical Events: Gen X
For Gen Xers, two unique events made their list: the Challenger disaster (1986) and the Gulf War (1991). Interestingly, neither of of these events stood out for other generations.
The Challenger disaster impact was widely felt because it involved civilians alongside astronauts, making the space shuttle’s explosion all the more notorious.
Most Impactful Historic Events, Gen Xers (Survey Results)
| Rank | Gen X | Survey % |
|---|---|---|
| #1 | Sept. 11 | 79% |
| #2 | Obama election | 40% |
| #3 | Fall of Berlin Wall/end of Cold War | 21% |
| #4 | The tech revolution | 20% |
| #5 | Iraq/Afghanistan wars | 18% |
| #6 | Gulf War | 15% |
| #7 | Challenger disaster | 14% |
| #8 | Gay marriage | 10% |
| #9 | Hurricane Katrina | 10% |
| #10 | Columbine shooting | 9% |
| #11 | Orlando shooting | 9% |
| #12 | Oklahoma City bombing | 9% |
Hurricane Katrina (which occurred in 2005) is the only natural disaster to make it on any of these lists. The hurricane—which caused a significant share of New Orleans’ population to resettle—left a lasting impression on the nation.
Most Notable Historical Events: Millennials
Millennials remember the September 11 attacks the most of all generations, with 86% citing it as their most influential event. They also paid close attention to the aftermath of this occurrence, as marked by the inclusion of both the Iraq/Afghanistan wars and the death of Osama Bin Laden among their most notable events.
Most Impactful Historic Events, Millennials (Survey Results)
| Rank | Millennials | Survey % |
|---|---|---|
| #1 | Sept.11 | 86% |
| #2 | Obama election | 47% |
| #3 | Iraq/Afghanistan wars | 24% |
| #4 | Gay marriage | 19% |
| #5 | The tech revolution | 18% |
| #6 | Orlando shooting | 17% |
| #7 | Hurricane Katrina | 11% |
| #8 | Columbine shooting | 10% |
| #9 | Bin Laden | 10% |
| #10 | Sandy Hook | 7% |
| #11 | Boston Marathon bombing | 7% |
| #12 | Great Recession | 7% |
Sadly, a lot of Millennials recollect instances of gun violence more than any other generation, from Orlando and Columbine to Sandy Hook.
Last but not least, Millennials are the only generation to note the Global Financial Crisis of 2008, and the subsequent Great Recession, as a momentous event. This makes sense considering many of them began their careers in its aftermath.
Gen Z and Younger
The Pew Research survey data was collected in 2016, so opinions on more recent events have not been collected.
That said, it could be premature to say in the short term which events will leave a lasting impression on generations, young and old.
According to the above data, the election of Barack Obama was a lasting milestone in recent history. Will the election of Donald Trump leave a similar impact? How will COVID-19 be regarded in the future? Time will tell which events will define future generations.
Moments, Movements, and Everything in Between
One key takeaway worth emphasizing is just how varied these formative events can be. Some were experienced as a single moment, while others were a culmination of shifts over several years.
It’s also clear that timing and duration are not the only determining factors behind an event’s influence on American society. For example, the moon landing was a tangible moment with a date stamp, whereas the tech revolution has a much fuzzier start (before exploding in significance alongside the Dotcom boom and bust).
Also interesting is what is absent from the top results. For example, the Global Financial Crisis of 2008 is barely referenced.
In short, a variety of impactful events and more gradual revolutions have made their mark on American society. Some have influenced specific generations, while others have transcended generational boundaries and unified the American public.
Download the Generational Power Report (.pdf)
For a full methodology of how we built the Generational Power Index, see pages 28-30 in the report PDF. This is the first year of the report, and any feedback is welcomed.


Demographics
The Countries That Have Become Sadder Since 2010
Tracking Gallup survey data for more than a decade reveals some countries are witnessing big happiness declines, reflecting their shifting socio-economic conditions.


The Countries That Have Become Sadder Since 2010
This was originally posted on our Voronoi app. Download the app for free on iOS or Android and discover incredible data-driven charts from a variety of trusted sources.
Can happiness be quantified?
Some approaches that try to answer this question make a distinction between two differing components of happiness: a daily experience part, and a more general life evaluation (which includes how people think about their life as a whole).
The World Happiness Report—first launched in 2012—has been making a serious go at quantifying happiness, by examining Gallup poll data that asks respondents in nearly every country to evaluate their life on a 0–10 scale. From this they extrapolate a single “happiness score” out of 10 to compare how happy (or unhappy) countries are.
More than a decade later, the 2024 World Happiness Report continues the mission. Its latest findings also include how some countries have become sadder in the intervening years.
Which Countries Have Become Unhappier Since 2010?
Afghanistan is the unhappiest country in the world right now, and is also 60% unhappier than over a decade ago, indicating how much life has worsened since 2010.
In 2021, the Taliban officially returned to power in Afghanistan, after nearly two decades of American occupation in the country. The Islamic fundamentalist group has made life harder, especially for women, who are restricted from pursuing higher education, travel, and work.
On a broader scale, the Afghan economy has suffered post-Taliban takeover, with various consequent effects: mass unemployment, a drop in income, malnutrition, and a crumbling healthcare system.
| Rank | Country | Happiness Score Loss (2010–24) | 2024 Happiness Score (out of 10) |
|---|---|---|---|
| 1 | 🇦🇫 Afghanistan | -2.6 | 1.7 |
| 2 | 🇱🇧 Lebanon | -2.3 | 2.7 |
| 3 | 🇯🇴 Jordan | -1.5 | 4.2 |
| 4 | 🇻🇪 Venezuela | -1.3 | 5.6 |
| 5 | 🇲🇼 Malawi | -1.2 | 3.4 |
| 6 | 🇿🇲 Zambia | -1.2 | 3.5 |
| 7 | 🇧🇼 Botswana | -1.2 | 3.4 |
| 8 | 🇾🇪 Yemen | -1.0 | 3.6 |
| 9 | 🇪🇬 Egypt | -1.0 | 4.0 |
| 10 | 🇮🇳 India | -0.9 | 4.1 |
| 11 | 🇧🇩 Bangladesh | -0.9 | 3.9 |
| 12 | 🇨🇩 DRC | -0.7 | 3.3 |
| 13 | 🇹🇳 Tunisia | -0.7 | 4.4 |
| 14 | 🇨🇦 Canada | -0.6 | 6.9 |
| 15 | 🇺🇸 U.S. | -0.6 | 6.7 |
| 16 | 🇨🇴 Colombia | -0.5 | 5.7 |
| 17 | 🇵🇦 Panama | -0.5 | 6.4 |
| 18 | 🇵🇰 Pakistan | -0.5 | 4.7 |
| 19 | 🇿🇼 Zimbabwe | -0.5 | 3.3 |
| 20 | 🇮🇪 Ireland | -0.5 | 6.8 |
| N/A | 🌍 World | +0.1 | 5.5 |
Nine countries in total saw their happiness score drop by a full point or more, on the 0–10 scale.
Noticeably, many of them have seen years of social and economic upheaval. Lebanon, for example, has been grappling with decades of corruption, and a severe liquidity crisis since 2019 that has resulted in a banking system collapse, sending poverty levels skyrocketing.
In Jordan, unprecedented population growth—from refugees leaving Iraq and Syria—has aggravated unemployment rates. A somewhat abrupt change in the line of succession has also raised concerns about political stability in the country.

-

 Education1 week ago
How Hard Is It to Get Into an Ivy League School?
-

 Technology2 weeks ago
Ranked: Semiconductor Companies by Industry Revenue Share
-

 Markets2 weeks ago
Ranked: The World’s Top Flight Routes, by Revenue
-

 Demographics2 weeks ago
Population Projections: The World’s 6 Largest Countries in 2075
-

 Markets2 weeks ago
The Top 10 States by Real GDP Growth in 2023
-

 Demographics2 weeks ago
The Smallest Gender Wage Gaps in OECD Countries
-

 Economy2 weeks ago
Where U.S. Inflation Hit the Hardest in March 2024
-

 Environment2 weeks ago
Top Countries By Forest Growth Since 2001