Demographics
Mapped: The Geography of Global Literacy
Article/Editing:
Mapped: The Geography of Global Literacy
Literacy is a fundamental building block that can lead to a strong education, the ability to solve complex problems, and gaining the skills and knowledge to participate meaningfully in society. As a result, it’s also an important facilitator of economic development.
However, it’s estimated that nearly 800 million adults around the world still lack basic literacy skills—and this can create ongoing drag on the economy.
In the U.S., as one example, the people with the lowest literacy scores are 16.5x more likely to receive financial aid from the government. At the same time, they are also more likely to be in the lowest earning wage group, earning less than $300 per week.
Today’s post uses charts from Our World in Data, and it shows what literacy looks like on a global scale, and how is it shifting from generation to generation.
Global Literacy: The Big Picture
Over the past two centuries, global literacy has seen steady growth.
In the year 1800, it’s estimated that a mere 12.1% of the world was able to read and write. The most recent data shows the numbers have actually flipped—and now just 13.8% of the global population is illiterate.
It’s clear that from a high level, progress towards global literacy is being made.
But at the same time, a look at the graph shows that in more recent years, the rate of change has been slowing as we reach the “last mile” of literacy.
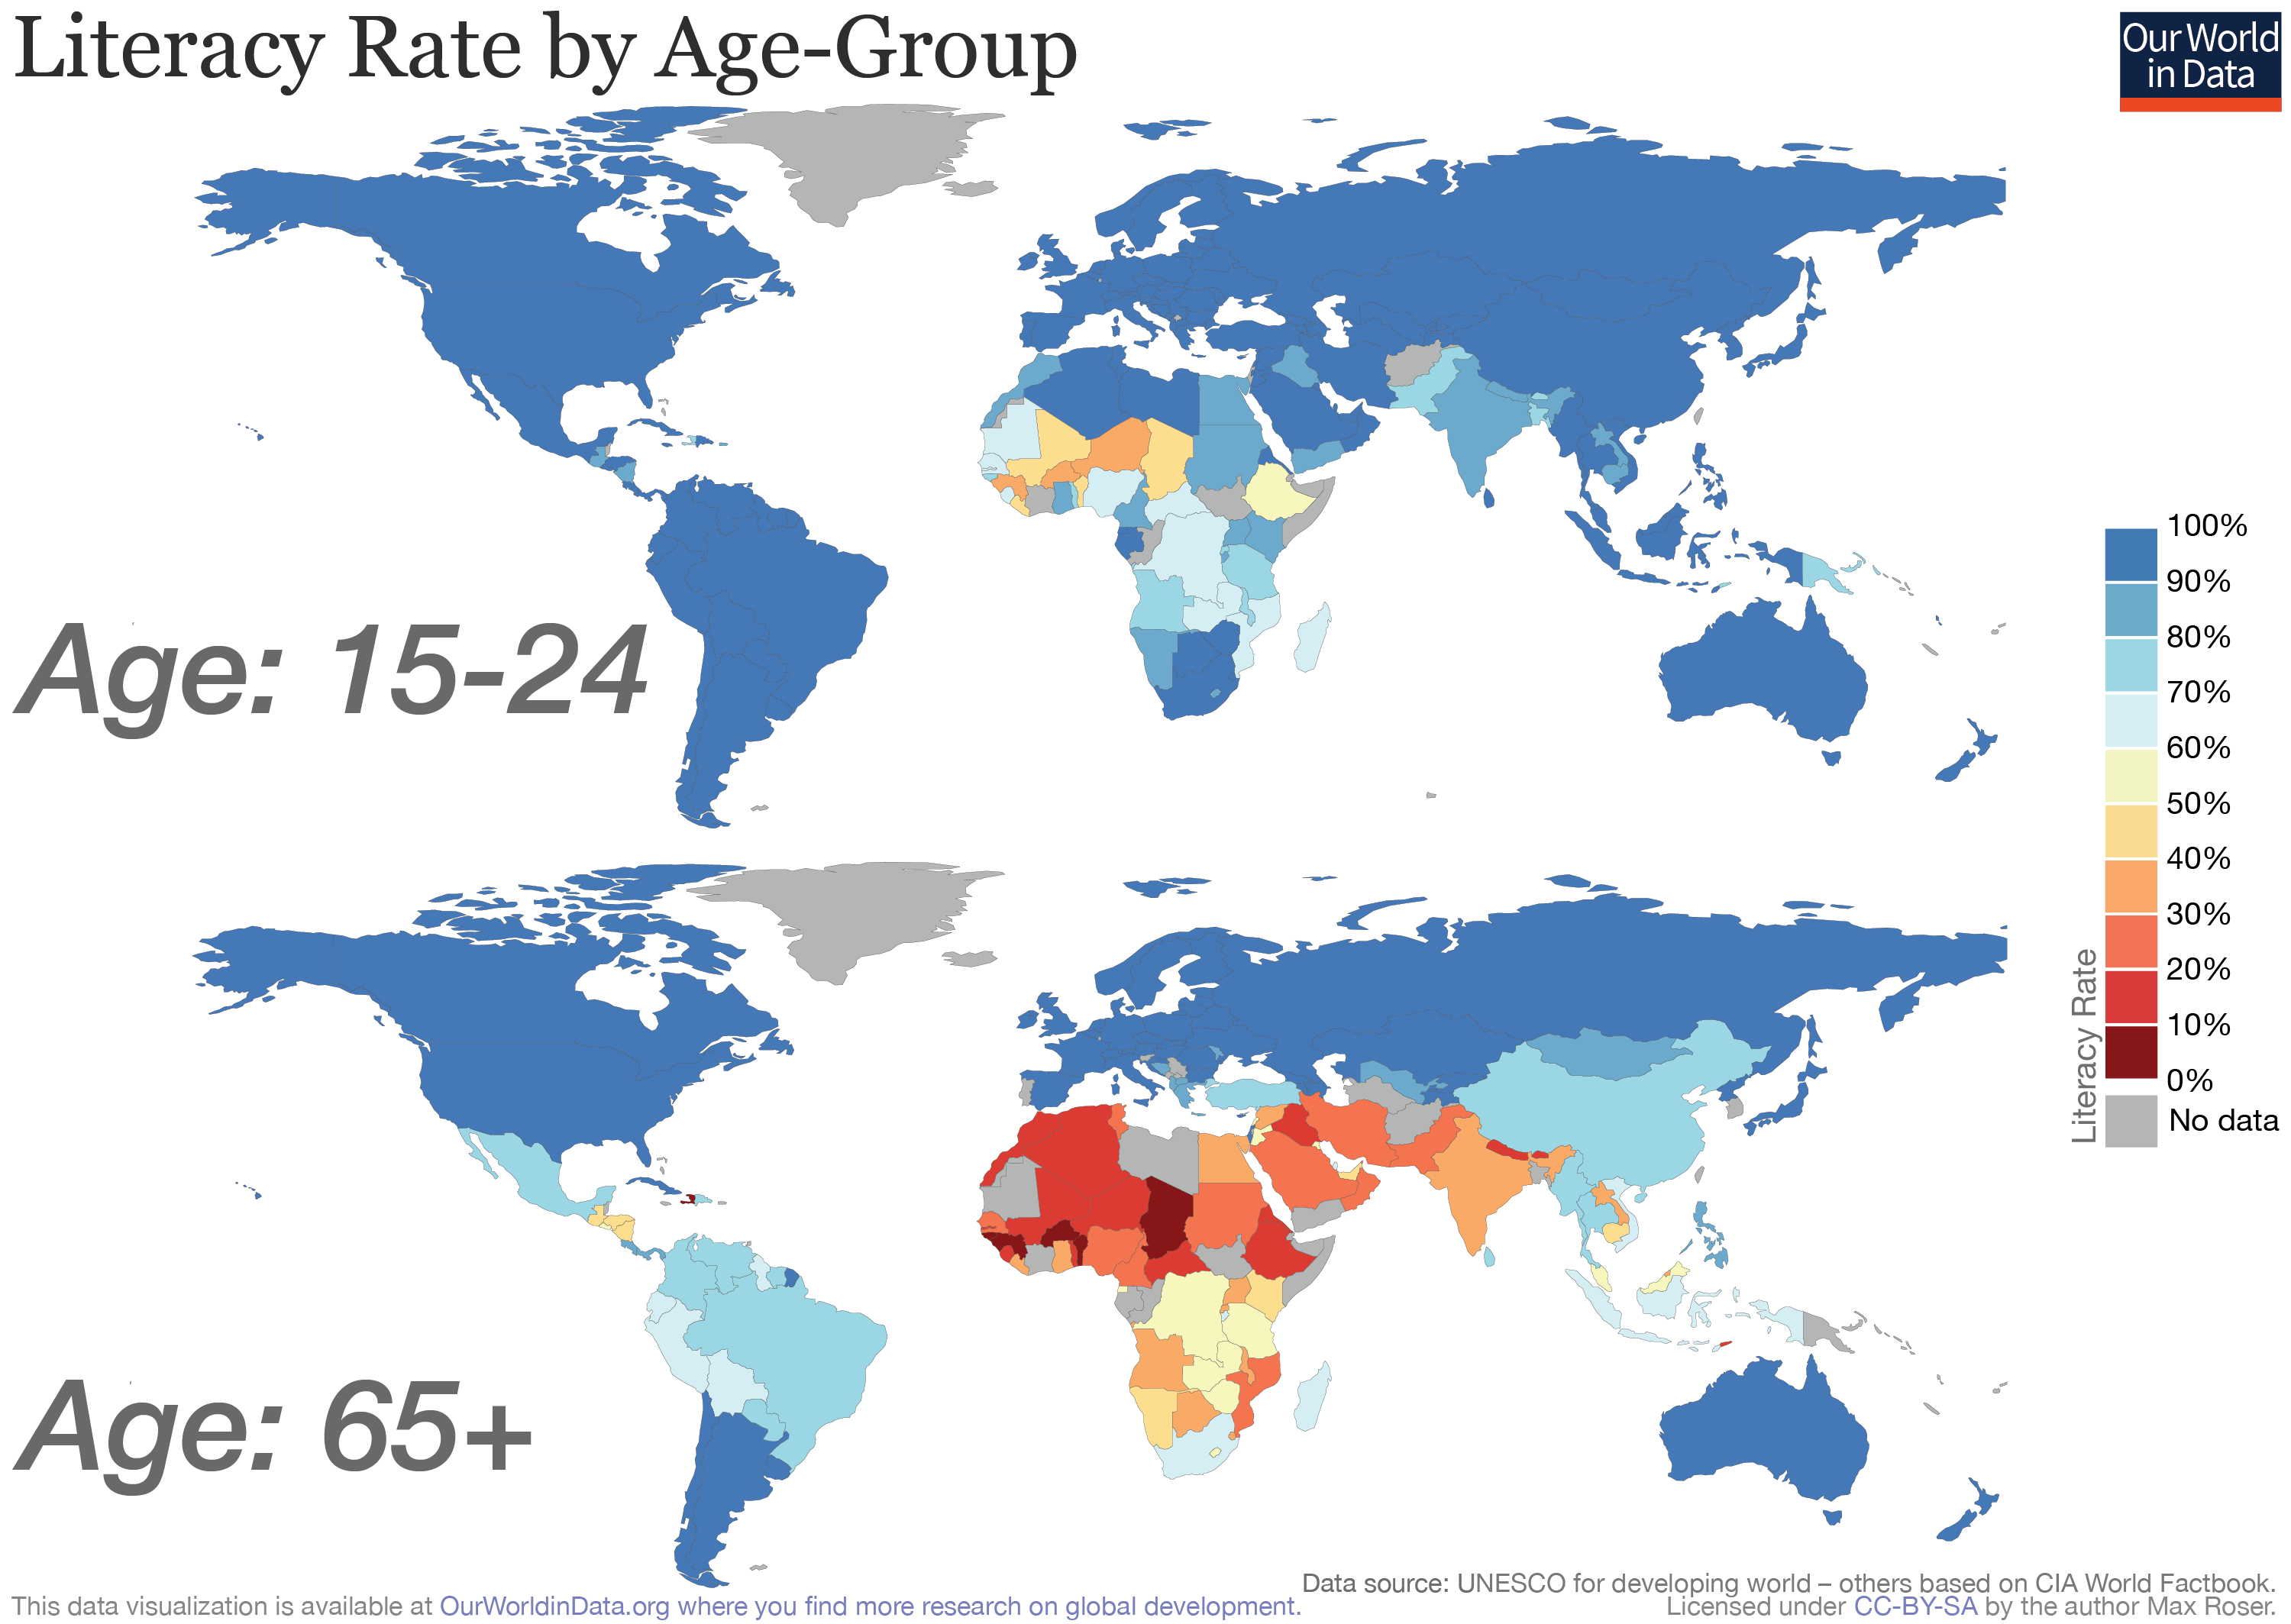
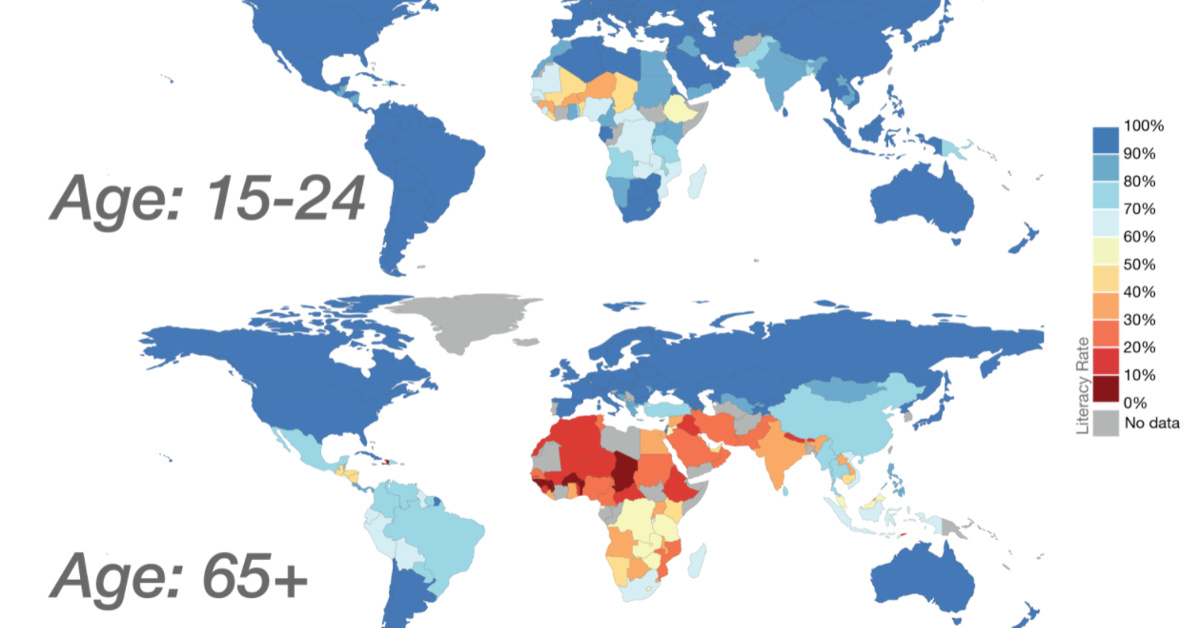
The Generational Perspective
Learning to read and write is easiest and most fruitful at a young age, and it’s a skill that is very unlikely to be lost later in life. For that reason, it’s worth looking at the difference between older and younger generations in terms of who is learning these skills.
For this, we zoom into the Middle East and Northern Africa region, which is where the majority of recent gains in literacy have been made:
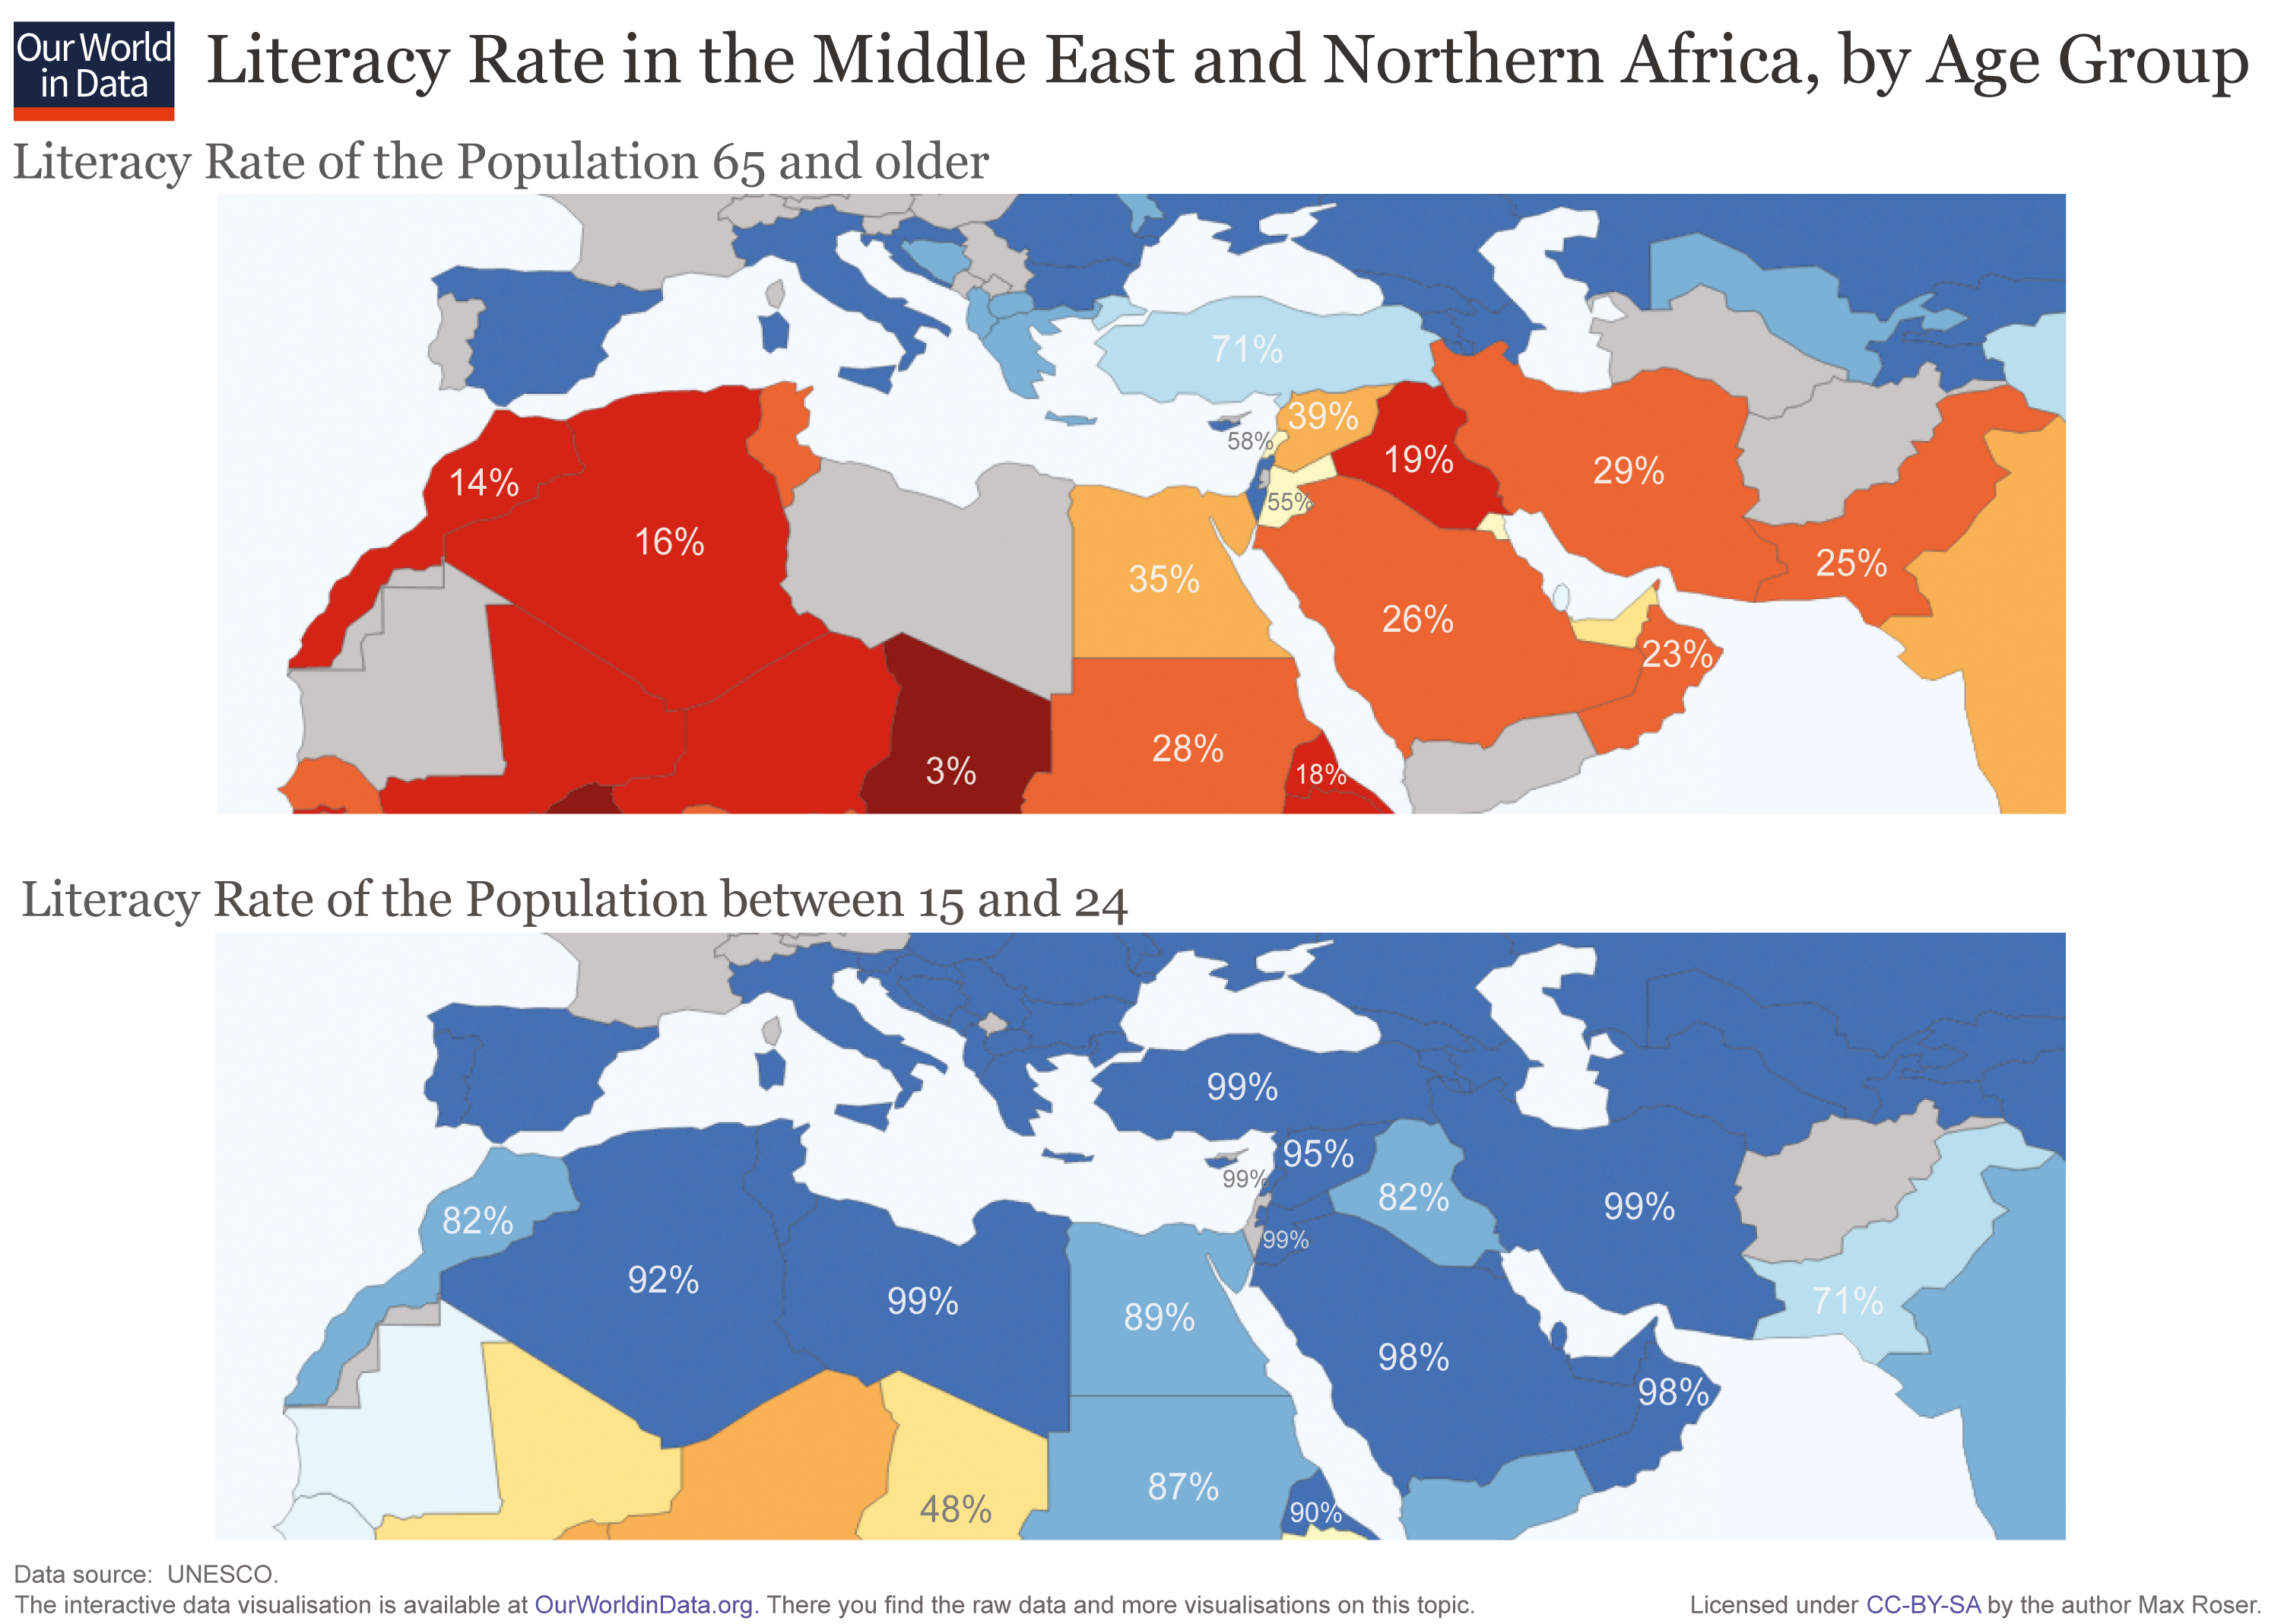
Here, the difference in literacy between the 15-24 year age group and those over 65 years is substantial, with countries seeing large, double-digit increases in the ability to read and write:
- 🇩🇿 Algeria
The literacy rate is at 92% for the 15-24 age group, compared to 16% of the oldest generation - 🇮🇷 Iran
99% of the 15-24 age group is literate, while 29% of the oldest generation can say the same - 🇴🇲 Oman
98% of those aged 15-24 are literate, compared to just 23% in the 65+ age group - 🇸🇦 Saudi Arabia
98% of those aged 15-24 can read and write, versus 26% of those in the oldest bracket - 🇪🇷 Eritrea
The literacy rate is at 90% for the 15-24 age group, and 18% for those in the 65+ age group
It’s not that surprising then, that the above countries all now sit in the 75-95% percent range for overall literacy—a number that will likely improve further as education systems continue to help younger generations become literate early in life.
The Literacy Opportunity
While some countries have seen obvious generational improvements in literacy, there are places in the world where changes to educational systems have not fully yet manifested yet, or perhaps the data is not yet available for.
According to the interactive map above, here are some places on each continent where progress must still be made:
- North America
Literacy rates: 🇭🇹 Haiti (61%), 🇬🇹 Guatemala (79%), 🇳🇮 Nicaragua (82%) - South America
Literacy rates: 🇬🇾 Guyana (88%) - Europe
Literacy rates: 🇽🇰 Kosovo (92%) - Asia
Literacy rates: 🇦🇫 Afghanistan (38%), 🇵🇰 Pakistan (56%), 🇧🇩 Bangladesh (61%), 🇾🇪 Yemen (70%) - Africa
Literacy rates: 🇳🇪 Niger (19%), 🇬🇳 Guinea (30%), 🇸🇸 South Sudan (32%), 🇲🇱 Mali (33%), 🇨🇫 Central African Republic (37%), 🇸🇴 Somalia (38%), 🇧🇯 Benin (38%) - Oceania
Literacy rates: 🇵🇬 Papua New Guinea (62%)
With many NGOs and educators focused on this problem, there is hope that the “last mile” of global literacy can be solved, leading to more economic opportunity in these places—and also the world itself as a whole.

This article was published as a part of Visual Capitalist's Creator Program, which features data-driven visuals from some of our favorite Creators around the world.


Demographics
The Countries That Have Become Sadder Since 2010
Tracking Gallup survey data for more than a decade reveals some countries are witnessing big happiness declines, reflecting their shifting socio-economic conditions.


The Countries That Have Become Sadder Since 2010
This was originally posted on our Voronoi app. Download the app for free on iOS or Android and discover incredible data-driven charts from a variety of trusted sources.
Can happiness be quantified?
Some approaches that try to answer this question make a distinction between two differing components of happiness: a daily experience part, and a more general life evaluation (which includes how people think about their life as a whole).
The World Happiness Report—first launched in 2012—has been making a serious go at quantifying happiness, by examining Gallup poll data that asks respondents in nearly every country to evaluate their life on a 0–10 scale. From this they extrapolate a single “happiness score” out of 10 to compare how happy (or unhappy) countries are.
More than a decade later, the 2024 World Happiness Report continues the mission. Its latest findings also include how some countries have become sadder in the intervening years.
Which Countries Have Become Unhappier Since 2010?
Afghanistan is the unhappiest country in the world right now, and is also 60% unhappier than over a decade ago, indicating how much life has worsened since 2010.
In 2021, the Taliban officially returned to power in Afghanistan, after nearly two decades of American occupation in the country. The Islamic fundamentalist group has made life harder, especially for women, who are restricted from pursuing higher education, travel, and work.
On a broader scale, the Afghan economy has suffered post-Taliban takeover, with various consequent effects: mass unemployment, a drop in income, malnutrition, and a crumbling healthcare system.
| Rank | Country | Happiness Score Loss (2010–24) | 2024 Happiness Score (out of 10) |
|---|---|---|---|
| 1 | 🇦🇫 Afghanistan | -2.6 | 1.7 |
| 2 | 🇱🇧 Lebanon | -2.3 | 2.7 |
| 3 | 🇯🇴 Jordan | -1.5 | 4.2 |
| 4 | 🇻🇪 Venezuela | -1.3 | 5.6 |
| 5 | 🇲🇼 Malawi | -1.2 | 3.4 |
| 6 | 🇿🇲 Zambia | -1.2 | 3.5 |
| 7 | 🇧🇼 Botswana | -1.2 | 3.4 |
| 8 | 🇾🇪 Yemen | -1.0 | 3.6 |
| 9 | 🇪🇬 Egypt | -1.0 | 4.0 |
| 10 | 🇮🇳 India | -0.9 | 4.1 |
| 11 | 🇧🇩 Bangladesh | -0.9 | 3.9 |
| 12 | 🇨🇩 DRC | -0.7 | 3.3 |
| 13 | 🇹🇳 Tunisia | -0.7 | 4.4 |
| 14 | 🇨🇦 Canada | -0.6 | 6.9 |
| 15 | 🇺🇸 U.S. | -0.6 | 6.7 |
| 16 | 🇨🇴 Colombia | -0.5 | 5.7 |
| 17 | 🇵🇦 Panama | -0.5 | 6.4 |
| 18 | 🇵🇰 Pakistan | -0.5 | 4.7 |
| 19 | 🇿🇼 Zimbabwe | -0.5 | 3.3 |
| 20 | 🇮🇪 Ireland | -0.5 | 6.8 |
| N/A | 🌍 World | +0.1 | 5.5 |
Nine countries in total saw their happiness score drop by a full point or more, on the 0–10 scale.
Noticeably, many of them have seen years of social and economic upheaval. Lebanon, for example, has been grappling with decades of corruption, and a severe liquidity crisis since 2019 that has resulted in a banking system collapse, sending poverty levels skyrocketing.
In Jordan, unprecedented population growth—from refugees leaving Iraq and Syria—has aggravated unemployment rates. A somewhat abrupt change in the line of succession has also raised concerns about political stability in the country.

-

 Energy1 week ago
The World’s Biggest Nuclear Energy Producers
-

 Money2 weeks ago
Which States Have the Highest Minimum Wage in America?
-

 Technology2 weeks ago
Ranked: Semiconductor Companies by Industry Revenue Share
-

 Markets2 weeks ago
Ranked: The World’s Top Flight Routes, by Revenue
-

 Countries2 weeks ago
Population Projections: The World’s 6 Largest Countries in 2075
-

 Markets2 weeks ago
The Top 10 States by Real GDP Growth in 2023
-

 Demographics2 weeks ago
The Smallest Gender Wage Gaps in OECD Countries
-

 United States2 weeks ago
Where U.S. Inflation Hit the Hardest in March 2024