Misc
24 Cognitive Biases That Are Warping Your Perception of Reality
We are each entitled to our own personal world view.
But unfortunately, when it comes to interpreting information and trying to make objective sense of reality, human brains are hard-wired to make all kinds of mental mistakes that can impact our ability to make rational judgments.
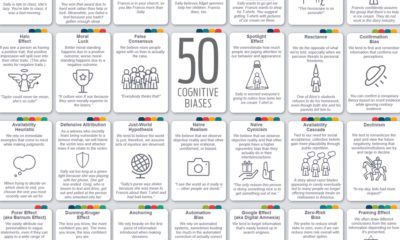
In total, there are over 180 cognitive biases that interfere with how we process data, think critically, and perceive reality.
Flawed Human Reasoning
There is no simple way to get around these basic human instincts, but one thing that we can do is understand the specific mistakes we make and why.
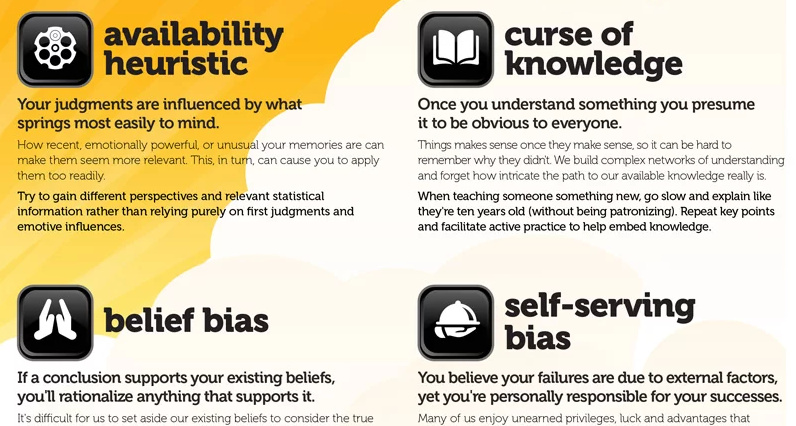
Today’s infographic comes to us from School of Thought, a non-profit dedicated to spreading critical thinking. The graphic describes 24 of the key biases that warp our sense of reality, providing useful examples along the way.

At the beginning of the infographic, you may have noticed illustrations of two gentlemen.
In case you were wondering, those happen to represent Daniel Kahneman and Amos Tversky, two of the leading social scientists known for their contributions to this field. Not only did they pioneer work around cognitive biases starting in the late 1960s, but their partnership also resulted in a Nobel Prize in Economics in 2002.
Biases Distorting Reality
Here are some of the biases we found most interesting from the list:
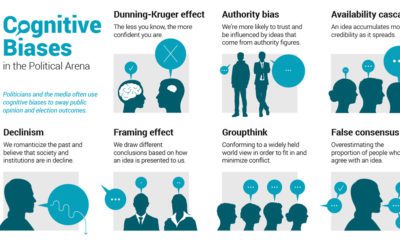
Declinism:
You remember the past as better than it was, and expect the future to be worse than it is likely to be. This is an interesting one, since statistically this is one of the most peaceful and prosperous times in history—yet the 24-hour news cycle rarely reflects this. (For a good example how the world is improving, see these six charts)
Just World Hypothesis:
Your preference for a just world makes you presume that it exists. Of course, it’s much more uncomfortable to think that the world is unfair, but by understanding this you will make more accurate judgments about people and situations.
Belief Bias
If a conclusion supports your existing beliefs, you’ll rationalize anything that supports it. In other words, instead of willingly looking at new information, we are primed to defend our own ideas without actually questioning them.
Framing Effect:
Context and delivery can have a big impact on how a story is interpreted. We must have the humility to recognize that we can be manipulated, and work to limit the effect that framing has on our critical thinking.
The Curse of Knowledge
Ever try to explain something you know intricately and have worked on for many years? It’s hard, because you’ve internalized everything you’ve learned, and now you forget how to explain it. This bias is similar—you know something inside and out, and what is obvious to you is not to others.
Reactance:
Sometimes we all get the urge to do the opposite of what we’re told. Nobody likes being constrained. The only problem is that when we’re in this situation, there is a tendency to overreact and to throw any logic out of the window.
Spotlight Effect:
Because we each live inside our own heads, our natural focus is on what we’re thinking and doing. We project this onto others, and we overestimate how much they notice about how we look or how we act.
Want to see more on cognitive biases? Here are 188 of them in one infographic.


VC+
VC+: Get Our Key Takeaways From the IMF’s World Economic Outlook
A sneak preview of the exclusive VC+ Special Dispatch—your shortcut to understanding IMF’s World Economic Outlook report.

Have you read IMF’s latest World Economic Outlook yet? At a daunting 202 pages, we don’t blame you if it’s still on your to-do list.
But don’t worry, you don’t need to read the whole April release, because we’ve already done the hard work for you.
To save you time and effort, the Visual Capitalist team has compiled a visual analysis of everything you need to know from the report—and our VC+ Special Dispatch is available exclusively to VC+ members. All you need to do is log into the VC+ Archive.
If you’re not already subscribed to VC+, make sure you sign up now to access the full analysis of the IMF report, and more (we release similar deep dives every week).
For now, here’s what VC+ members get to see.
Your Shortcut to Understanding IMF’s World Economic Outlook
With long and short-term growth prospects declining for many countries around the world, this Special Dispatch offers a visual analysis of the key figures and takeaways from the IMF’s report including:
- The global decline in economic growth forecasts
- Real GDP growth and inflation forecasts for major nations in 2024
- When interest rate cuts will happen and interest rate forecasts
- How debt-to-GDP ratios have changed since 2000
- And much more!

Get the Full Breakdown in the Next VC+ Special Dispatch
VC+ members can access the full Special Dispatch by logging into the VC+ Archive, where you can also check out previous releases.
Make sure you join VC+ now to see exclusive charts and the full analysis of key takeaways from IMF’s World Economic Outlook.
Don’t miss out. Become a VC+ member today.
What You Get When You Become a VC+ Member
VC+ is Visual Capitalist’s premium subscription. As a member, you’ll get the following:
- Special Dispatches: Deep dive visual briefings on crucial reports and global trends
- Markets This Month: A snappy summary of the state of the markets and what to look out for
- The Trendline: Weekly curation of the best visualizations from across the globe
- Global Forecast Series: Our flagship annual report that covers everything you need to know related to the economy, markets, geopolitics, and the latest tech trends
- VC+ Archive: Hundreds of previously released VC+ briefings and reports that you’ve been missing out on, all in one dedicated hub
You can get all of the above, and more, by joining VC+ today.

-

 Education1 week ago
How Hard Is It to Get Into an Ivy League School?
-

 Technology2 weeks ago
Ranked: Semiconductor Companies by Industry Revenue Share
-

 Markets2 weeks ago
Ranked: The World’s Top Flight Routes, by Revenue
-

 Demographics2 weeks ago
Population Projections: The World’s 6 Largest Countries in 2075
-

 Markets2 weeks ago
The Top 10 States by Real GDP Growth in 2023
-

 Demographics2 weeks ago
The Smallest Gender Wage Gaps in OECD Countries
-

 Economy2 weeks ago
Where U.S. Inflation Hit the Hardest in March 2024
-

 Environment2 weeks ago
Top Countries By Forest Growth Since 2001