Connect with us

Misc

Ranked: The 35 Vehicles With the Longest Production Runs

Published

on

vehicles with the longest production runs

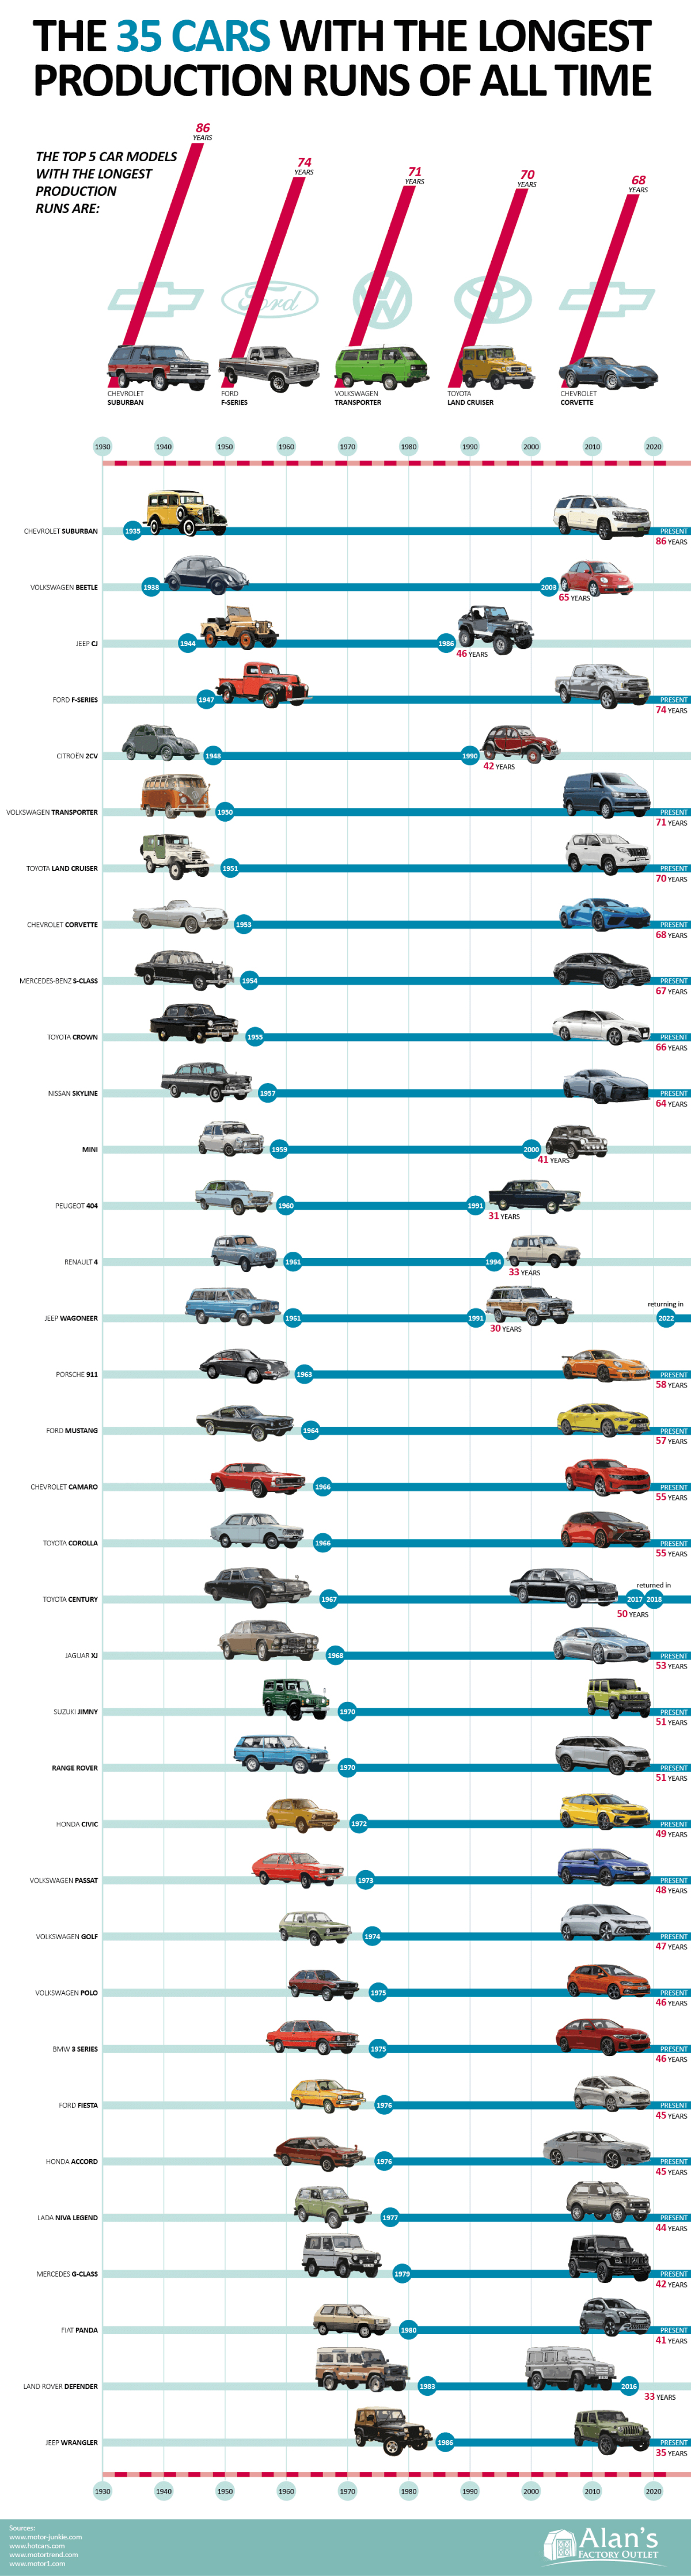
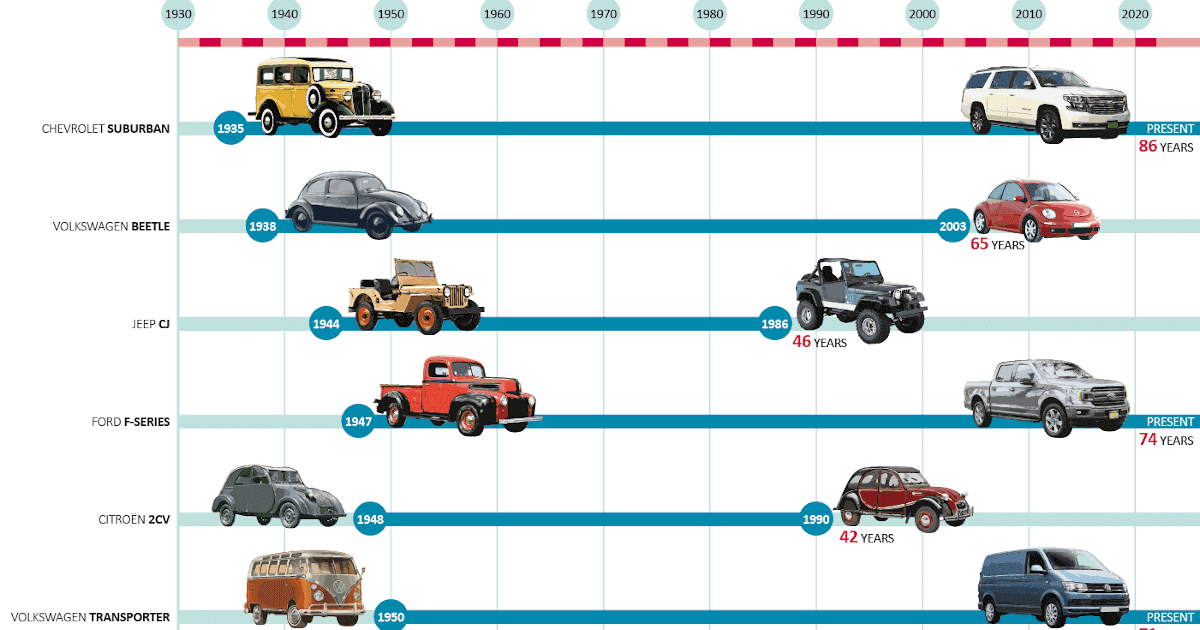
Visualizing the Longest Vehicle Production Runs

Over the automotive industryโ€™s 100+ year history, companies such as Ford, Chevrolet, and Mercedes-Benz have produced some truly iconic cars.

Whether theyโ€™re designed for excitement, luxury, or just simple transportation, these vehicles offer a set of features that make them highly desirable to consumers. The most successful models will undergo numerous revisions over time, sometimes sticking around for many decades.

To learn more, this graphic from Alanโ€™s Factory Outlet lists the 35 vehicles with the longest production runs of all time. Here are the top 10 below.

BrandModel NameClassProduction Run (years)
๐Ÿ‡บ๐Ÿ‡ธ ChevroletSuburbanSUV86
๐Ÿ‡บ๐Ÿ‡ธ FordF-SeriesPickup truck74
๐Ÿ‡ฉ๐Ÿ‡ช VolkswagenTransporterVan71
๐Ÿ‡ฏ๐Ÿ‡ต ToyotaLand CruiserSUV70
๐Ÿ‡บ๐Ÿ‡ธ ChevroletCorvetteSports car68
๐Ÿ‡ฉ๐Ÿ‡ช Mercedes-BenzS-ClassSedan67
๐Ÿ‡ฏ๐Ÿ‡ต ToyotaCrownSedan66
๐Ÿ‡ฏ๐Ÿ‡ต NissanSkylineSedan64
๐Ÿ‡ฌ๐Ÿ‡ง MiniMiniHatchback62
๐Ÿ‡ฉ๐Ÿ‡ช Porsche911Sports car58

As we can see, successful models come in many shapes and sizes, and from a variety of manufacturers. Below, we’ll take a deeper dive to learn more about what makes these cars special.

Ford F-Series

Ford began selling its first pickup truck in 1925, which was essentially a Model T with a flatbed in the rear. This layout was very useful because it enabled people to transport cargo, raw materials, and other items with relative ease.

Then, in 1948, Ford introduced the F-series pickup. The truck became one of Fordโ€™s most well-known and profitable models, and is currently in its 14th generation.

While the fundamental shape of the F-series hasnโ€™t changed, Fordโ€™s best-selling model owes much of its success to its constant innovation and technological improvements.

In 2015, the F-150 became the first fullsize pickup to feature an all-aluminum body. This reduced the truckโ€™s weight by as much as 500 pounds, resulting in better fuel economy and driving dynamics.

Ford is also credited with bringing turbocharged engines into the mainstream (within the pickup segment). This first-mover advantage gave the F-Series a competitive edge in terms of fuel efficiency and torque.

Chevrolet Corvette

First introduced in 1953, the Chevrolet Corvette is regarded as Americaโ€™s most iconic sports car. It has a reputation for offering similar performance as its more expensive foreign rivals, and combines unique styling elements with a successful motorsport background.

For most of its history, the Corvette was a rear-wheel drive coupe with a V-8 engine placed in the front. It also featured pop-up headlights for several generations, but the design was eventually phased out due to stricter regulations.

Evolution of the Corvette

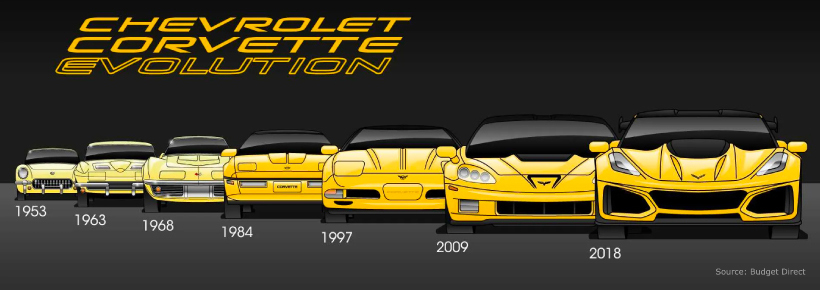
Chevrolet drastically changed the formula of the Corvette for its eighth generation, which launched in 2020. The engine is no longer in the front of the car, but instead, placed directly behind the occupants.

C8 interior cross section

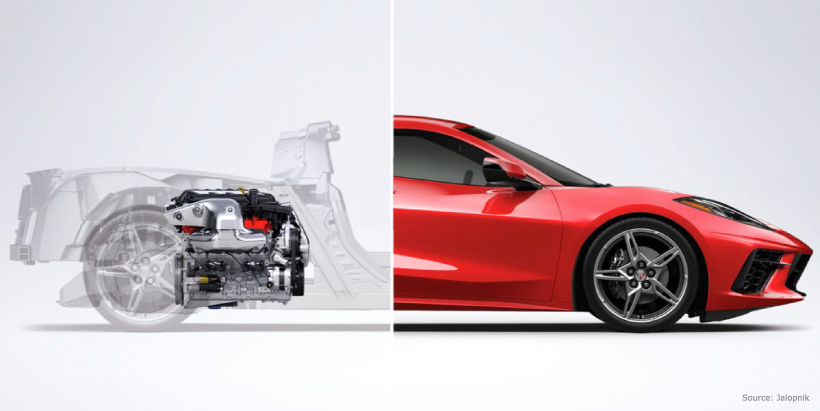
This mid-engine layout results in a Corvette with significantly different proportions than its predecessors. Because a bulk of the carโ€™s weight is now located more centrally, the C8 should (in theory) offer better traction and balance.

Few cars have undergone such large changes to their fundamental design philosophy, but the move appears to have workedโ€”production is far from meeting demand.

Mercedes-Benz S-Class

The S-Class from Mercedes is widely recognized as the global benchmark for full-size luxury sedans. Since its introduction in the 1950s, the S-Class has continuously introduced new innovations that improve comfort and safety.

  • The 1959 S-Class (dubbed W111) was the first production car with crumple zones front and rear. Crumple zones are structural elements that absorb the impact of a collision.
  • The 1978 S-Class (W116) introduced electronic anti-lock brakes (ABS). This system prevents tires from locking up under sudden braking and is included on every modern car.
  • The 1991 S-Class (W140) was the first car to feature double-glazed windows, which improves insulation while reducing road noise.
  • The 2021 S-Class (W223) introduced the worldโ€™s first rear-seat airbag.

One of the most important aspects of a luxury car is its interior, and the S-class has come a long way since its first iteration.

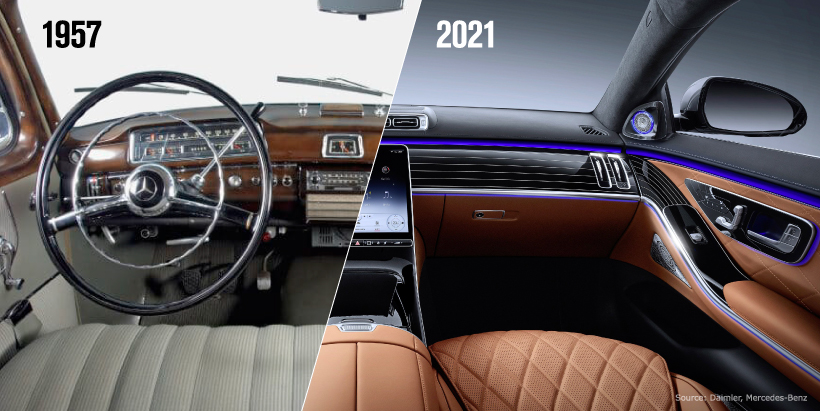
The interior of the latest S-Class features active ambient lighting that can visually reinforce any warnings generated by the carโ€™s driving assistance systems. The cabin also features MBUX Interior Assist, which can read motion commands (such as hand movements) by the driver.

The car’s center console is dominated by a single large screenโ€”a trend that was first introduced by the Tesla Model S.

Big Changes in Store

Global governments have announced a ban on the sale of new gasoline cars by as early as 2030. This foreshadows a great shift towards battery power and gives automakers the opportunity to reimagine their most iconic models.

For example, the Ford Mustang Mach-E is an all-electric SUV that borrows both the name and styling of the brandโ€™s famous pony car. The company also recently launched an electric version of the F-150, called the F-150 Lightning.

German brands are taking a different approach by creating a completely new range for their EV models. This includes the Audi e-tron, BMW i, and Mercedes EQ lineups. This implies that their existing gasoline-powered models could be coming to an end.

Subscribe to Visual Capitalist
Click for Comments

Economy

Interactive: Comparing Military Spend Around the World

Which countries have the highest military spend relative to their economy? This visual breaks down the amount spent in each country by GDP.

Published

on

A map showing countries' military spend as a percentage of their gross domestic product.

Comparing Military Spend Around the World

One of the easiest ways to identify a nationโ€™s priorities is by tracking its expenditures, and military spend is no different.

Usually spending is measured, and ranked, in absolute amounts. For example, countries around the world collectively spent $2.1 trillion on their militaries in 2021, with the most coming from the U.S. ($800 billion), China ($293 billion), and India ($77 billion).

But these eye-popping figures are best understood in the context of each country’s economy. Using data from the Stockholm International Peace Research Institute (SIPRI), Varun Jain has visualized 158 countries’ military expenditures, both as a percentage of their total GDP as well as in average per-capita spend.

Countriesโ€™ Military Spend as a Percentage of their Economy

To begin, Jain identified three categories of military expenditure as a percent of GDP, using the five-year (2018โ€’2022) average for more consistent data:

Military Spend% of GDPCountries
HighAbove 5%7
Medium2โ€’5%44
LowBelow 2%107

Under this categorization, the stand outs are the countries spending an outsized amount of their economic output on military, rather than the highest total spenders in absolute terms.

At the top of the table is Ukraine, which has earmarked a staggering average of 9.46% of its total economic output on defense over the past five years. That’s well ahead of second-place Saudi Arabia, which is slightly above 8%.

In Ukraine’s case, its high ranking shows how quickly priorities can change. From 2018 to 2021, the country spent 3.2-3.8% of its GDP on its military, but the outbreak of war with Russia saw its expenditures jump to one-third of economic output.

Other countries from the Middle East and North Africa follow in this tier, with Oman third at 8.11% and Qatar fourth with 5.88%. Rounding out the top seven high spenders are Algeria, Kuwait, and Israel.

RankCountryMilitary Spend% of GDP
1๐Ÿ‡บ๐Ÿ‡ฆ UkraineHigh9.46%
2๐Ÿ‡ธ๐Ÿ‡ฆ Saudi ArabiaHigh8.19%
3๐Ÿ‡ด๐Ÿ‡ฒ OmanHigh8.11%
4๐Ÿ‡ถ๐Ÿ‡ฆ QatarHigh5.88%
5๐Ÿ‡ฉ๐Ÿ‡ฟ AlgeriaHigh5.70%
6๐Ÿ‡ฐ๐Ÿ‡ผ KuwaitHigh5.66%
7๐Ÿ‡ฎ๐Ÿ‡ฑ IsraelHigh5.09%
8๐Ÿ‡ฏ๐Ÿ‡ด JordanMedium4.81%
9๐Ÿ‡ฆ๐Ÿ‡ฒ ArmeniaMedium4.53%
10๐Ÿ‡ฆ๐Ÿ‡ฟ AzerbaijanMedium4.53%
11๐Ÿ‡ฑ๐Ÿ‡ง LebanonMedium4.01%
12๐Ÿ‡ท๐Ÿ‡บ RussiaMedium3.98%
13๐Ÿ‡ง๐Ÿ‡ญ BahrainMedium3.79%
14๐Ÿ‡ต๐Ÿ‡ฐ PakistanMedium3.75%
15๐Ÿ‡ฒ๐Ÿ‡ฆ MoroccoMedium3.72%
16๐Ÿ‡บ๐Ÿ‡ฟ UzbekistanMedium3.56%
17๐Ÿ‡บ๐Ÿ‡ธ U.S.Medium3.48%
18๐Ÿ‡จ๐Ÿ‡ด ColombiaMedium3.24%
19๐Ÿ‡ฌ๐Ÿ‡ท GreeceMedium3.15%
20๐Ÿ‡ณ๐Ÿ‡ฆ NamibiaMedium3.09%
21๐Ÿ‡ง๐Ÿ‡ณ BruneiMedium3.09%
22๐Ÿ‡ธ๐Ÿ‡ธ South SudanMedium3.05%
23๐Ÿ‡น๐Ÿ‡ฌ TogoMedium3.03%
24๐Ÿ‡ฒ๐Ÿ‡ฑ MaliMedium2.90%
25๐Ÿ‡จ๐Ÿ‡บ CubaMedium2.88%
26๐Ÿ‡ธ๐Ÿ‡ฌ SingaporeMedium2.86%
27๐Ÿ‡ง๐Ÿ‡ผ BotswanaMedium2.86%
28๐Ÿ‡ฒ๐Ÿ‡ฒ MyanmarMedium2.76%
29๐Ÿ‡ง๐Ÿ‡ซ Burkina FasoMedium2.70%
30๐Ÿ‡ฎ๐Ÿ‡ถ IraqMedium2.69%
31๐Ÿ‡ฐ๐Ÿ‡ท South KoreaMedium2.69%
32๐Ÿ‡จ๐Ÿ‡ฌ Republic of CongoMedium2.68%
33๐Ÿ‡น๐Ÿ‡ฉ ChadMedium2.66%
34๐Ÿ‡ฎ๐Ÿ‡ณ IndiaMedium2.58%
35๐Ÿ‡น๐Ÿ‡ณ TunisiaMedium2.58%
36๐Ÿ‡ช๐Ÿ‡จ EcuadorMedium2.34%
37๐Ÿ‡ฎ๐Ÿ‡ท IranMedium2.32%
38๐Ÿ‡ป๐Ÿ‡ณ Viet NamMedium2.28%
39๐Ÿ‡ฐ๐Ÿ‡ญ CambodiaMedium2.26%
40๐Ÿ‡ฒ๐Ÿ‡ท MauritaniaMedium2.24%
41๐Ÿ‡ณ๐Ÿ‡ช NigerMedium2.21%
42๐Ÿ‡ง๐Ÿ‡ฎ BurundiMedium2.21%
43๐Ÿ‡น๐Ÿ‡ท TurkeyMedium2.19%
44๐Ÿ‡ต๐Ÿ‡ฑ PolandMedium2.17%
45๐Ÿ‡ฑ๐Ÿ‡ป LatviaMedium2.14%
46๐Ÿ‡ฑ๐Ÿ‡น LithuaniaMedium2.13%
47๐Ÿ‡ช๐Ÿ‡ช EstoniaMedium2.13%
48๐Ÿ‡ฌ๐Ÿ‡ง United KingdomMedium2.12%
49๐Ÿ‡บ๐Ÿ‡พ UruguayMedium2.11%
50๐Ÿ‡ท๐Ÿ‡ธ SerbiaMedium2.06%
51๐Ÿ‡บ๐Ÿ‡ฌ UgandaMedium2.02%
52๐Ÿ‡ญ๐Ÿ‡ท CroatiaLow1.97%
53๐Ÿ‡ฆ๐Ÿ‡บ AustraliaLow1.93%
54๐Ÿ‡จ๐Ÿ‡ฑ ChileLow1.92%
55๐Ÿ‡ซ๐Ÿ‡ท FranceLow1.91%
56๐Ÿ‡จ๐Ÿ‡พ CyprusLow1.90%
57๐Ÿ‡ท๐Ÿ‡ด RomaniaLow1.87%
58๐Ÿ‡ง๐Ÿ‡ฌ BulgariaLow1.85%
59๐Ÿ‡ธ๐Ÿ‡ฟ EswatiniLow1.82%
60๐Ÿ‡ณ๐Ÿ‡ด NorwayLow1.81%
61๐Ÿ‡จ๐Ÿ‡ซ Central African RepublicLow1.78%
62๐Ÿ‡ฑ๐Ÿ‡ฐ Sri LankaLow1.77%
63๐Ÿ‡ต๐Ÿ‡น PortugalLow1.77%
64๐Ÿ‡น๐Ÿ‡ผ TaiwanLow1.76%
65๐Ÿ‡จ๐Ÿ‡ณ ChinaLow1.72%
66๐Ÿ‡ฌ๐Ÿ‡ช GeorgiaLow1.71%
67๐Ÿ‡ธ๐Ÿ‡ฐ SlovakiaLow1.67%
68๐Ÿ‡ฌ๐Ÿ‡ผ Guinea-BissauLow1.65%
69๐Ÿ‡ฐ๐Ÿ‡ฌ KyrgyzstanLow1.62%
70๐Ÿ‡ฌ๐Ÿ‡ณ GuineaLow1.61%
71๐Ÿ‡ซ๐Ÿ‡ฎ FinlandLow1.60%
72๐Ÿ‡ธ๐Ÿ‡ณ SenegalLow1.58%
73๐Ÿ‡ญ๐Ÿ‡ณ HondurasLow1.56%
74๐Ÿ‡ฌ๐Ÿ‡ฆ GabonLow1.56%
75๐Ÿ‡ฒ๐Ÿ‡ฟ MozambiqueLow1.56%
76๐Ÿ‡ฑ๐Ÿ‡ธ LesothoLow1.56%
77๐Ÿ‡ฒ๐Ÿ‡ช MontenegroLow1.54%
78๐Ÿ‡ซ๐Ÿ‡ฏ FijiLow1.54%
79๐Ÿ‡ฏ๐Ÿ‡ฒ JamaicaLow1.49%
80๐Ÿ‡ฆ๐Ÿ‡ด AngolaLow1.48%
81๐Ÿ‡ฎ๐Ÿ‡น ItalyLow1.48%
82๐Ÿ‡ญ๐Ÿ‡บ HungaryLow1.48%
83๐Ÿ‡ง๐Ÿ‡ด BoliviaLow1.46%
84๐Ÿ‡ธ๐Ÿ‡จ SeychellesLow1.43%
85๐Ÿ‡ณ๐Ÿ‡ฑ NetherlandsLow1.41%
86๐Ÿ‡ธ๐Ÿ‡ฉ SudanLow1.39%
87๐Ÿ‡ท๐Ÿ‡ผ RwandaLow1.39%
88๐Ÿ‡ณ๐Ÿ‡ต NepalLow1.36%
89๐Ÿ‡ฉ๐Ÿ‡ฐ DenmarkLow1.36%
90๐Ÿ‡ฆ๐Ÿ‡ฑ AlbaniaLow1.34%
91๐Ÿ‡ช๐Ÿ‡ธ SpainLow1.34%
92๐Ÿ‡น๐Ÿ‡ญ ThailandLow1.33%
93๐Ÿ‡ฆ๐Ÿ‡ซ AfghanistanLow1.33%
94๐Ÿ‡ณ๐Ÿ‡ฟ New ZealandLow1.32%
95๐Ÿ‡จ๐Ÿ‡ฆ CanadaLow1.32%
96๐Ÿ‡ฉ๐Ÿ‡ช GermanyLow1.31%
97๐Ÿ‡ฒ๐Ÿ‡ฐ North MacedoniaLow1.30%
98๐Ÿ‡ง๐Ÿ‡ท BrazilLow1.29%
99๐Ÿ‡ง๐Ÿ‡ฟ BelizeLow1.28%
100๐Ÿ‡ธ๐Ÿ‡ป El SalvadorLow1.28%
101๐Ÿ‡ง๐Ÿ‡ฉ BangladeshLow1.26%
102๐Ÿ‡ฟ๐Ÿ‡ฒ ZambiaLow1.25%
103๐Ÿ‡ฌ๐Ÿ‡ถ Equatorial GuineaLow1.24%
104๐Ÿ‡ฌ๐Ÿ‡พ GuyanaLow1.22%
105๐Ÿ‡จ๐Ÿ‡ฎ Cote d'IvoireLow1.22%
106๐Ÿ‡ช๐Ÿ‡ฌ EgyptLow1.20%
107๐Ÿ‡ต๐Ÿ‡ช PeruLow1.20%
108๐Ÿ‡ง๐Ÿ‡พ BelarusLow1.18%
109๐Ÿ‡ธ๐Ÿ‡ช SwedenLow1.17%
110๐Ÿ‡ฐ๐Ÿ‡ช KenyaLow1.13%
111๐Ÿ‡ธ๐Ÿ‡ฎ SloveniaLow1.10%
112๐Ÿ‡น๐Ÿ‡ฑ Timor LesteLow1.08%
113๐Ÿ‡น๐Ÿ‡ฟ TanzaniaLow1.05%
114๐Ÿ‡จ๐Ÿ‡ฒ CameroonLow1.04%
115๐Ÿ‡น๐Ÿ‡ฏ TajikistanLow1.03%
116๐Ÿ‡ฏ๐Ÿ‡ต JapanLow1.03%
117๐Ÿ‡ง๐Ÿ‡ช BelgiumLow1.02%
118๐Ÿ‡ฑ๐Ÿ‡ท LiberiaLow1.00%
119๐Ÿ‡ฒ๐Ÿ‡พ MalaysiaLow0.98%
120๐Ÿ‡ต๐Ÿ‡ญ PhilippinesLow0.96%
121๐Ÿ‡ต๐Ÿ‡พ ParaguayLow0.95%
122๐Ÿ‡ฝ๐Ÿ‡ฐ KosovoLow0.95%
123๐Ÿ‡ฟ๐Ÿ‡ฆ South AfricaLow0.94%
124๐Ÿ‡ฒ๐Ÿ‡ผ MalawiLow0.92%
125๐Ÿ‡ง๐Ÿ‡ฆ Bosnia and HerzegovinaLow0.84%
126๐Ÿ‡ฐ๐Ÿ‡ฟ KazakhstanLow0.83%
127๐Ÿ‡ฆ๐Ÿ‡น AustriaLow0.78%
128๐Ÿ‡ฌ๐Ÿ‡ฒ GambiaLow0.76%
129๐Ÿ‡น๐Ÿ‡น Trinidad & TobagoLow0.75%
130๐Ÿ‡ฎ๐Ÿ‡ฉ IndonesiaLow0.74%
131๐Ÿ‡จ๐Ÿ‡ญ SwitzerlandLow0.73%
132๐Ÿ‡จ๐Ÿ‡ฟ Czech RepublicLow0.71%
133๐Ÿ‡ฉ๐Ÿ‡ด Dominican RepublicLow0.70%
134๐Ÿ‡ฒ๐Ÿ‡ณ MongoliaLow0.69%
135๐Ÿ‡ฒ๐Ÿ‡ฌ MadagascarLow0.68%
136๐Ÿ‡จ๐Ÿ‡ฉ Dem. Rep. of CongoLow0.64%
137๐Ÿ‡ณ๐Ÿ‡ฌ NigeriaLow0.64%
138๐Ÿ‡ช๐Ÿ‡น EthiopiaLow0.64%
139๐Ÿ‡ธ๐Ÿ‡ฑ Sierra LeoneLow0.64%
140๐Ÿ‡ฆ๐Ÿ‡ท ArgentinaLow0.63%
141๐Ÿ‡ฑ๐Ÿ‡บ LuxembourgLow0.61%
142๐Ÿ‡ฒ๐Ÿ‡ฝ MexicoLow0.61%
143๐Ÿ‡ณ๐Ÿ‡ฎ NicaraguaLow0.60%
144๐Ÿ‡จ๐Ÿ‡ป Cape VerdeLow0.54%
145๐Ÿ‡ง๐Ÿ‡ฏ BeninLow0.54%
146๐Ÿ‡ฒ๐Ÿ‡น MaltaLow0.48%
147๐Ÿ‡ฌ๐Ÿ‡น GuatemalaLow0.45%
148๐Ÿ‡ฌ๐Ÿ‡ญ GhanaLow0.43%
149๐Ÿ‡ต๐Ÿ‡ฌ Papua New GuineaLow0.38%
150๐Ÿ‡ฒ๐Ÿ‡ฉ MoldovaLow0.36%
151๐Ÿ‡ฎ๐Ÿ‡ช IrelandLow0.27%
152๐Ÿ‡ฟ๐Ÿ‡ผ ZimbabweLow0.26%
153๐Ÿ‡ป๐Ÿ‡ช VenezuelaLow0.20%
154๐Ÿ‡ญ๐Ÿ‡น HaitiLow0.17%
155๐Ÿ‡ฒ๐Ÿ‡บ MauritiusLow0.16%
156๐Ÿ‡จ๐Ÿ‡ท Costa RicaLow0.00%
157๐Ÿ‡ฎ๐Ÿ‡ธ IcelandLow0.00%
158๐Ÿ‡ต๐Ÿ‡ฆ PanamaLow0.00%

The medium group consists of 44 countries and is led by four nations (Jordan, Armenia, Azerbaijan, and Lebanon) that all spend more than 4% of their GDP on their militaries. Other familiar countries known to have large military budgets, like Russia, Pakistan, the U.S., India and the UK, are also in this category.

The low spend group has a total of 107 countries, but also contains some surprises. For example, China, France, and Germanyโ€”all in the top 10 countries by absolute military spendโ€”actually have similar amounts of military spend as a percent of GDP as Georgia, Cyprus, and North Macedonia respectively.

At the bottom of the table are countries with either low military importance, or strange technicalities. For example, Mauritius is one of the countries with the lowest military budgets because it doesn’t officially have a standing military, instead relying on two paramilitary forces (a special mobile force and a Coast Guard).

Similarly, Iceland allocates 0% of its GDP towards military spending. In place of a standing army, the country maintains a specialized peacekeeping force, a substantial Coast Guard, and relies on security alliances within NATO, of which it is a member and provides financial support to.

Ranking Defense Spending Per Capita

While the measure above equalizes military spend on economic strength, per-capita military spending shows how much countries allocate while accounting for population size.

On a per-capita basis (again using a five-year average), Qatar leads the ranks with a per-capita spend of $4,564, well-ahead of Israel at $2,535, and Saudi Arabia at $1,928.

RankCountryPer Capita Spend ($)
1๐Ÿ‡ถ๐Ÿ‡ฆ Qatar$4,564
2๐Ÿ‡ฎ๐Ÿ‡ฑ Israel$2,535
3๐Ÿ‡ธ๐Ÿ‡ฆ Saudi Arabia$1,928
4๐Ÿ‡ธ๐Ÿ‡ฌ Singapore$1,837
5๐Ÿ‡ฐ๐Ÿ‡ผ Kuwait$1,815
6๐Ÿ‡บ๐Ÿ‡ธ U.S.$1,815
7๐Ÿ‡ณ๐Ÿ‡ด Norway$1,438
8๐Ÿ‡ด๐Ÿ‡ฒ Oman$1,254
9๐Ÿ‡ฆ๐Ÿ‡บ Australia$1,131
10๐Ÿ‡ง๐Ÿ‡ณ Brunei$959
11๐Ÿ‡ฌ๐Ÿ‡ง UK$913
12๐Ÿ‡ฐ๐Ÿ‡ท South Korea$894
13๐Ÿ‡ง๐Ÿ‡ญ Bahrain$863
14๐Ÿ‡ฉ๐Ÿ‡ฐ Denmark$861
15๐Ÿ‡ซ๐Ÿ‡ท France$811
16๐Ÿ‡ซ๐Ÿ‡ฎ Finland$801
17๐Ÿ‡ณ๐Ÿ‡ฑ Netherlands$765
18๐Ÿ‡ฑ๐Ÿ‡บ Luxembourg$694
19๐Ÿ‡ธ๐Ÿ‡ช Sweden$662
20๐Ÿ‡จ๐Ÿ‡ญ Switzerland$647
21๐Ÿ‡จ๐Ÿ‡ฆ Canada$645
22๐Ÿ‡ฌ๐Ÿ‡ท Greece$629
23๐Ÿ‡ฉ๐Ÿ‡ช Germany$623
24๐Ÿ‡ณ๐Ÿ‡ฟ New Zealand$610
25๐Ÿ‡ช๐Ÿ‡ช Estonia$535
26๐Ÿ‡น๐Ÿ‡ผ Taiwan$495
27๐Ÿ‡ฎ๐Ÿ‡น Italy$494
28๐Ÿ‡ง๐Ÿ‡ช Belgium$487
29๐Ÿ‡ท๐Ÿ‡บ Russia$467
30๐Ÿ‡ฑ๐Ÿ‡น Lithuania$463
31๐Ÿ‡ต๐Ÿ‡น Portugal$417
32๐Ÿ‡ฑ๐Ÿ‡ป Latvia$405
33๐Ÿ‡จ๐Ÿ‡พ Cyprus$399
34๐Ÿ‡ฏ๐Ÿ‡ต Japan$398
35๐Ÿ‡ช๐Ÿ‡ธ Spain$395
36๐Ÿ‡ฆ๐Ÿ‡น Austria$393
37๐Ÿ‡ต๐Ÿ‡ฑ Poland$359
38๐Ÿ‡บ๐Ÿ‡พ Uruguay$354
39๐Ÿ‡ธ๐Ÿ‡ฐ Slovakia$334
40๐Ÿ‡ฑ๐Ÿ‡ง Lebanon$334
41๐Ÿ‡ธ๐Ÿ‡ฎ Slovenia$302
42๐Ÿ‡บ๐Ÿ‡ฆ Ukraine$302
43๐Ÿ‡ญ๐Ÿ‡ท Croatia$294
44๐Ÿ‡จ๐Ÿ‡ฑ Chile$292
45๐Ÿ‡ท๐Ÿ‡ด Romania$258
46๐Ÿ‡ญ๐Ÿ‡บ Hungary$248
47๐Ÿ‡ฎ๐Ÿ‡ช Ireland$235
48๐Ÿ‡ธ๐Ÿ‡จ Seychelles$230
49๐Ÿ‡ฆ๐Ÿ‡ฟ Azerbaijan$226
50๐Ÿ‡ฉ๐Ÿ‡ฟ Algeria$219
51๐Ÿ‡ฆ๐Ÿ‡ฒ Armenia$217
52๐Ÿ‡ง๐Ÿ‡ผ Botswana$215
53๐Ÿ‡ฏ๐Ÿ‡ด Jordan$207
54๐Ÿ‡น๐Ÿ‡ท Turkey$199
55๐Ÿ‡จ๐Ÿ‡ด Colombia$197
56๐Ÿ‡ง๐Ÿ‡ฌ Bulgaria$194
57๐Ÿ‡จ๐Ÿ‡ณ China$183
58๐Ÿ‡ฒ๐Ÿ‡น Malta$175
59๐Ÿ‡จ๐Ÿ‡ฟ Czech Republic$175
60๐Ÿ‡ฎ๐Ÿ‡ท Iran$169
61๐Ÿ‡ณ๐Ÿ‡ฆ Namibia$159
62๐Ÿ‡ฎ๐Ÿ‡ถ Iraq$145
63๐Ÿ‡ช๐Ÿ‡จ Ecuador$138
64๐Ÿ‡ฒ๐Ÿ‡ช Montenegro$137
65๐Ÿ‡ท๐Ÿ‡ธ Serbia$133
66๐Ÿ‡น๐Ÿ‡น Trinidad & Tobago$131
67๐Ÿ‡ฌ๐Ÿ‡ฆ Gabon$124
68๐Ÿ‡ฒ๐Ÿ‡ฆ Morocco$122
69๐Ÿ‡ฌ๐Ÿ‡ถ Equatorial Guinea$112
70๐Ÿ‡ฒ๐Ÿ‡พ Malaysia$109
71๐Ÿ‡ง๐Ÿ‡ท Brazil$107
72๐Ÿ‡น๐Ÿ‡ญ Thailand$97
73๐Ÿ‡ฌ๐Ÿ‡พ Guyana$92
74๐Ÿ‡น๐Ÿ‡ณ Tunisia$91
75๐Ÿ‡ซ๐Ÿ‡ฏ Fiji$83
76๐Ÿ‡ฒ๐Ÿ‡ฐ North Macedonia$83
77๐Ÿ‡ฐ๐Ÿ‡ฟ Kazakhstan$82
78๐Ÿ‡ต๐Ÿ‡ช Peru$81
79๐Ÿ‡ฌ๐Ÿ‡ช Georgia$80
80๐Ÿ‡ง๐Ÿ‡พ Belarus$80
81๐Ÿ‡ฏ๐Ÿ‡ฒ Jamaica$77
82๐Ÿ‡ฆ๐Ÿ‡ฑ Albania$76
83๐Ÿ‡ธ๐Ÿ‡ฟ Eswatini$72
84๐Ÿ‡ฑ๐Ÿ‡ฐ Sri Lanka$69
85๐Ÿ‡ฆ๐Ÿ‡ท Argentina$66
86๐Ÿ‡ง๐Ÿ‡ฟ Belize$60
87๐Ÿ‡ฒ๐Ÿ‡ฝ Mexico$59
88๐Ÿ‡ฉ๐Ÿ‡ด Dominican Republic$58
89๐Ÿ‡ป๐Ÿ‡ณ Viet Nam$58
90๐Ÿ‡ฟ๐Ÿ‡ฆ South Africa$56
91๐Ÿ‡ธ๐Ÿ‡ป El Salvador$54
92๐Ÿ‡ง๐Ÿ‡ฆ Bosnia and Herzegovina$54
93๐Ÿ‡ฎ๐Ÿ‡ณ India$53
94๐Ÿ‡จ๐Ÿ‡ฌ Republic of Congo$53
95๐Ÿ‡ต๐Ÿ‡พ Paraguay$52
96๐Ÿ‡ง๐Ÿ‡ด Bolivia$51
97๐Ÿ‡ต๐Ÿ‡ฐ Pakistan$49
98๐Ÿ‡บ๐Ÿ‡ฟ Uzbekistan$44
99๐Ÿ‡ฆ๐Ÿ‡ด Angola$43
100๐Ÿ‡ฝ๐Ÿ‡ฐ Kosovo$42
101๐Ÿ‡ฒ๐Ÿ‡ท Mauritania$42
102๐Ÿ‡ญ๐Ÿ‡ณ Honduras$42
103๐Ÿ‡ช๐Ÿ‡ฌ Egypt$41
104๐Ÿ‡ฐ๐Ÿ‡ญ Cambodia$36
105๐Ÿ‡ฒ๐Ÿ‡ฒ Myanmar$35
106๐Ÿ‡ต๐Ÿ‡ญ Philippines$33
107๐Ÿ‡ฒ๐Ÿ‡ณ Mongolia$33
108๐Ÿ‡ฎ๐Ÿ‡ฉ Indonesia$31
109๐Ÿ‡ง๐Ÿ‡ฉ Bangladesh$27
110๐Ÿ‡น๐Ÿ‡ฑ Timor Leste$27
111๐Ÿ‡ฒ๐Ÿ‡ฑ Mali$26
112๐Ÿ‡ธ๐Ÿ‡ณ Senegal$24
113๐Ÿ‡จ๐Ÿ‡ฎ Cote d'Ivoire$23
114๐Ÿ‡น๐Ÿ‡ฌ Togo$21
115๐Ÿ‡ฐ๐Ÿ‡ช Kenya$21
116๐Ÿ‡ฐ๐Ÿ‡ฌ Kyrgyzstan$20
117๐Ÿ‡ง๐Ÿ‡ซ Burkina Faso$20
118๐Ÿ‡ฌ๐Ÿ‡ณ Guinea$19
119๐Ÿ‡ฑ๐Ÿ‡ธ Lesotho$19
120๐Ÿ‡จ๐Ÿ‡ป Cape Verde$19
121๐Ÿ‡ฌ๐Ÿ‡น Guatemala$19
122๐Ÿ‡น๐Ÿ‡ฉ Chad$18
123๐Ÿ‡ธ๐Ÿ‡ธ South Sudan$18
124๐Ÿ‡ธ๐Ÿ‡ฉ Sudan$18
125๐Ÿ‡บ๐Ÿ‡ฌ Uganda$18
126๐Ÿ‡ฟ๐Ÿ‡ผ Zimbabwe$17
127๐Ÿ‡ฟ๐Ÿ‡ฒ Zambia$16
128๐Ÿ‡ฒ๐Ÿ‡บ Mauritius$16
129๐Ÿ‡จ๐Ÿ‡ฒ Cameroon$16
130๐Ÿ‡ณ๐Ÿ‡ต Nepal$15
131๐Ÿ‡ณ๐Ÿ‡ฌ Nigeria$14
132๐Ÿ‡ณ๐Ÿ‡ฎ Nicaragua$12
133๐Ÿ‡ฌ๐Ÿ‡ผ Guinea-Bissau$12
134๐Ÿ‡น๐Ÿ‡ฟ Tanzania$12
135๐Ÿ‡จ๐Ÿ‡บ Cuba$11
136๐Ÿ‡ท๐Ÿ‡ผ Rwanda$11
137๐Ÿ‡ฒ๐Ÿ‡ฉ Moldova$11
138๐Ÿ‡ต๐Ÿ‡ฌ Papua New Guinea$10
139๐Ÿ‡ณ๐Ÿ‡ช Niger$10
140๐Ÿ‡น๐Ÿ‡ฏ Tajikistan$9
141๐Ÿ‡จ๐Ÿ‡ซ Central African Republic$8
142๐Ÿ‡ฒ๐Ÿ‡ฟ Mozambique$8
143๐Ÿ‡ฌ๐Ÿ‡ญ Ghana$8
144๐Ÿ‡ง๐Ÿ‡ฏ Benin$7
145๐Ÿ‡ง๐Ÿ‡ฎ Burundi$7
146๐Ÿ‡ฆ๐Ÿ‡ซ Afghanistan$6
147๐Ÿ‡ฌ๐Ÿ‡ฒ Gambia$6
148๐Ÿ‡ช๐Ÿ‡น Ethiopia$5
149๐Ÿ‡ป๐Ÿ‡ช Venezuela$5
150๐Ÿ‡ฒ๐Ÿ‡ผ Malawi$4
151๐Ÿ‡ธ๐Ÿ‡ฑ Sierra Leone$3
152๐Ÿ‡ฒ๐Ÿ‡ฌ Madagascar$3
153๐Ÿ‡จ๐Ÿ‡ฉ Dem. Rep. of Congo$3
154๐Ÿ‡ฑ๐Ÿ‡ท Liberia$3
155๐Ÿ‡ญ๐Ÿ‡น Haiti$2
156๐Ÿ‡จ๐Ÿ‡ท Costa Rica$0
157๐Ÿ‡ฎ๐Ÿ‡ธ Iceland$0
158๐Ÿ‡ต๐Ÿ‡ฆ Panama$0

Measured this way, we get a perspective of how small defense budgets can be per person, even if the total expenditure is large.

For example, India has the fourth-highest total defense expenditure in 2022, but because of its massive population only sets aside $53 per resident for its military, putting it solidly at the bottom third of the per-capita rankings.

Patterns Revealed By Measuring Military Spend

Changing how we look at a countryโ€™s military budget can reveal a lot more than just looking at absolute numbers.

For example, the Middle East is the region with the highest spenders on defense as a percentage of their GDP, giving us insight into regional security concerns.

Countries from the medium group of military spendingโ€”including parts of Eastern Europe, sub-Saharan Africa, and South Asiaโ€”highlight past or recent conflict zones between neighbors, countries with internal strife, or countries wary of a regional aggressor. Ukraine’s average per capita military spend, for example, was just $122.4 from 2018 to 2021. The next year, it jumped nearly 10 times to $1,018.66 per person after Russia’s invasion.

In fact, European military spending saw its sharpest one-year jump in 30 years as a direct result of the war.

Alongside European anxieties, ongoing tension between China and Taiwan has also contributed to increased military spending in Asia and Oceania. Will these budgets continue their dramatic ascent or will they rise evenly alongside their relative economies in 2023?

Data note: For these comparisons, the creator is calculating five-year averages (using data from 2018-2022) for military spending as a percentage of GDP and per-capita military spending for each country. The military expenditure data is pulled from Stockholm International Peace Research Institute.

Data for some countries is missing or may vary significantly from official figures. Countries with up to
two years of missing data had averages calculated on the years available, while countries with three or more years of missing data have been removed from this dataset, including: Djibouti, Eritrea, North Korea, Laos, Libya, Somalia, Syria, Turkmenistan, UAE, and Yemen.

Please see SIPRI’s methodologies page for more details on how they collect their data and create estimates.

Continue Reading

Subscribe

Popular