Misc
How Has Car Safety Improved Over 60 Years?


How Has Car Safety Improved Over 60 Years?
Did you know that in 2019, there were 6.7 million car accidents in the U.S. alone?
This resulted in 36,096 deaths over the year—an awful statistic to say the least—but one that would be much worse if it weren’t for seatbelts, airbags, and other modern safety devices.
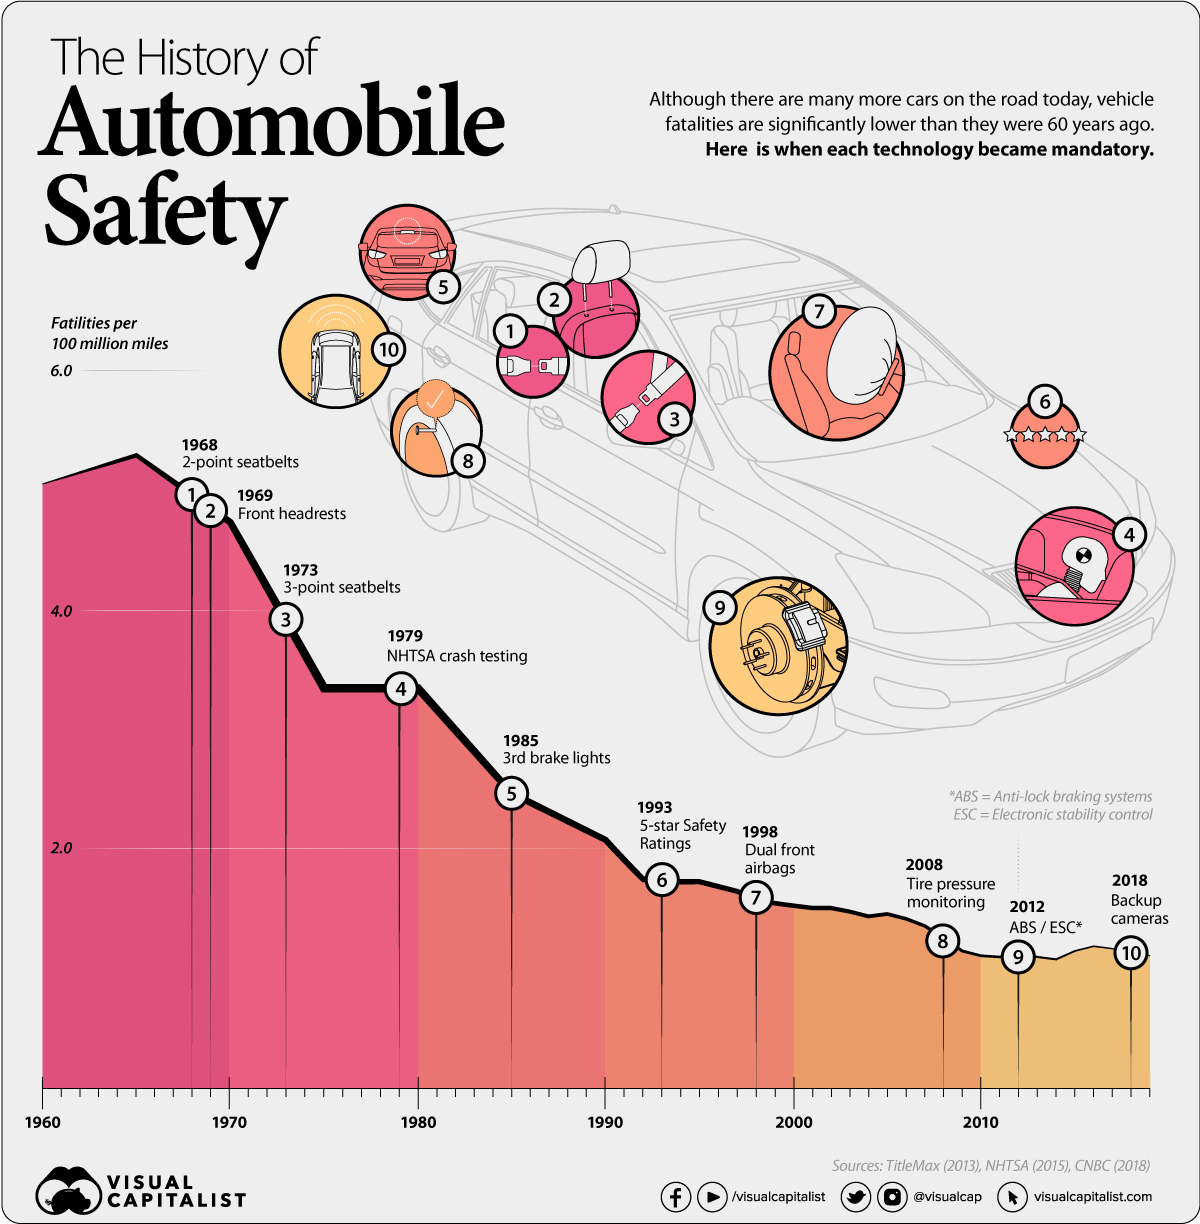
In this infographic, we’ve visualized data from the U.S. Bureau of Transportation to show how breakthroughs in car safety have drastically reduced the number of motor vehicle fatalities.
Measuring Safety Improvements
The data shows the number of fatalities for every 100 million miles driven. From a high of 5.1 in 1960 (the first year data is available), we can see that this metric has fallen by 78% to just 1.1.
| Year | Fatilities per 100 million miles |
|---|---|
| 1960 | 5.1 |
| 1970 | 4.7 |
| 1980 | 3.4 |
| 1990 | 2.1 |
| 2000 | 1.5 |
| 2010 | 1.1 |
| 2019 | 1.1 |
What makes this even more impressive is the fact that there are more cars on the road today than in 1960. This can be measured by the total number of miles driven each year.
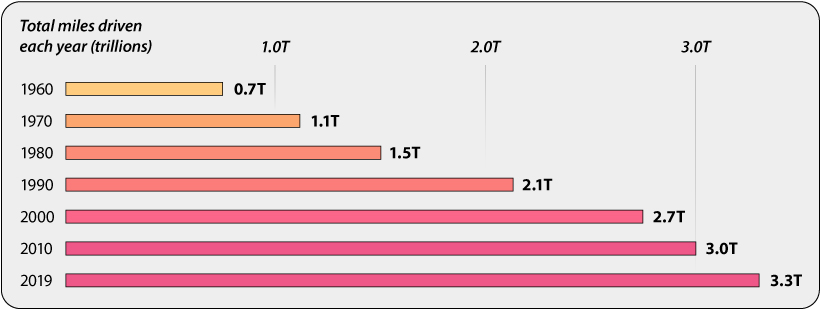
So, while the total number of miles driven has increased by 371%, the rate of fatalities has decreased by 78%. Below, we’ll take a closer look at some important car safety innovations.
1. The Seatbelt
The introduction of seatbelts was a major stepping stone for improving car safety, especially as vehicles became capable of higher speeds.
The first iteration of seatbelts were a 2-point design because they only looped across a person’s waist (and thus had 2 points of mounting). This design is flawed because it doesn’t hold our upper body in place during a collision.
Today’s seatbelts use a 3-point design which was developed in 1959 by Nils Bohlin, an engineer at Volvo. This design adds a shoulder belt that holds our torso in place during a collision. It took many years for Volvo to not only develop the device, but also to convince the public to use it. The U.S., for instance, did not mandate 3-point seatbelts until 1973.
2. The Airbag
The concept of an airbag is relatively simple—rather than smacking our face against the steering wheel, we cushion the blow with an inflatable pillow.
In practice, however, airbags need to be very precise because it takes just 50 milliseconds for our heads to collide with the wheel in a frontal crash. To inflate in such a short period of time, airbags rely on a chemical reaction using sodium azide.
The design of an airbag’s internal mechanism can also cause issues, as was discovered during the Takata airbag recall. As these airbags inflated, there was a chance for them to also send metal shards flying through the cabin at high speeds.
Dual front airbags (one for each side) were mandated by the U.S. government in 1998. Today, many cars offer side curtain airbags as an option, but these are not required by law.
3. The Backup Camera
Backup cameras became a legal requirement in May 2018, making them one of the newest pieces of standard safety equipment in the U.S. These cameras are designed to reduce the number of backover crashes involving objects, pedestrians, or other cars.
Measuring the safety benefits of backup cameras can be tricky, but a 2014 study did conclude that cameras were useful for preventing collisions. A common criticism of backup cameras is that they limit our field of vision, as opposed to simply turning our heads to face the rear.
Taking Car Safety to the Next Level
According to the National Highway Traffic Safety Administration (NHTSA), having both seatbelts and airbags can reduce the chance of death from a head-on collision by 61%. That’s a big reduction, but there’s still plenty of room left on the table for further improvements.
As a result, automakers have been equipping their cars with many technology-enabled safety measures. This includes pre-collision assist systems which use sensors and cameras to help prevent an accident. These systems can prevent you from drifting into another lane (by actually adjusting the steering wheel), or apply the brakes to mitigate an imminent frontal collision.
Whether these systems have any meaningful benefit remains to be seen. Referring to the table above shows that fatalities per 100 million miles have not fallen any further since 2010.


VC+
VC+: Get Our Key Takeaways From the IMF’s World Economic Outlook
A sneak preview of the exclusive VC+ Special Dispatch—your shortcut to understanding IMF’s World Economic Outlook report.

Have you read IMF’s latest World Economic Outlook yet? At a daunting 202 pages, we don’t blame you if it’s still on your to-do list.
But don’t worry, you don’t need to read the whole April release, because we’ve already done the hard work for you.
To save you time and effort, the Visual Capitalist team has compiled a visual analysis of everything you need to know from the report—and our VC+ Special Dispatch is available exclusively to VC+ members. All you need to do is log into the VC+ Archive.
If you’re not already subscribed to VC+, make sure you sign up now to access the full analysis of the IMF report, and more (we release similar deep dives every week).
For now, here’s what VC+ members get to see.
Your Shortcut to Understanding IMF’s World Economic Outlook
With long and short-term growth prospects declining for many countries around the world, this Special Dispatch offers a visual analysis of the key figures and takeaways from the IMF’s report including:
- The global decline in economic growth forecasts
- Real GDP growth and inflation forecasts for major nations in 2024
- When interest rate cuts will happen and interest rate forecasts
- How debt-to-GDP ratios have changed since 2000
- And much more!

Get the Full Breakdown in the Next VC+ Special Dispatch
VC+ members can access the full Special Dispatch by logging into the VC+ Archive, where you can also check out previous releases.
Make sure you join VC+ now to see exclusive charts and the full analysis of key takeaways from IMF’s World Economic Outlook.
Don’t miss out. Become a VC+ member today.
What You Get When You Become a VC+ Member
VC+ is Visual Capitalist’s premium subscription. As a member, you’ll get the following:
- Special Dispatches: Deep dive visual briefings on crucial reports and global trends
- Markets This Month: A snappy summary of the state of the markets and what to look out for
- The Trendline: Weekly curation of the best visualizations from across the globe
- Global Forecast Series: Our flagship annual report that covers everything you need to know related to the economy, markets, geopolitics, and the latest tech trends
- VC+ Archive: Hundreds of previously released VC+ briefings and reports that you’ve been missing out on, all in one dedicated hub
You can get all of the above, and more, by joining VC+ today.

-

 Mining1 week ago
Gold vs. S&P 500: Which Has Grown More Over Five Years?
-

 Markets2 weeks ago
Ranked: The Most Valuable Housing Markets in America
-

 Money2 weeks ago
Which States Have the Highest Minimum Wage in America?
-

 AI2 weeks ago
Ranked: Semiconductor Companies by Industry Revenue Share
-

 Markets2 weeks ago
Ranked: The World’s Top Flight Routes, by Revenue
-

 Countries2 weeks ago
Population Projections: The World’s 6 Largest Countries in 2075
-

 Markets2 weeks ago
The Top 10 States by Real GDP Growth in 2023
-

 Demographics2 weeks ago
The Smallest Gender Wage Gaps in OECD Countries