Politics
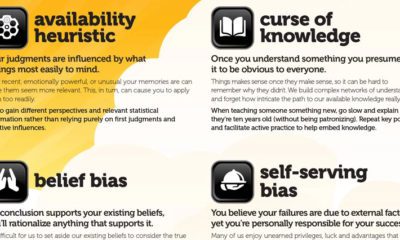
11 Cognitive Biases That Influence Political Outcomes
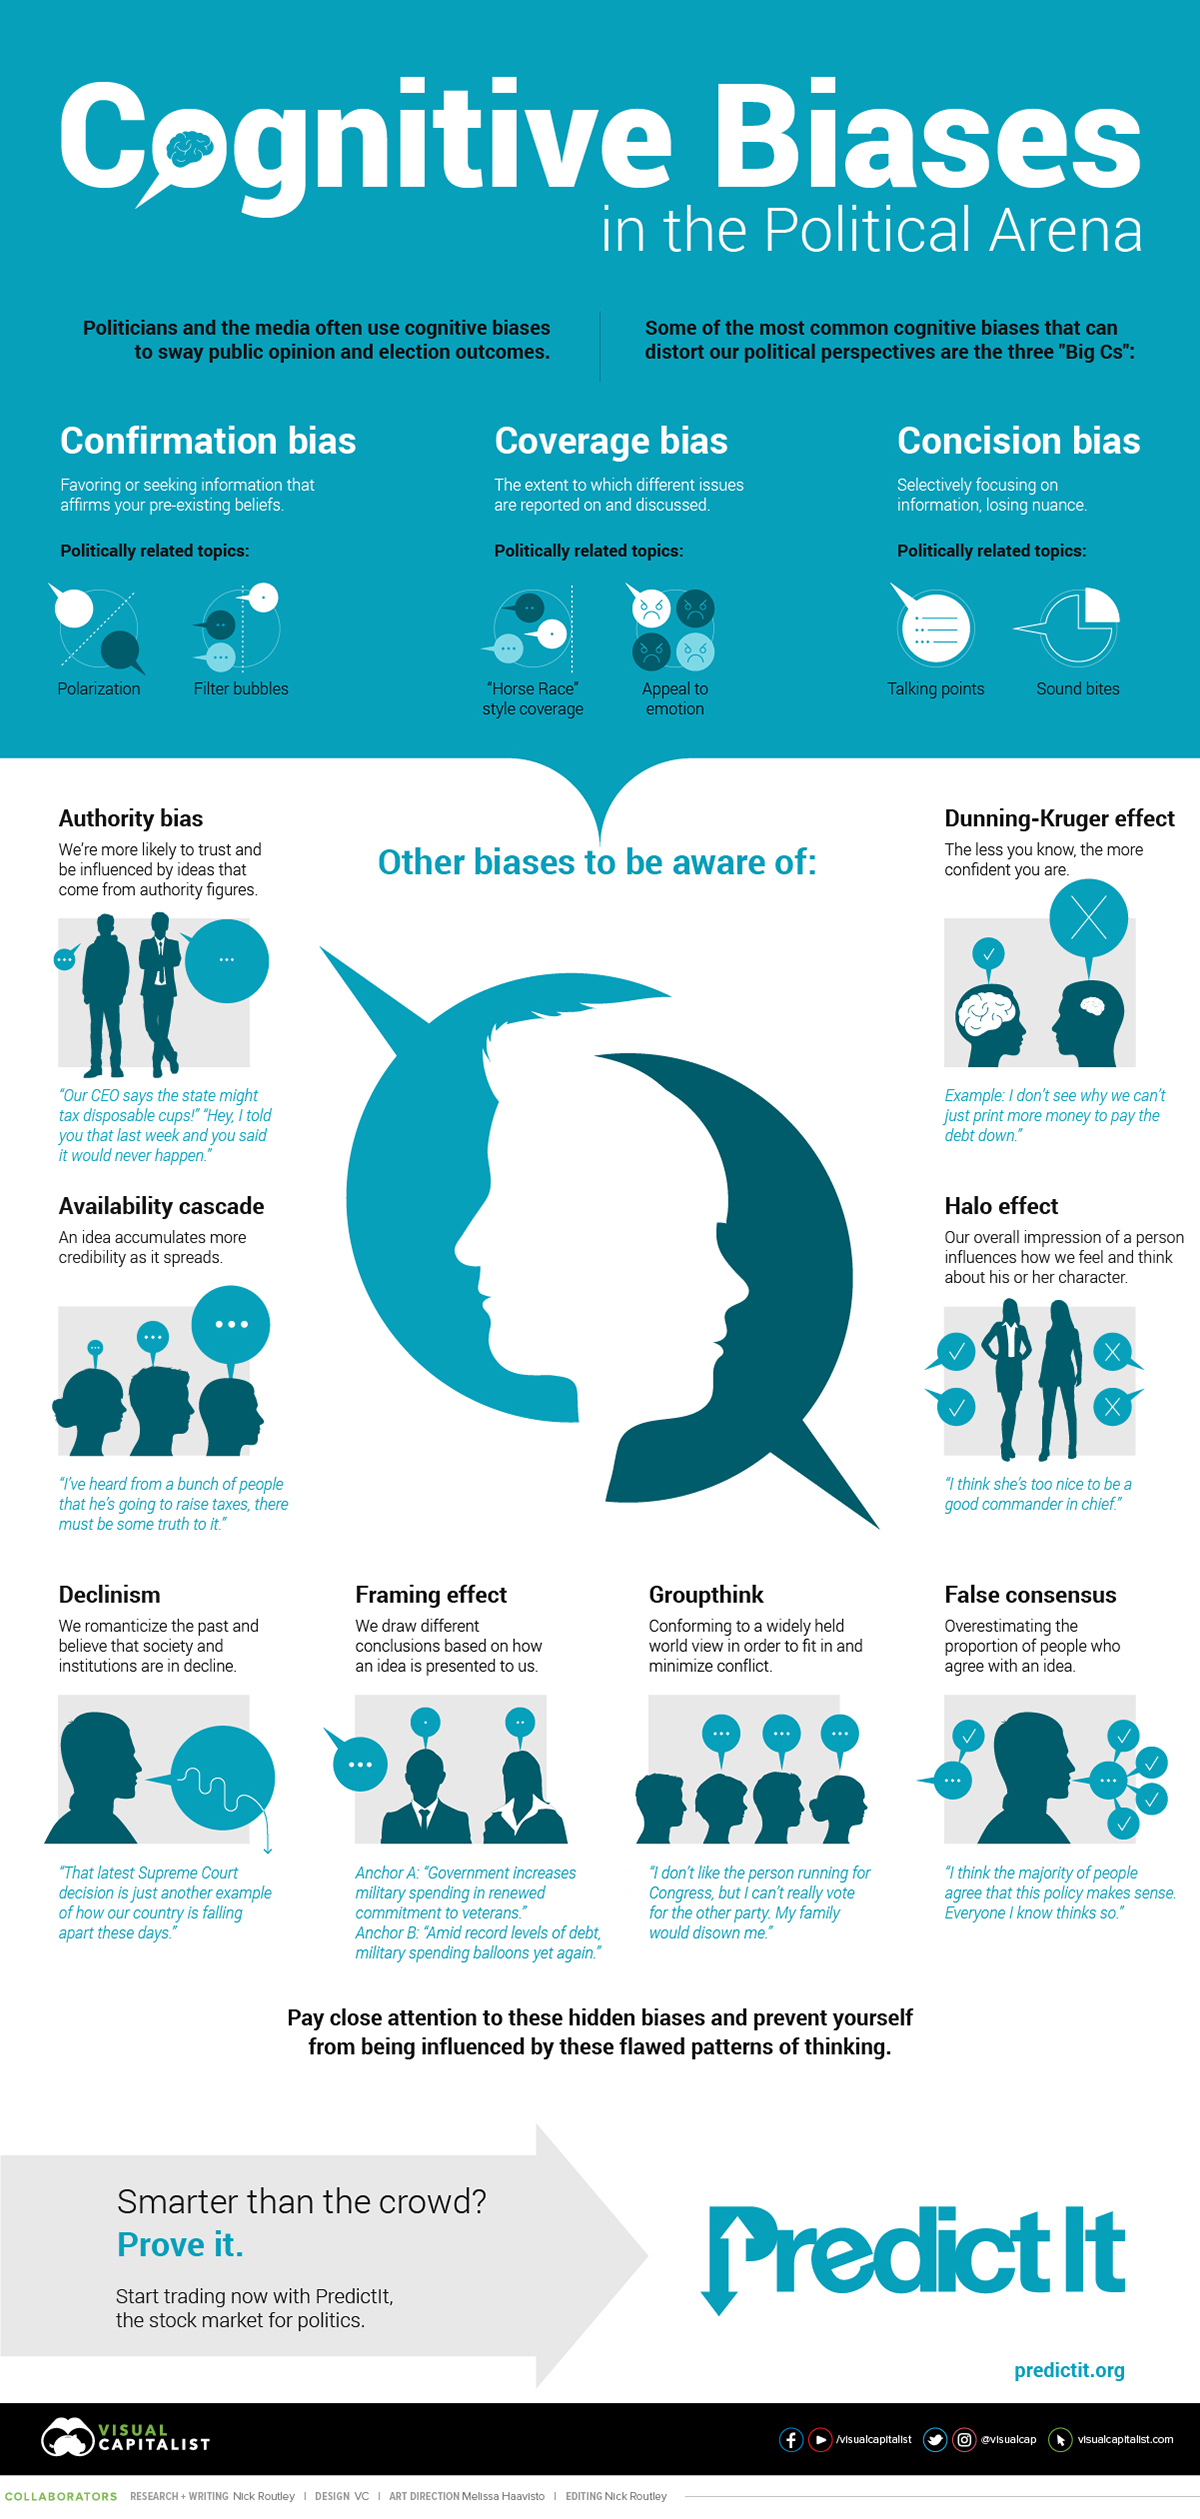
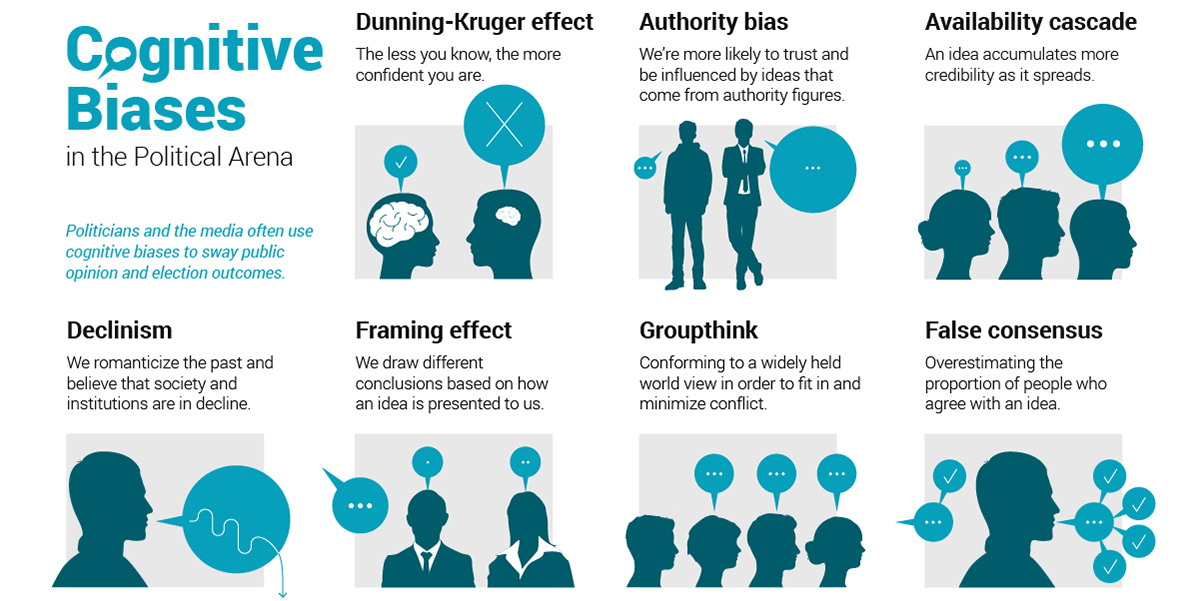
Cognitive Biases in the Political Arena
With the 2020 U.S. presidential election fast approaching, many people will be glued to the 24-hour news cycle to stay up to date on political developments. Yet, when searching for facts, our own cognitive biases often get in the way.
If this isn’t problematic enough, third parties can also take advantage of these biases to influence our thinking. The media, for example, can exploit our tendency to assign stereotypes to others by only providing catchy, surface-level information. Once established in our minds, these generalizations can be tough to shake off.
Such tactics can have a powerful influence on public opinion if applied consistently to a broad audience. To help us avoid these mental pitfalls, today’s infographic from PredictIt lists common cognitive biases that influence the realm of politics, beginning with the “Big Cs”.
The First C: Confirmation Bias
People exhibit confirmation bias when they seek information that only affirms their pre-existing beliefs. This can cause them to become overly rigid in their political opinions, even when presented with conflicting ideas or evidence.
When too many people fall victim to this bias, progress towards solving complex sociopolitical issues is thwarted. That’s because solving these issues in a bipartisan system requires cooperation from both sides of the spectrum.
A reluctance towards establishing a common ground is already widespread in America. According to a 2019 survey, 70% of Democrats believed their party’s leaders should “stand up” to President Trump, even if less gets done in Washington. Conversely, 51% of Republicans believed that Trump should “stand up” to Democrats.
In light of these developments, researchers have conducted studies to determine if the issue of confirmation bias is as prevalent as it seems. In one experiment, participants chose to either support or oppose a given sociopolitical issue. They were then presented with evidence that was conflicting, affirming, or a combination of both.
In all scenarios, participants were most likely to stick with their initial decisions. Of those presented with conflicting evidence, just one in five changed their stance. Furthermore, participants who maintained their initial positions became even more confident in the superiority of their decision—a testament to how influential confirmation bias can be.
The Second C: Coverage Bias
Coverage bias, in the context of politics, is a form of media bias where certain politicians or topics are disproportionately covered. In some cases, media outlets can even twist stories to fit a certain narrative.
For example, research from the University of South Florida analyzed media coverage on President Trump’s 2017 travel ban. It was discovered that primetime media hosts covered the ban through completely different perspectives.
Each host varied drastically in tone, phrasing, and facts of emphasis, […] presenting each issue in a manner that aligns with a specific partisan agenda.
—Josepher, Bryce (2017)
Charting the ideological placement of each source’s audience can help us gain a better understanding of the coverage bias at work. In other words, where do people on the left, middle, and right get their news?
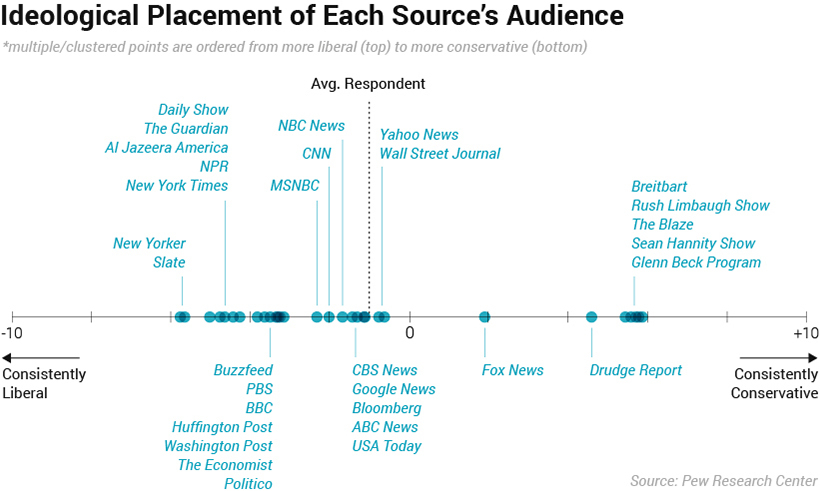
The horizontal axis in this graphic corresponds to the Ideological Consistency Scale, which is composed of 10 questions. For each question, respondents are assigned a “-1” for a liberal response, “+1” for a conservative response, or a “0” for other responses. A summation of these scores places a respondent into one of five categories:
| Ideological Category | Ranking |
|---|---|
| Consistently conservative | +7 to +10 |
| Mostly conservative | +3 to +6 |
| Mixed | -2 to +2 |
| Mostly liberal | -6 to -3 |
| Consistently liberal | -10 to -7 |
Overcoming coverage bias—which dovetails into other biases like confirmation bias—may require us to follow a wider variety of sources, even those we may not initially agree with.
The Third C: Concision Bias
Concision bias is a type of bias where politicians or the media selectively focus on aspects of information that are easy to get across. In the process, more nuanced and delicate views get omitted from popular discourse.
A common application of concision bias is the use of sound bites, which are short clips that can be taken out of a politician’s speech. When played in isolation, these clips may leave out important context for the audience.
Without the proper context, multi-faceted issues can become extremely polarizing, and may be a reason for the growing partisan divide in America. In fact, there is less overlap in the political values of Republicans and Democrats than ever previously measured.
In 1994, just 64% of Republicans were more conservative than the median Democrat. By 2017, that margin had grown considerably, to 95% of Republicans. The same trend can be found on the other end of the spectrum. Whereas 70% of Democrats were more liberal than the median Republican in 1994, this proportion increased to 97% by 2017.
Overcoming Our Biases
Achieving full self-awareness can be difficult, especially when new biases emerge in our constantly evolving world. So where do we begin?
Simply remembering these mental pitfalls exist can be a great start—after all, we can’t fix what we don’t know. Individuals concerned about the upcoming presidential election may find it useful to focus their attention on the Big Cs, as these biases can play a significant role in shaping political beliefs. Maintaining an open mindset and diversifying the media sources we follow are two tactics that may act as a hedge.


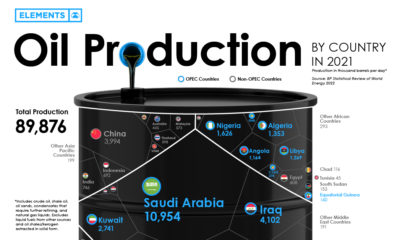


Economy
The Bloc Effect: International Trade with Geopolitical Allies on the Rise
Rising geopolitical tensions are shaping the future of international trade, but what is the effect on trading among G7 and BRICS countries?


The Bloc Effect: International Trade with Allies on the Rise
International trade has become increasingly fragmented over the last five years as countries have shifted to trading more with their geopolitical allies.
This graphic from The Hinrich Foundation, the first in a three-part series covering the future of trade, provides visual context to the growing divide in trade in G7 and pre-expansion BRICS countries, which are used as proxies for geopolitical blocs.
Trade Shifts in G7 and BRICS Countries
This analysis uses IMF data to examine differences in shares of exports within and between trading blocs from 2018 to 2023. For example, we looked at the percentage of China’s exports with other BRICS members as well as with G7 members to see how these proportions shifted in percentage points (pp) over time.
Countries traded nearly $270 billion more with allies in 2023 compared to 2018. This shift came at the expense of trade with rival blocs, which saw a decline of $314 billion.
Country Change in Exports Within Bloc (pp) Change in Exports With Other Bloc (pp)
🇮🇳 India 0.0 3.9
🇷🇺 Russia 0.7 -3.8
🇮🇹 Italy 0.8 -0.7
🇨🇦 Canada 0.9 -0.7
🇫🇷 France 1.0 -1.1
🇪🇺 EU 1.1 -1.5
🇩🇪 Germany 1.4 -2.1
🇿🇦 South Africa 1.5 1.5
🇺🇸 U.S. 1.6 -0.4
🇯🇵 Japan 2.0 -1.7
🇨🇳 China 2.1 -5.2
🇧🇷 Brazil 3.7 -3.3
🇬🇧 UK 10.2 0.5
All shifts reported are in percentage points. For example, the EU saw its share of exports to G7 countries rise from 74.3% in 2018 to 75.4% in 2023, which equates to a 1.1 percentage point increase.
The UK saw the largest uptick in trading with other countries within the G7 (+10.2 percentage points), namely the EU, as the post-Brexit trade slump to the region recovered.
Meanwhile, the U.S.-China trade dispute caused China’s share of exports to the G7 to fall by 5.2 percentage points from 2018 to 2023, the largest decline in our sample set. In fact, partly as a result of the conflict, the U.S. has by far the highest number of harmful tariffs in place.
The Russia-Ukraine War and ensuing sanctions by the West contributed to Russia’s share of exports to the G7 falling by 3.8 percentage points over the same timeframe.
India, South Africa, and the UK bucked the trend and continued to witness advances in exports with the opposing bloc.
Average Trade Shifts of G7 and BRICS Blocs
Though results varied significantly on a country-by-country basis, the broader trend towards favoring geopolitical allies in international trade is clear.
Bloc Change in Exports Within Bloc (pp) Change in Exports With Other Bloc (pp)
Average 2.1 -1.1
BRICS 1.6 -1.4
G7 incl. EU 2.4 -1.0
Overall, BRICS countries saw a larger shift away from exports with the other bloc, while for G7 countries the shift within their own bloc was more pronounced. This implies that though BRICS countries are trading less with the G7, they are relying more on trade partners outside their bloc to make up for the lost G7 share.
A Global Shift in International Trade and Geopolitical Proximity
The movement towards strengthening trade relations based on geopolitical proximity is a global trend.
The United Nations categorizes countries along a scale of geopolitical proximity based on UN voting records.
According to the organization’s analysis, international trade between geopolitically close countries rose from the first quarter of 2022 (when Russia first invaded Ukraine) to the third quarter of 2023 by over 6%. Conversely, trade with geopolitically distant countries declined.
The second piece in this series will explore China’s gradual move away from using the U.S. dollar in trade settlements.
Visit the Hinrich Foundation to learn more about the future of geopolitical trade

-

 Economy2 days ago
Economic Growth Forecasts for G7 and BRICS Countries in 2024
The IMF has released its economic growth forecasts for 2024. How do the G7 and BRICS countries compare?
-

 United States2 weeks ago
Ranked: The Largest U.S. Corporations by Number of Employees
We visualized the top U.S. companies by employees, revealing the massive scale of retailers like Walmart, Target, and Home Depot.
-

 Economy2 weeks ago
Where U.S. Inflation Hit the Hardest in March 2024
We visualized product categories that saw the highest % increase in price due to U.S. inflation as of March 2024.
-

 Economy1 month ago
G20 Inflation Rates: Feb 2024 vs COVID Peak
We visualize inflation rates across G20 countries as of Feb 2024, in the context of their COVID-19 pandemic peak.
-

 Economy1 month ago
Mapped: Unemployment Claims by State
This visual heatmap of unemployment claims by state highlights New York, California, and Alaska leading the country by a wide margin.
-

 Economy2 months ago
Confidence in the Global Economy, by Country
Will the global economy be stronger in 2024 than in 2023?


-

 Misc1 week ago
How Hard Is It to Get Into an Ivy League School?
-

 Technology2 weeks ago
Ranked: Semiconductor Companies by Industry Revenue Share
-

 Markets2 weeks ago
Ranked: The World’s Top Flight Routes, by Revenue
-

 Countries2 weeks ago
Population Projections: The World’s 6 Largest Countries in 2075
-

 Markets2 weeks ago
The Top 10 States by Real GDP Growth in 2023
-

 Demographics2 weeks ago
The Smallest Gender Wage Gaps in OECD Countries
-
Economy2 weeks ago
Where U.S. Inflation Hit the Hardest in March 2024
-

 Green2 weeks ago
Top Countries By Forest Growth Since 2001