Datastream
UK Prime Ministers with the Shortest Term Length
The Briefing
- Eight Prime Ministers in UK history have had terms shorter than one year
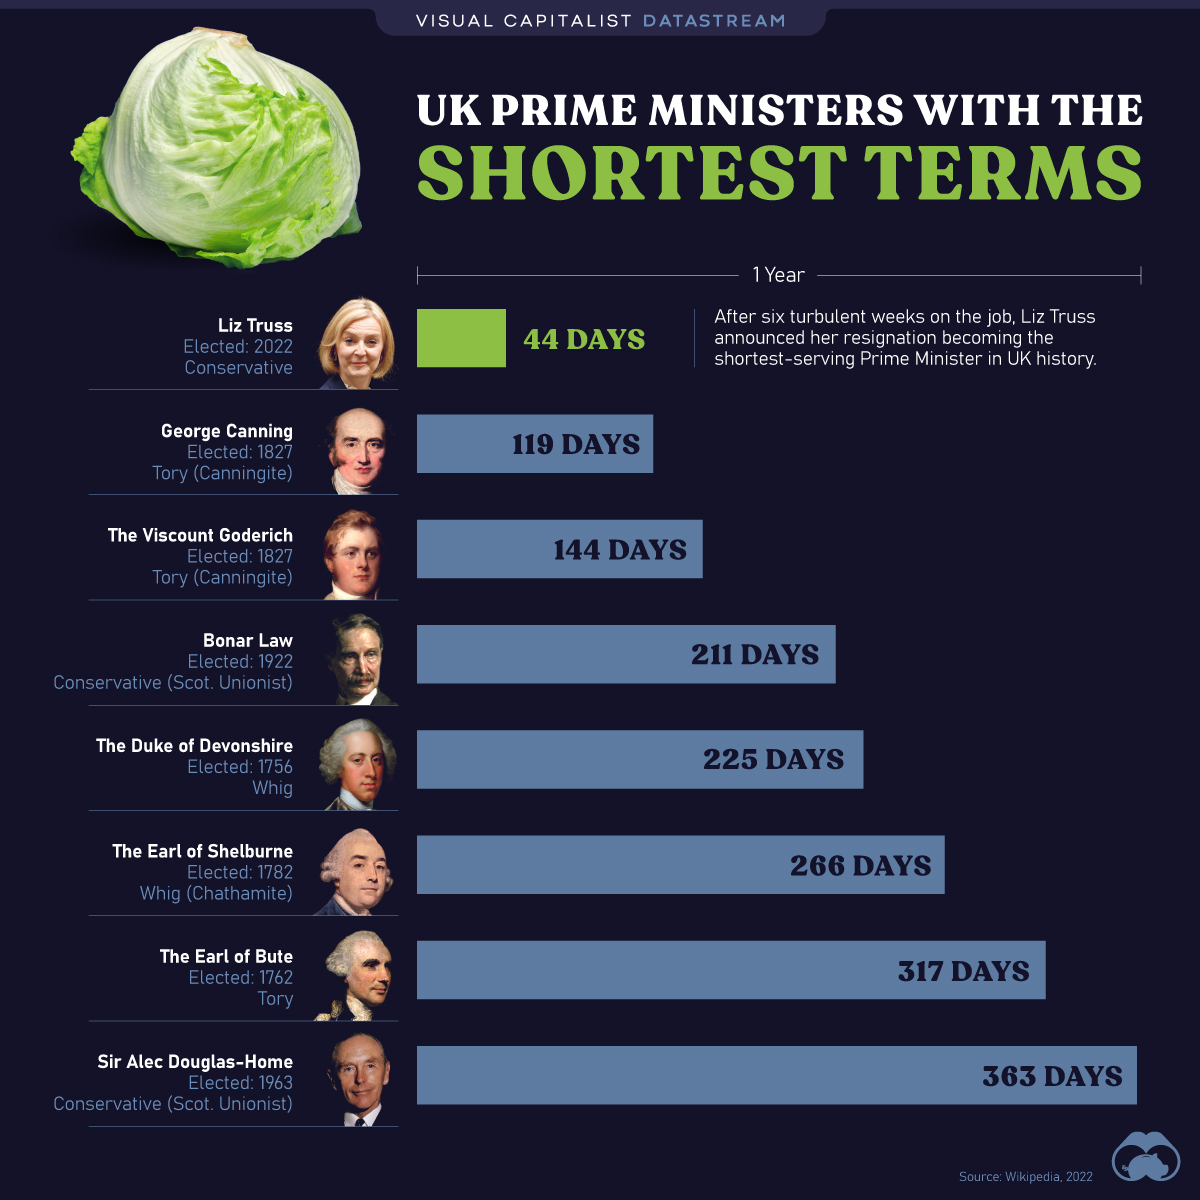
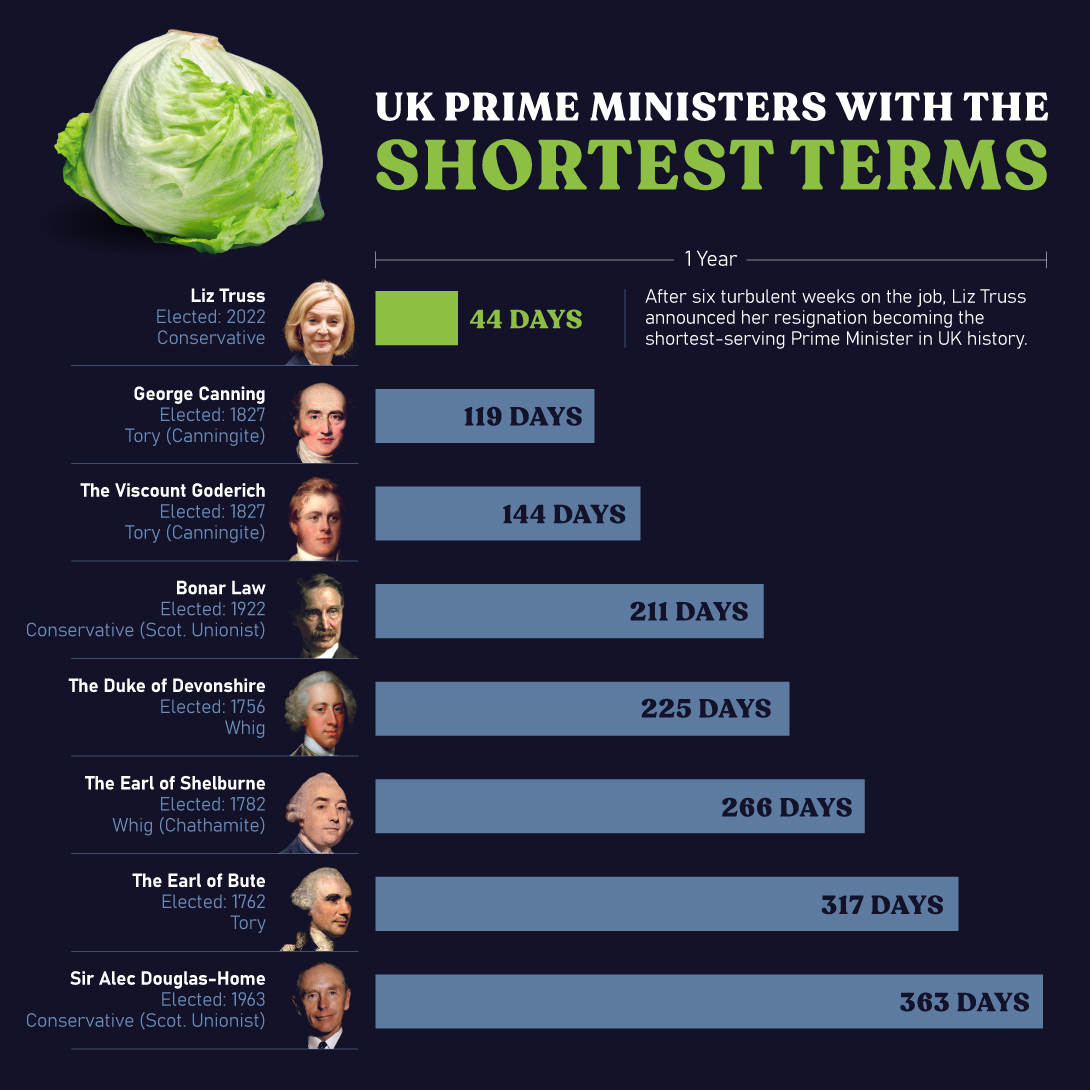
- In October 2022, Liz Truss became the shortest-serving PM, with just 44 days in the role
UK Prime Ministers with the Shortest Term Length
After six weeks that many have described as “chaotic”, UK Prime Minister Liz Truss has resigned. In stepping out of the PM role, Truss is stepping into the history books as the shortest-serving PM in UK history.
While Truss’s term is noteworthy for its briefness, she is not the only politician to have a whirlwind tour of Number 10 Downing Street. Of the 56 people who have held the PM position, eight have served less than a year:
| Prime Minister | Length of Term | Party | Start of Tenure | Reason for Exit |
|---|---|---|---|---|
| Liz Truss | 44 days | Conservative | 2022 | Resigned |
| George Canning | 119 days | Tory (Canningite) | 1827 | Died |
| F. J. Robinson, 1st Viscount Goderich | 144 days | Tory (Canningite) | 1827 | Replaced |
| Andrew Bonar Law | 211 days | Conservative (Scot. Unionist) | 1922 | Illness |
| W. Cavendish, 4th Duke of Devonshire | 225 days | Whig | 1756 | Replaced |
| W. Petty, 2nd Earl of Shelburne | 266 days | Whig (Chathamite) | 1782 | Replaced |
| J. Stuart, 3rd Earl of Bute | 317 days | Tory | 1762 | Resigned |
| Sir Alec Douglas-Home | 363 days | Conservative (Scot. Unionist) | 1963 | Election |
The next shortest term in the post-war period goes to Sir Alec Douglas-Home, who served just a hair under one year.
Why So Short?
There are a variety of reasons why leaders have served such short terms.
Much like Liz Truss’s situation, PMs like John Stuart, third Earl of Bute, and Augustus Henry Fitzroy, 3rd Duke of Grafton, ended up resigning during turbulent political situations.
Others, such as George Canning and Andrew Bonar Law, had their terms cut short after succumbing to illness. (Thankfully, this is less common in the modern era.)
Some leaders were merely keeping the seat warm until a more permanent leader stepped into the role, as was the case with William Cavendish, 4th Duke of Devonshire.
A Global Look at Brevity in Office
Of course, short tenures are not unique to the UK. Truss’s departure is drawing comparisons to Kim Campbell and John Turner, who were Canadian PMs for 132 and 72 days, respectively.
In 2007, Kevin Rudd’s second stint as Australia’s PM lasted just 83 days. Australia even has a 7 day term in its history, as Frank Forde served as PM in a caretaker capacity after the death of John Curtin in 1945.
Japan is a country that has notably short tenures in office as well. Over the past three decades, the average length of a Japanese prime minister’s tenure has been under two years.
Where does this data come from?
Source: UK.gov, via Wikipedia


Datastream
Charting the Rise of Cross-Border Money Transfers (2015-2023)
With over 280 million immigrants transferring billions of dollars annually, the remittance industry has become more valuable than ever.
The Briefing
- 79% of remittance payments in 2022 were made to low and middle-income countries.
- Borderless, low-cost money transfer services like those provided by Wise can help immigrants support their families.
The Rise of Cross-Border Money Transfers
The remittance industry has experienced consistent growth recently, solidifying its position as a key component of the global financial landscape. Defined as the transfer of money from one country to another, usually to support a dependent, remittances play a pivotal role in providing food, healthcare, and education.
In this graphic, sponsored by Scottish Mortgage, we delve into the growth of the remittance industry, and the key factors propelling its success.
Powered by Immigration
With over 280 million immigrants worldwide, the remittance industry has an important place in our global society.
By exporting billions of dollars annually back to their starting nations, immigrants can greatly improve the livelihoods of their families and communities.
This is particularly true for low and middle-income countries, who in 2022 received, on average, 79% of remittance payments, according to Knomad, an initiative of the World Bank.
| Year | Low/Middle Income (US$ Billion) | World Total (US$ Billion) |
|---|---|---|
| 2015 | $447B | $602B |
| 2016 | $440B | $596B |
| 2017 | $477B | $638B |
| 2018 | $524B | $694B |
| 2019 | $546B | $722B |
| 2020 | $542B | $711B |
| 2021 | $597B | $781B |
| 2022 | $626B | $794B |
| 2023 | $639B | $815B |
India is one of the global leaders in receiving remittance payments. In 2022 alone, over $100 billion in remittances were sent to India, supporting many families.
Enter Wise
As the global remittance industry continues to grow, it is important to acknowledge the role played by innovative money transfer operators like Wise.
With an inclusive, user-centric platform and competitive exchange rates, Wise makes it easy and cost-effective for millions of individuals to send money home, worldwide.
Connection Without Borders
But Wise doesn’t just offer remittance solutions, the company offers a host of account services and a payment infrastructure that has helped over 6.1 million active customers move over $30 billion in the first quarter of 2023 alone.
Want to invest in transformative companies like Wise?
Discover Scottish Mortgage Investment Trust, a portfolio of some of the world’s most exciting growth companies.

-

 Mining1 week ago
Gold vs. S&P 500: Which Has Grown More Over Five Years?
-

 Markets2 weeks ago
Ranked: The Most Valuable Housing Markets in America
-

 Money2 weeks ago
Which States Have the Highest Minimum Wage in America?
-

 AI2 weeks ago
Ranked: Semiconductor Companies by Industry Revenue Share
-

 Markets2 weeks ago
Ranked: The World’s Top Flight Routes, by Revenue
-

 Countries2 weeks ago
Population Projections: The World’s 6 Largest Countries in 2075
-

 Markets2 weeks ago
The Top 10 States by Real GDP Growth in 2023
-

 Demographics2 weeks ago
The Smallest Gender Wage Gaps in OECD Countries