Misc
18 Cognitive Bias Examples Show Why Mental Mistakes Get Made
View a high resolution version of this graphic
18 Cognitive Bias Examples
View the high resolution version of today’s graphic by clicking here.
Out of the 188 cognitive biases that exist, there is a much narrower group of biases that has a disproportionately large effect on the ways we do business.
These are things that affect workplace culture, budget estimates, deal outcomes, and our perceived return on investments within the company.
Mental mistakes such as these can add up quickly, and can hamper any organization in reaching its full bottom line potential.
Cognitive Bias Examples
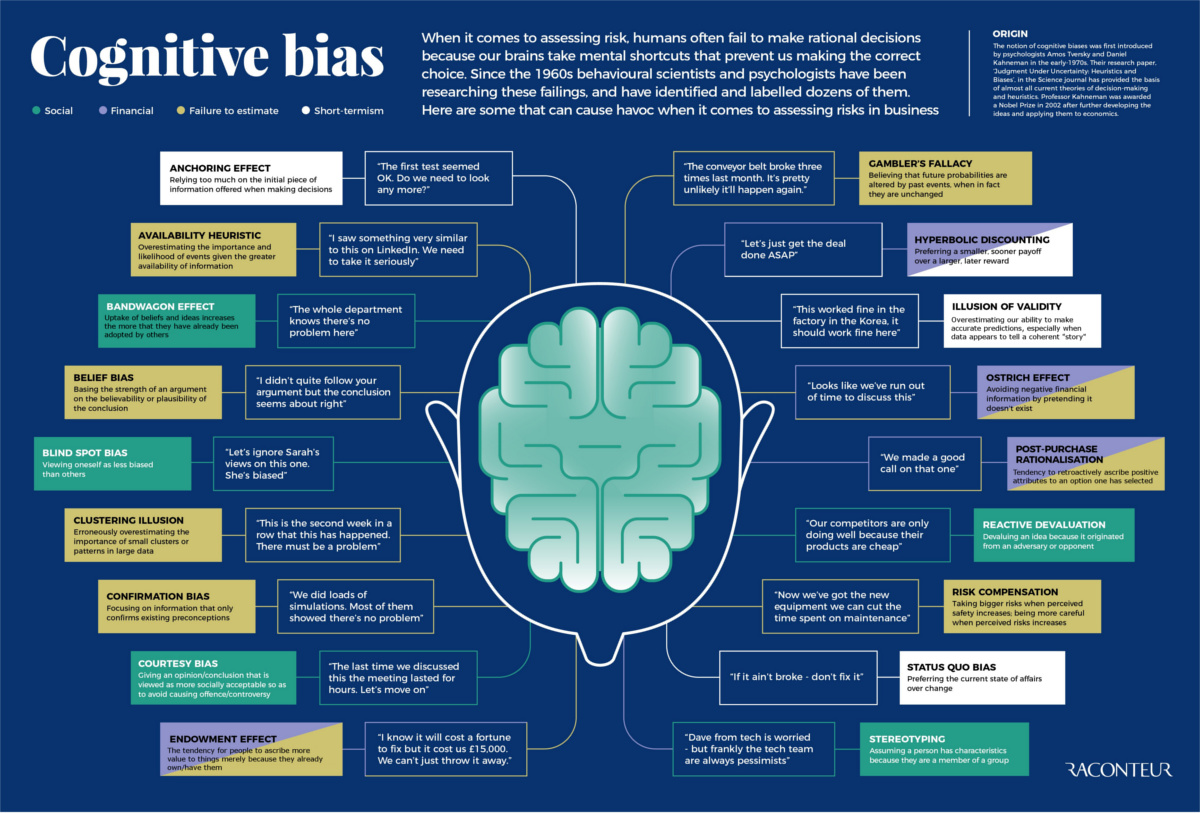
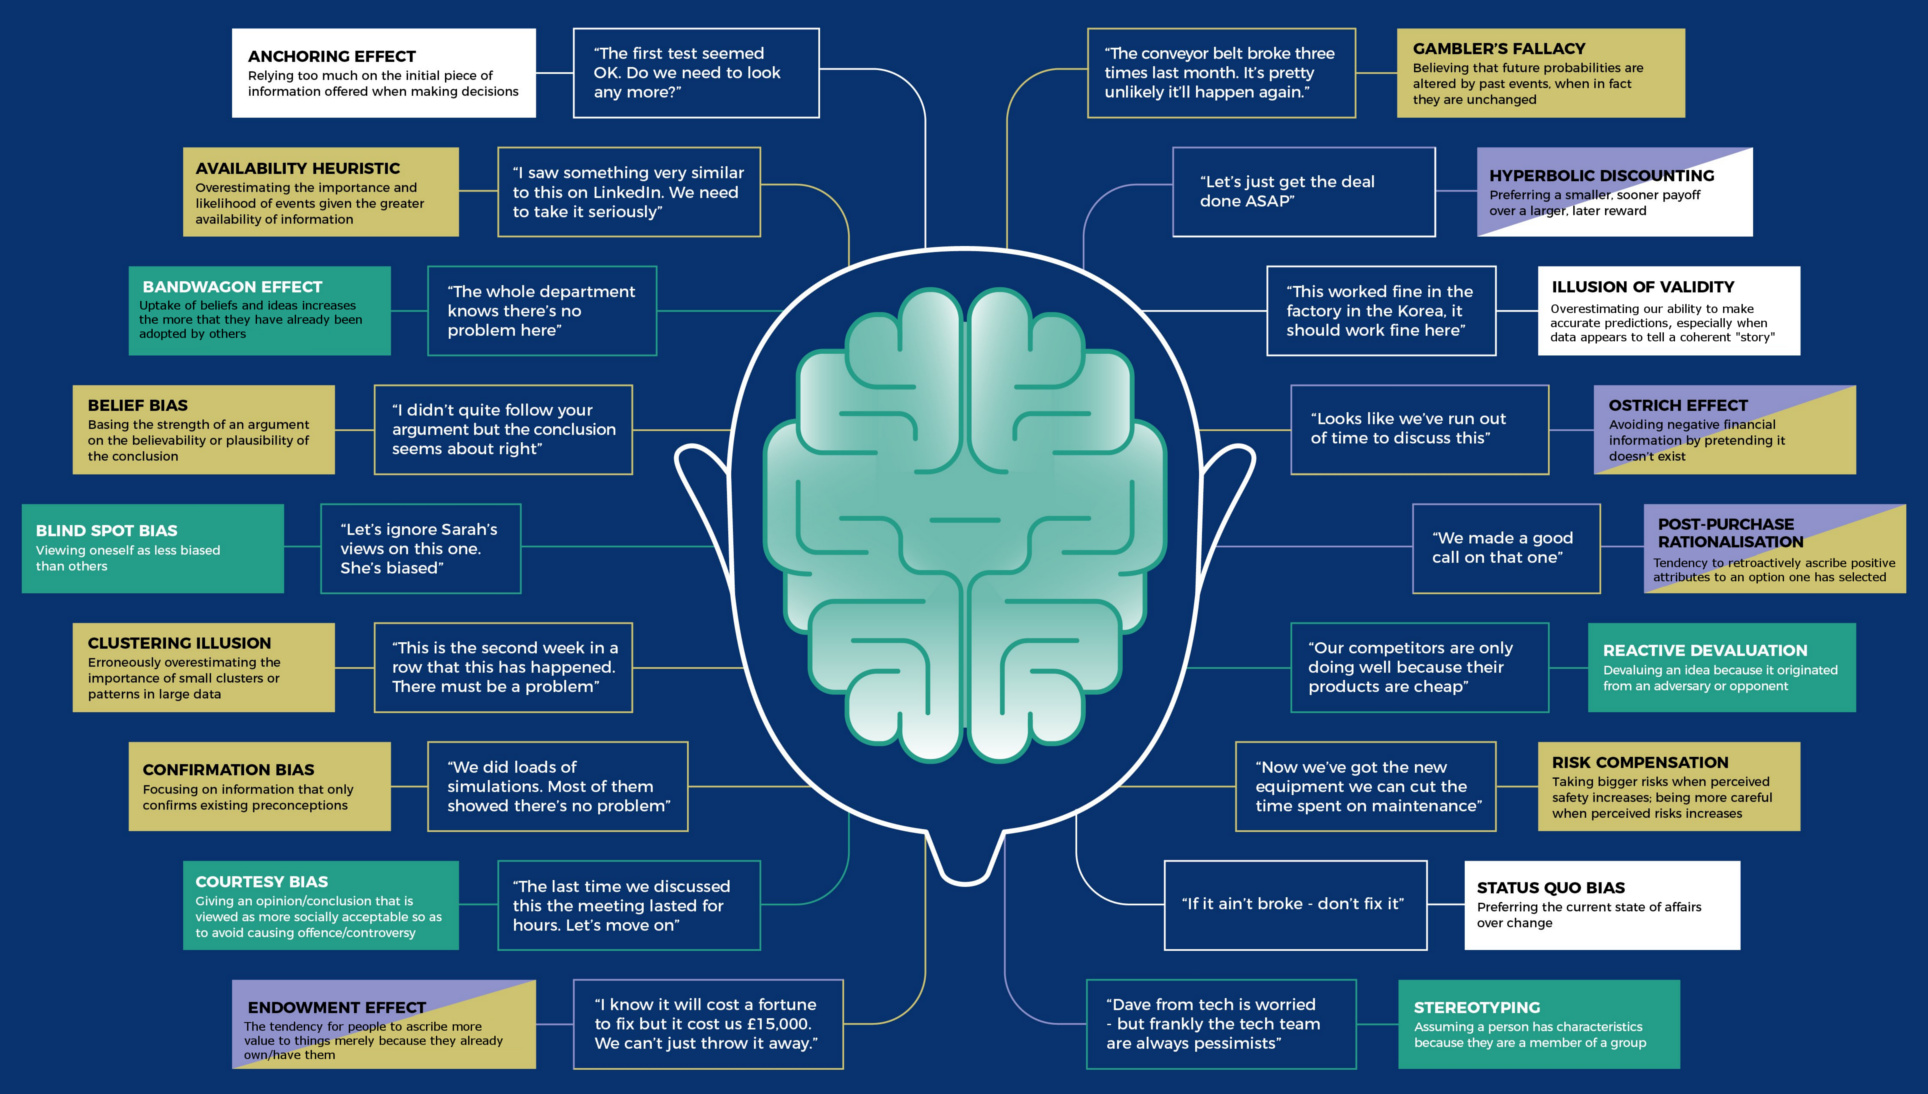
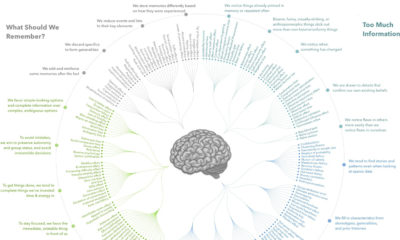
Today’s infographic from Raconteur aptly highlights 18 different cognitive bias examples that can create particularly difficult challenges for company decision-making.
The list includes biases that fall into categories such as financial, social, short term-ism, and failure to estimate:
Financial biases
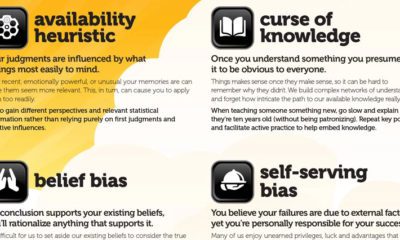
These are imprecise mental shortcuts we make with numbers, such as hyperbolic discounting – the mistake of preferring a smaller, sooner payoff instead of a larger, later reward. Another classic financial cognitive bias example is the “Ostrich effect”, which is where one sticks their head in the sand, pretending that negative financial information simply doesn’t exist.
Social biases
Social biases can have a big impact on teams and company culture. For example, teams can bandwagon (when people do something because other people are doing it), and individual team members can engage in blind spot bias (viewing oneself as less biased than others). These both can lead to worse decision-making.
Short Term-isms
One way to ensure a business that doesn’t last? Engage in short term-isms – fallacies that gear your business towards decisions that can be rationalized now, but that don’t add any long-term value. Status quo bias and anchoring are two ways this can happen.
Failure to Estimate
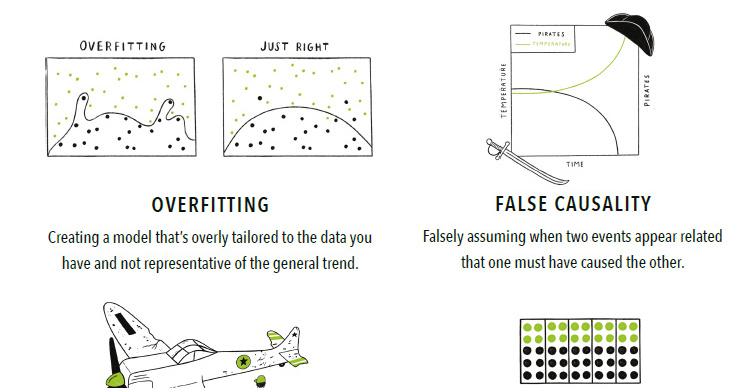
So much about business relies on making projections about the future, and the biases in this category make it difficult to make accurate estimates. Cognitive bias examples here include the availability heuristic (just because information is available, means it must be true), and the gambler’s fallacy (future probabilities are altered by past events).
Want more on cognitive biases? Here are five main biases that impact investors, specifically.


VC+
VC+: Get Our Key Takeaways From the IMF’s World Economic Outlook
A sneak preview of the exclusive VC+ Special Dispatch—your shortcut to understanding IMF’s World Economic Outlook report.

Have you read IMF’s latest World Economic Outlook yet? At a daunting 202 pages, we don’t blame you if it’s still on your to-do list.
But don’t worry, you don’t need to read the whole April release, because we’ve already done the hard work for you.
To save you time and effort, the Visual Capitalist team has compiled a visual analysis of everything you need to know from the report—and our VC+ Special Dispatch is available exclusively to VC+ members. All you need to do is log into the VC+ Archive.
If you’re not already subscribed to VC+, make sure you sign up now to access the full analysis of the IMF report, and more (we release similar deep dives every week).
For now, here’s what VC+ members get to see.
Your Shortcut to Understanding IMF’s World Economic Outlook
With long and short-term growth prospects declining for many countries around the world, this Special Dispatch offers a visual analysis of the key figures and takeaways from the IMF’s report including:
- The global decline in economic growth forecasts
- Real GDP growth and inflation forecasts for major nations in 2024
- When interest rate cuts will happen and interest rate forecasts
- How debt-to-GDP ratios have changed since 2000
- And much more!

Get the Full Breakdown in the Next VC+ Special Dispatch
VC+ members can access the full Special Dispatch by logging into the VC+ Archive, where you can also check out previous releases.
Make sure you join VC+ now to see exclusive charts and the full analysis of key takeaways from IMF’s World Economic Outlook.
Don’t miss out. Become a VC+ member today.
What You Get When You Become a VC+ Member
VC+ is Visual Capitalist’s premium subscription. As a member, you’ll get the following:
- Special Dispatches: Deep dive visual briefings on crucial reports and global trends
- Markets This Month: A snappy summary of the state of the markets and what to look out for
- The Trendline: Weekly curation of the best visualizations from across the globe
- Global Forecast Series: Our flagship annual report that covers everything you need to know related to the economy, markets, geopolitics, and the latest tech trends
- VC+ Archive: Hundreds of previously released VC+ briefings and reports that you’ve been missing out on, all in one dedicated hub
You can get all of the above, and more, by joining VC+ today.

-

 Education1 week ago
How Hard Is It to Get Into an Ivy League School?
-

 Technology2 weeks ago
Ranked: Semiconductor Companies by Industry Revenue Share
-

 Markets2 weeks ago
Ranked: The World’s Top Flight Routes, by Revenue
-

 Demographics2 weeks ago
Population Projections: The World’s 6 Largest Countries in 2075
-

 Markets2 weeks ago
The Top 10 States by Real GDP Growth in 2023
-

 Demographics2 weeks ago
The Smallest Gender Wage Gaps in OECD Countries
-

 Economy2 weeks ago
Where U.S. Inflation Hit the Hardest in March 2024
-

 Green2 weeks ago
Top Countries By Forest Growth Since 2001