Misc
29 Psychological Tricks To Make You Buy More
29 Psychological Tricks To Make You Buy More
Ever suffered from buyer’s remorse? You’re not alone.
According to a recent survey, only 5% of people have never felt guilty about buying something. That means the majority of us, at some point in our lives, have regretted a purchase.
But consumers aren’t necessarily only to blame for impulse buys. After all, we’re constantly bombarded with advertisements and marketing tactics specifically tailored to try and get us to spend more money.
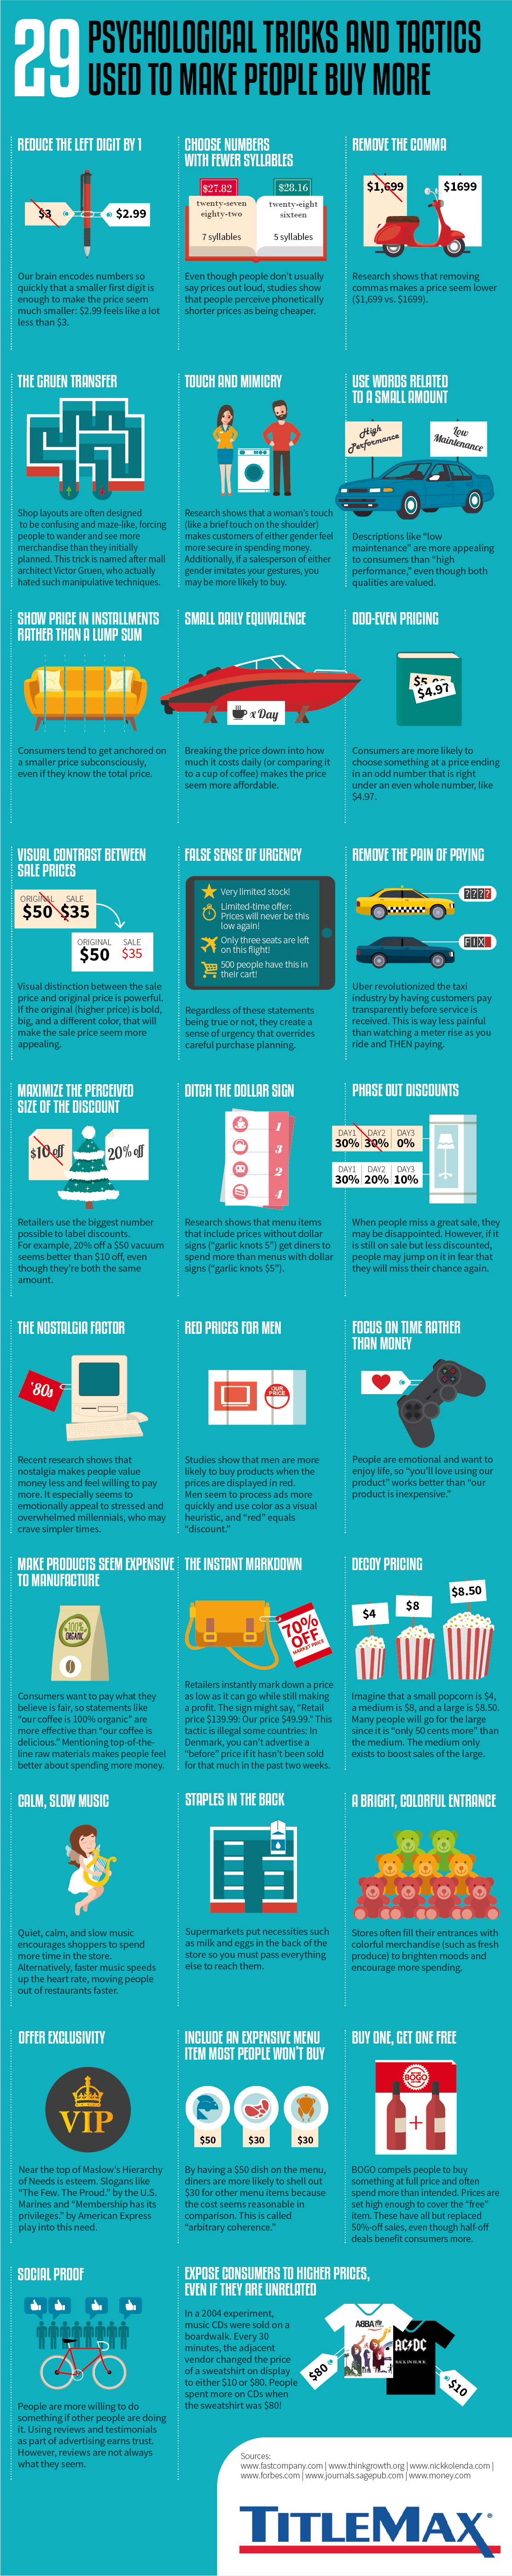
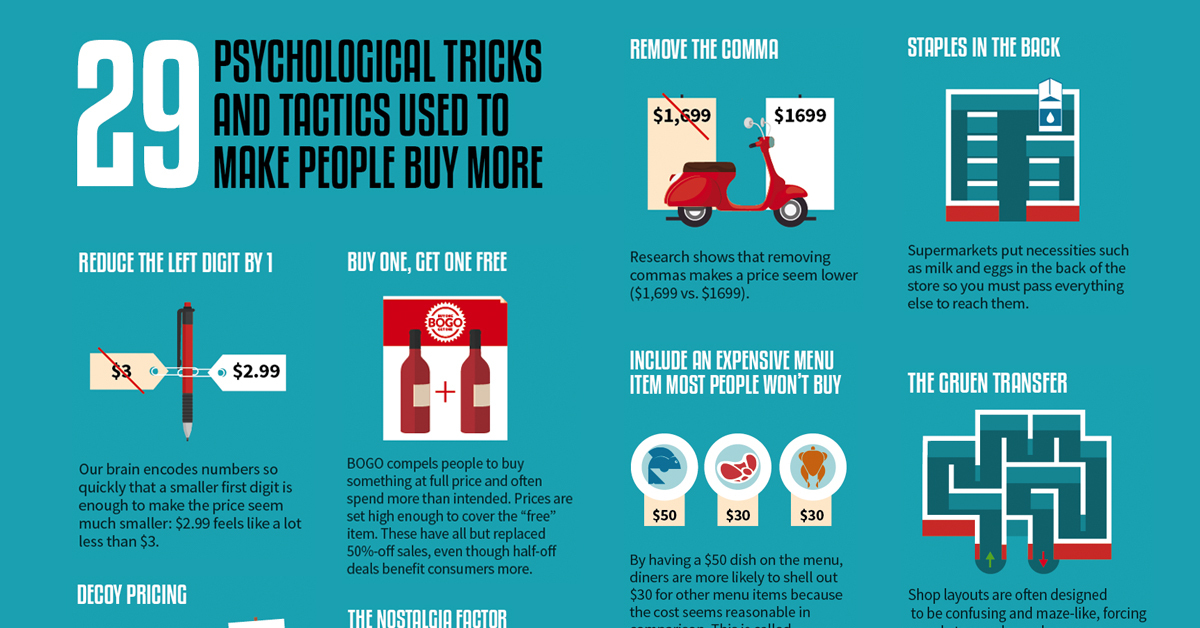
Today’s graphic by TitleMax explains 29 different psychological tactics that marketers try to get consumers to buy more.
Tricks are for Marketers
While this list isn’t exhaustive, it provides some key examples of the ways that marketers are attempting to influence your subconscious mind.
We noticed some high-level trends among the 29 tactics, which we compiled into four overarching sections:
- Visual Pricing Tricks
These tricks aim to intentionally minimize the appearance of the price, so it’s more palatable to consumers. For instance, a store will price something at $9.99 instead of $10.00, or label a product as “buy-one-get-one” rather than 50% off. - Intentional Language Tricks
It’s not what you say, but how you say it. Making products seem costly to manufacture, offering exclusivity, and using words associated with small amounts fall under this category. These tricks use semantics to position a product in an appealing way. - Brick-and-Mortar Tricks
A store’s layout is less arbitrary than you may realize. Having a bright and colorful entrance, playing calm and slow music, and putting the essential items at the back of the store are a few tactics that fall into this section. These tricks use displays and product placement to influence consumer behavior. - Urgency Tricks
A false sense of urgency and phase-out discounts are included in this category. If a consumer believes they might miss out on a deal, they’re more likely to buy.
The Theories in Practice
While most retailers are guilty of using at least a few of these tactics, several big companies are notorious for their use of psychological tricks to boost sales.
For instance, Ikea is well known for its confusing, maze-like layout. This is no accident, as an Ikea store’s architecture is designed specifically to maximize product exposure—it’s mastered what’s called the Gruen effect, a term named after architect Victor Gruen, whose elaborate displays were proven to convert browsers into buyers.
Another example is Walmart’s rollback pricing, which uses visual contrast to make the sale price more appealing. It’s clearly served the company well—in 2019, Walmart made $524 billion in revenue, making it the world’s largest retailer.
Costco uses a few tactics on the list, but one it’s notorious for is putting fresh produce in the back of the store. That means customers need to pass through the electronics, clothing, and household goods sections before they can get to the necessities.
While the above tactics are in a gray area, other tricks are flat out dishonest. Makeup brand Sunday Riley was caught writing fake Sephora reviews to boost sales. Employees were encouraged to write outstanding reviews for the company, and the CEO even provided instructions on how to avoid getting caught.
The Influencer Era
As consumers become aware of certain marketing tactics, retailers are forced to switch up their game in order to remain effective.
A relatively recent phenomenon is influencer marketing, which is when brands partner with vloggers or influencers to endorse a product. And these partnerships tend to work—a recent survey revealed that 40% of people have purchased something based on an influencer’s recommendation.
But how long will influencer marketing—or any of these tactics—stay effective? Some of the more subtle pricing tactics might stay relevant for longer, but it’s unlikely that all of these tricks will stand the test of time.


VC+
VC+: Get Our Key Takeaways From the IMF’s World Economic Outlook
A sneak preview of the exclusive VC+ Special Dispatch—your shortcut to understanding IMF’s World Economic Outlook report.

Have you read IMF’s latest World Economic Outlook yet? At a daunting 202 pages, we don’t blame you if it’s still on your to-do list.
But don’t worry, you don’t need to read the whole April release, because we’ve already done the hard work for you.
To save you time and effort, the Visual Capitalist team has compiled a visual analysis of everything you need to know from the report—and our upcoming VC+ Special Dispatch will be available exclusively to VC+ members on Thursday, April 25th.
If you’re not already subscribed to VC+, make sure you sign up now to receive the full analysis of the IMF report, and more (we release similar deep dives every week).
For now, here’s what VC+ members can expect to receive.
Your Shortcut to Understanding IMF’s World Economic Outlook
With long and short-term growth prospects declining for many countries around the world, this Special Dispatch offers a visual analysis of the key figures and takeaways from the IMF’s report including:
- The global decline in economic growth forecasts
- Real GDP growth and inflation forecasts for major nations in 2024
- When interest rate cuts will happen and interest rate forecasts
- How debt-to-GDP ratios have changed since 2000
- And much more!

Get the Full Breakdown in the Next VC+ Special Dispatch
VC+ members will receive the full Special Dispatch on Thursday, April 25th.
Make sure you join VC+ now to receive exclusive charts and the full analysis of key takeaways from IMF’s World Economic Outlook.
Don’t miss out. Become a VC+ member today.
What You Get When You Become a VC+ Member
VC+ is Visual Capitalist’s premium subscription. As a member, you’ll get the following:
- Special Dispatches: Deep dive visual briefings on crucial reports and global trends
- Markets This Month: A snappy summary of the state of the markets and what to look out for
- The Trendline: Weekly curation of the best visualizations from across the globe
- Global Forecast Series: Our flagship annual report that covers everything you need to know related to the economy, markets, geopolitics, and the latest tech trends
- VC+ Archive: Hundreds of previously released VC+ briefings and reports that you’ve been missing out on, all in one dedicated hub
You can get all of the above, and more, by joining VC+ today.

-

 Green1 week ago
Ranked: The Countries With the Most Air Pollution in 2023
-

 AI2 weeks ago
The Stock Performance of U.S. Chipmakers So Far in 2024
-

 Markets2 weeks ago
Charted: Big Four Market Share by S&P 500 Audits
-

 Real Estate2 weeks ago
Ranked: The Most Valuable Housing Markets in America
-

 Money2 weeks ago
Which States Have the Highest Minimum Wage in America?
-

 AI2 weeks ago
Ranked: Semiconductor Companies by Industry Revenue Share
-

 Travel2 weeks ago
Ranked: The World’s Top Flight Routes, by Revenue
-

 Countries2 weeks ago
Population Projections: The World’s 6 Largest Countries in 2075