Markets
All of the World’s Wealth in One Visualization
All of the World’s Wealth in One Visualization
The financial concept of wealth is broad, and it can take many forms.
While your wealth is most likely driven by the dollars in your bank account and the value of your stock portfolio and house, wealth also includes a number of smaller things as well, such as the old furniture in your garage or a painting on the wall.
From the macro perspective of a country, wealth is even more all-encompassing — it’s not just about the assets held by private households or businesses, but also those owned by the public. What is the value of a new toll bridge, or an aging nuclear power plant?
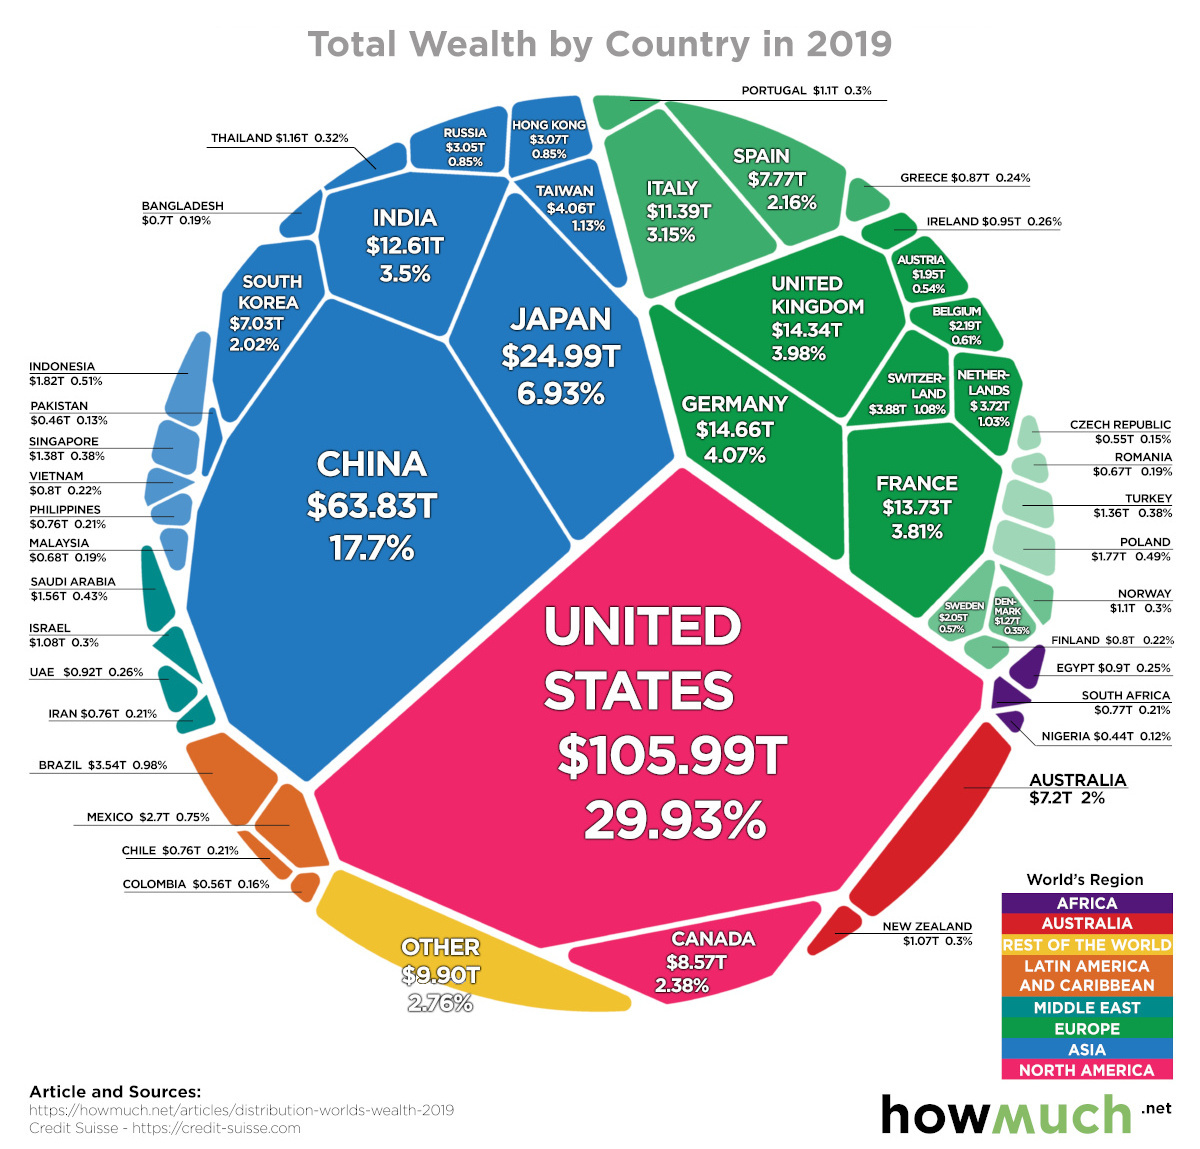
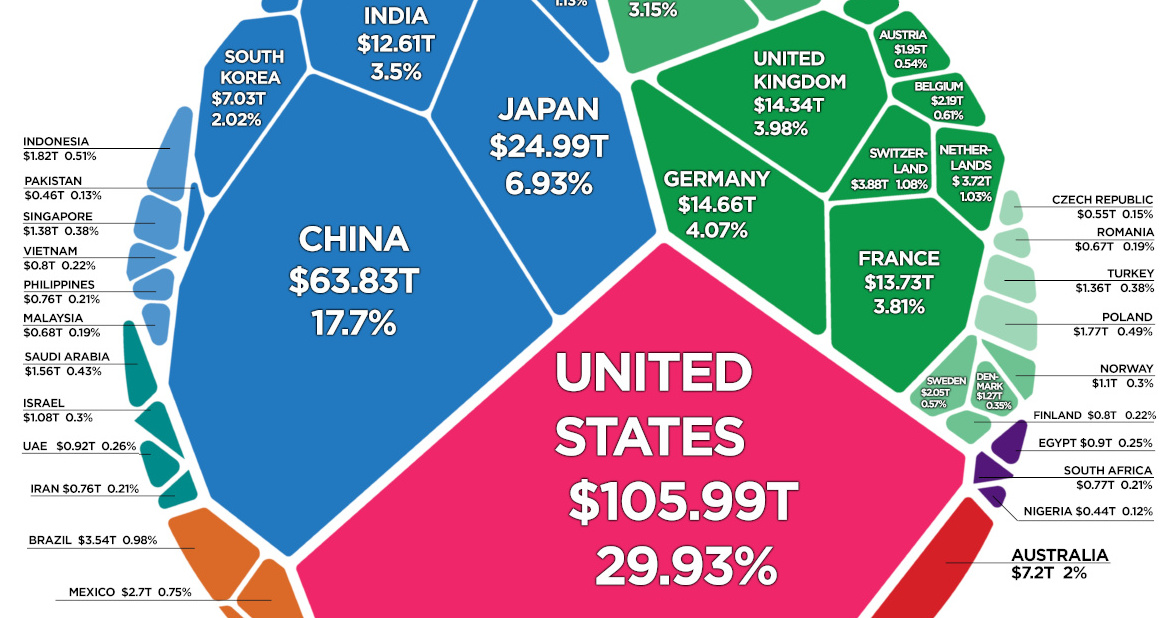
Today’s visualization comes to us from HowMuch.net, and it shows all of the world’s wealth in one place, sorted by country.
Total Wealth by Region
In 2019, total world wealth grew by $9.1 trillion to $360.6 trillion, which amounts to a 2.6% increase over the previous year.
Here’s how that divvies up between major global regions:
| Region | Total Wealth ($B, 2019) | % Global Share |
|---|---|---|
| North America | $114,607 | 31.8% |
| Europe | $90,752 | 25.2% |
| Asia-Pacific | $64,778 | 18.0% |
| China | $63,827 | 17.7% |
| India | $12,614 | 3.5% |
| Latin America | $9,906 | 2.7% |
| Africa | $4,119 | 1.1% |
| World | $360,603 | 100.0% |
Last year, growth in global wealth exceeded that of the population, incrementally increasing wealth per adult to $70,850, a 1.2% bump and an all-time high.
That said, it’s worth mentioning that Credit Suisse, the authors of the Global Wealth Report 2019 and the source of all this data, notes that the 1.2% increase has not been adjusted for inflation.
Ranking Countries by Total Wealth
Which countries are the richest?
Let’s take a look at the 15 countries that hold the most wealth, according to Credit Suisse:
| Rank | Country | Region | Total Wealth ($B, 2019) | % Global Share |
|---|---|---|---|---|
| #1 | 🇺🇸 United States | North America | $105,990 | 29.4% |
| #2 | 🇨🇳 China | China | $63,827 | 17.7% |
| #3 | 🇯🇵 Japan | Asia-Pacific | $24,992 | 6.9% |
| #4 | 🇩🇪 Germany | Europe | $14,660 | 4.1% |
| #5 | 🇬🇧 United Kingdom | Europe | $14,341 | 4.0% |
| #6 | 🇫🇷 France | Europe | $13,729 | 3.8% |
| #7 | 🇮🇳 India | India | $12,614 | 3.5% |
| #8 | 🇮🇹 Italy | Europe | $11,358 | 3.1% |
| #9 | 🇨🇦 Canada | North America | $8,573 | 2.4% |
| #10 | 🇪🇸 Spain | Europe | $7,772 | 2.2% |
| #11 | 🇰🇷 South Korea | Asia-Pacific | $7,302 | 2.0% |
| #12 | 🇦🇺 Australia | Asia-Pacific | $7,202 | 2.0% |
| #13 | 🇹🇼 Taiwan | Asia-Pacific | $4,062 | 1.1% |
| #14 | 🇨🇭 Switzerland | Europe | $3,877 | 1.1% |
| #15 | 🇳🇱 Netherlands | Europe | $3,719 | 1.0% |
| All Other Countries | $56,585 | 15.7% | ||
| Global Total | $360,603 | 100.0% |
The 15 wealthiest nations combine for 84.3% of global wealth.
Leading the pack is the United States, which holds $106.0 trillion of the world’s wealth — equal to a 29.4% share of the global total. Interestingly, the United States economy makes up 23.9% of the size of the world economy in comparison.
Behind the U.S. is China, the only other country with a double-digit share of global wealth, equal to 17.7% of wealth or $63.8 trillion. As the country continues to build out its middle class, one estimate sees Chinese private wealth increasing by 119.5% over the next decade.
Impressively, the combined wealth of the U.S. and China is more than the next 13 countries in aggregate — and almost equal to half of the global wealth total.


Markets
The European Stock Market: Attractive Valuations Offer Opportunities
On average, the European stock market has valuations that are nearly 50% lower than U.S. valuations. But how can you access the market?


European Stock Market: Attractive Valuations Offer Opportunities
Europe is known for some established brands, from L’Oréal to Louis Vuitton. However, the European stock market offers additional opportunities that may be lesser known.
The above infographic, sponsored by STOXX, outlines why investors may want to consider European stocks.
Attractive Valuations
Compared to most North American and Asian markets, European stocks offer lower or comparable valuations.
| Index | Price-to-Earnings Ratio | Price-to-Book Ratio |
|---|---|---|
| EURO STOXX 50 | 14.9 | 2.2 |
| STOXX Europe 600 | 14.4 | 2 |
| U.S. | 25.9 | 4.7 |
| Canada | 16.1 | 1.8 |
| Japan | 15.4 | 1.6 |
| Asia Pacific ex. China | 17.1 | 1.8 |
Data as of February 29, 2024. See graphic for full index names. Ratios based on trailing 12 month financials. The price to earnings ratio excludes companies with negative earnings.
On average, European valuations are nearly 50% lower than U.S. valuations, potentially offering an affordable entry point for investors.
Research also shows that lower price ratios have historically led to higher long-term returns.
Market Movements Not Closely Connected
Over the last decade, the European stock market had low-to-moderate correlation with North American and Asian equities.
The below chart shows correlations from February 2014 to February 2024. A value closer to zero indicates low correlation, while a value of one would indicate that two regions are moving in perfect unison.
| EURO STOXX 50 | STOXX EUROPE 600 | U.S. | Canada | Japan | Asia Pacific ex. China |
|
|---|---|---|---|---|---|---|
| EURO STOXX 50 | 1.00 | 0.97 | 0.55 | 0.67 | 0.24 | 0.43 |
| STOXX EUROPE 600 | 1.00 | 0.56 | 0.71 | 0.28 | 0.48 | |
| U.S. | 1.00 | 0.73 | 0.12 | 0.25 | ||
| Canada | 1.00 | 0.22 | 0.40 | |||
| Japan | 1.00 | 0.88 | ||||
| Asia Pacific ex. China | 1.00 |
Data is based on daily USD returns.
European equities had relatively independent market movements from North American and Asian markets. One contributing factor could be the differing sector weights in each market. For instance, technology makes up a quarter of the U.S. market, but health care and industrials dominate the broader European market.
Ultimately, European equities can enhance portfolio diversification and have the potential to mitigate risk for investors.
Tracking the Market
For investors interested in European equities, STOXX offers a variety of flagship indices:
| Index | Description | Market Cap |
|---|---|---|
| STOXX Europe 600 | Pan-regional, broad market | €10.5T |
| STOXX Developed Europe | Pan-regional, broad-market | €9.9T |
| STOXX Europe 600 ESG-X | Pan-regional, broad market, sustainability focus | €9.7T |
| STOXX Europe 50 | Pan-regional, blue-chip | €5.1T |
| EURO STOXX 50 | Eurozone, blue-chip | €3.5T |
Data is as of February 29, 2024. Market cap is free float, which represents the shares that are readily available for public trading on stock exchanges.
The EURO STOXX 50 tracks the Eurozone’s biggest and most traded companies. It also underlies one of the world’s largest ranges of ETFs and mutual funds. As of November 2023, there were €27.3 billion in ETFs and €23.5B in mutual fund assets under management tracking the index.
“For the past 25 years, the EURO STOXX 50 has served as an accurate, reliable and tradable representation of the Eurozone equity market.”
— Axel Lomholt, General Manager at STOXX
Partnering with STOXX to Track the European Stock Market
Are you interested in European equities? STOXX can be a valuable partner:
- Comprehensive, liquid and investable ecosystem
- European heritage, global reach
- Highly sophisticated customization capabilities
- Open architecture approach to using data
- Close partnerships with clients
- Part of ISS STOXX and Deutsche Börse Group
With a full suite of indices, STOXX can help you benchmark against the European stock market.
Learn how STOXX’s European indices offer liquid and effective market access.

-

 Economy2 days ago
Economic Growth Forecasts for G7 and BRICS Countries in 2024
The IMF has released its economic growth forecasts for 2024. How do the G7 and BRICS countries compare?
-

 Markets1 week ago
U.S. Debt Interest Payments Reach $1 Trillion
U.S. debt interest payments have surged past the $1 trillion dollar mark, amid high interest rates and an ever-expanding debt burden.
-

 United States2 weeks ago
Ranked: The Largest U.S. Corporations by Number of Employees
We visualized the top U.S. companies by employees, revealing the massive scale of retailers like Walmart, Target, and Home Depot.
-

 Markets2 weeks ago
The Top 10 States by Real GDP Growth in 2023
This graphic shows the states with the highest real GDP growth rate in 2023, largely propelled by the oil and gas boom.
-

 Markets2 weeks ago
Ranked: The World’s Top Flight Routes, by Revenue
In this graphic, we show the highest earning flight routes globally as air travel continued to rebound in 2023.
-

 Markets2 weeks ago
Ranked: The Most Valuable Housing Markets in America
The U.S. residential real estate market is worth a staggering $47.5 trillion. Here are the most valuable housing markets in the country.


-

 Education1 week ago
How Hard Is It to Get Into an Ivy League School?
-

 Technology2 weeks ago
Ranked: Semiconductor Companies by Industry Revenue Share
-
Markets2 weeks ago
Ranked: The World’s Top Flight Routes, by Revenue
-

 Demographics2 weeks ago
Population Projections: The World’s 6 Largest Countries in 2075
-
Markets2 weeks ago
The Top 10 States by Real GDP Growth in 2023
-

 Demographics2 weeks ago
The Smallest Gender Wage Gaps in OECD Countries
-

 Economy2 weeks ago
Where U.S. Inflation Hit the Hardest in March 2024
-

 Environment2 weeks ago
Top Countries By Forest Growth Since 2001