Money
Visualizing the Wealth of Nations
Visualizing the Wealth of Nations
Just as there exists a longstanding inequality in the distribution of household wealth, so exists a considerable differential in the amount of wealth held by countries on the international stage.
Simply put, some nations are “haves”, while many others are “have-nots”.
“Wherever there is great property, there is great inequality.”
– Adam Smith, The Wealth of Nations
Ranking Riches
We previously showed you how the ranking of the richest countries in the world has changed over the course of the last 10 years (2008-2018).
Today’s chart keys on a slightly different question.
What are the wealthiest nations today, both in absolute and per capita terms, and how is this list projected to change over the next decade? Let’s see how the wealth of nations stack up.
Private Wealth: Now and in the Future
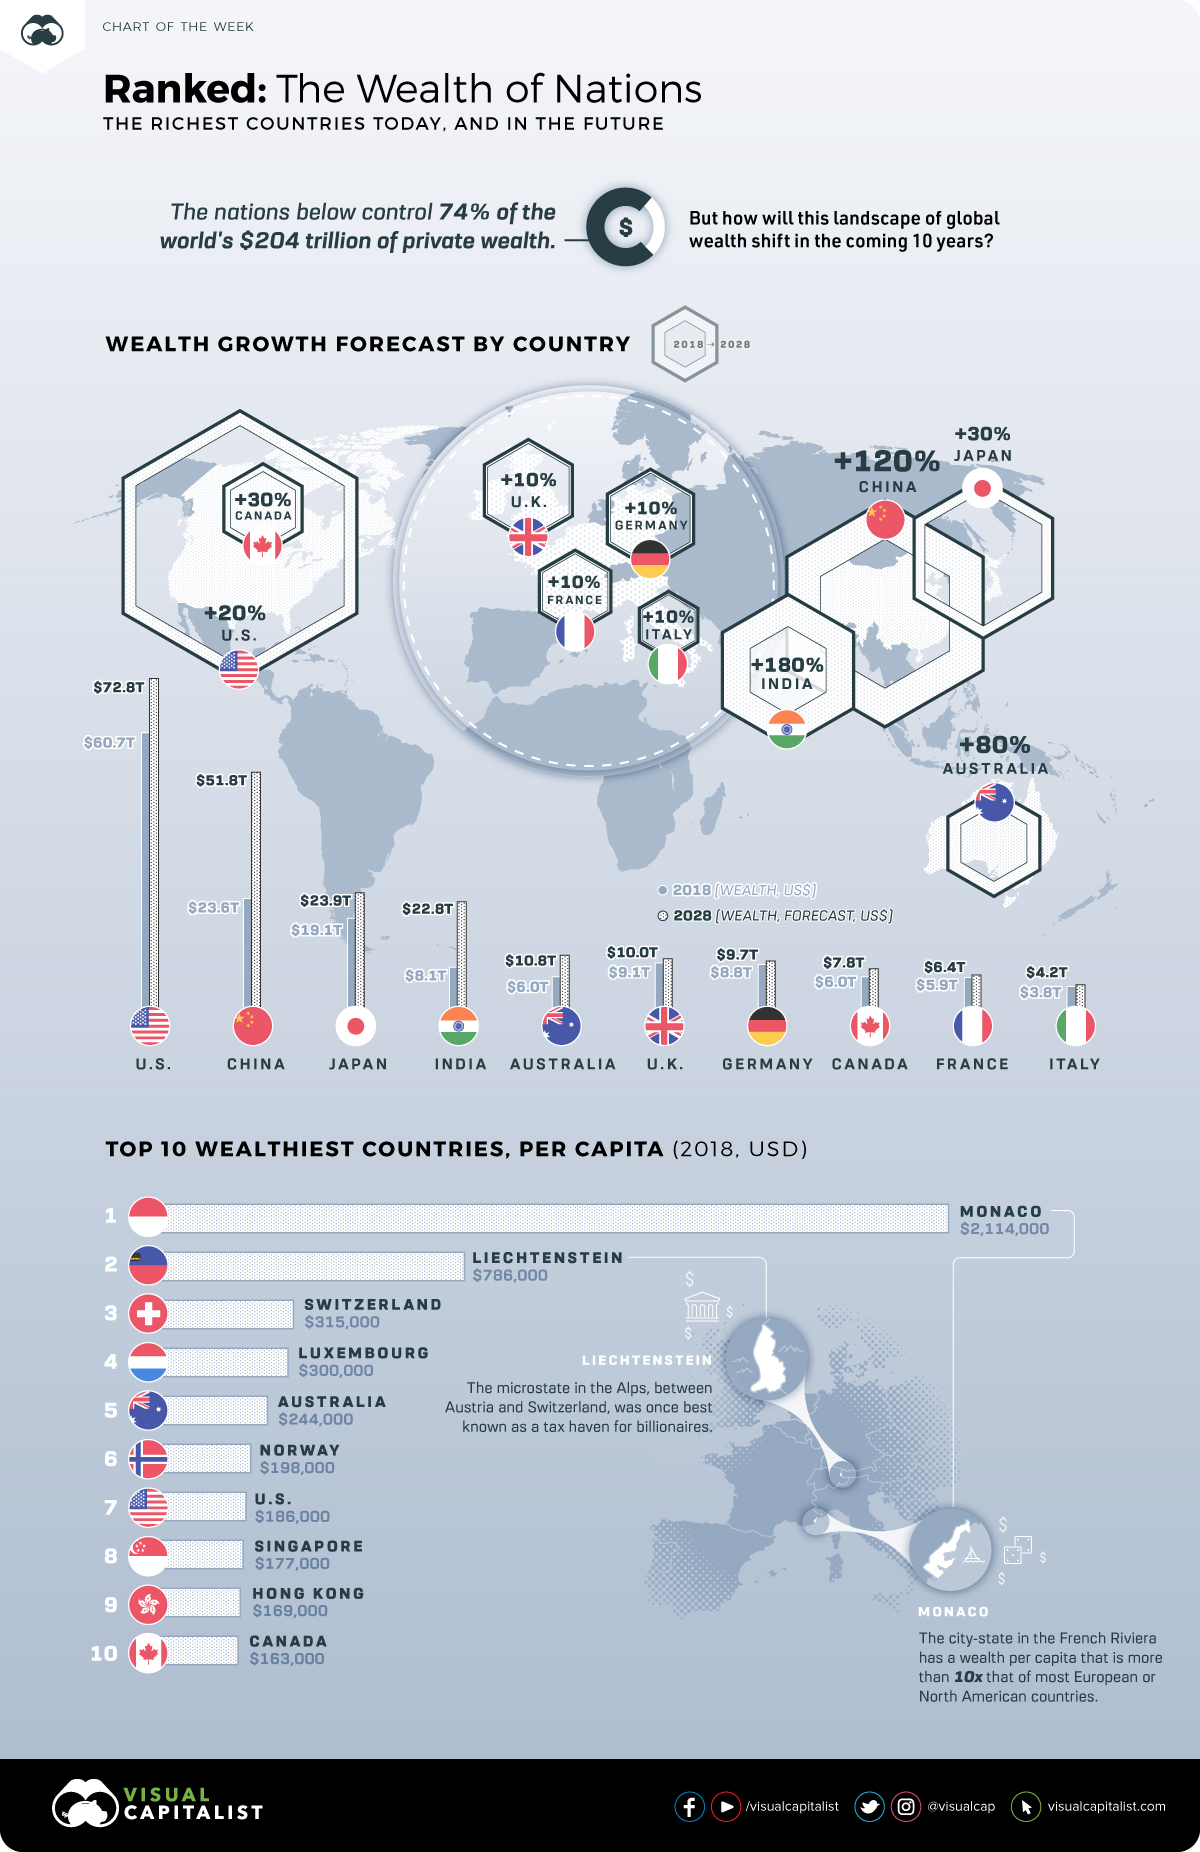
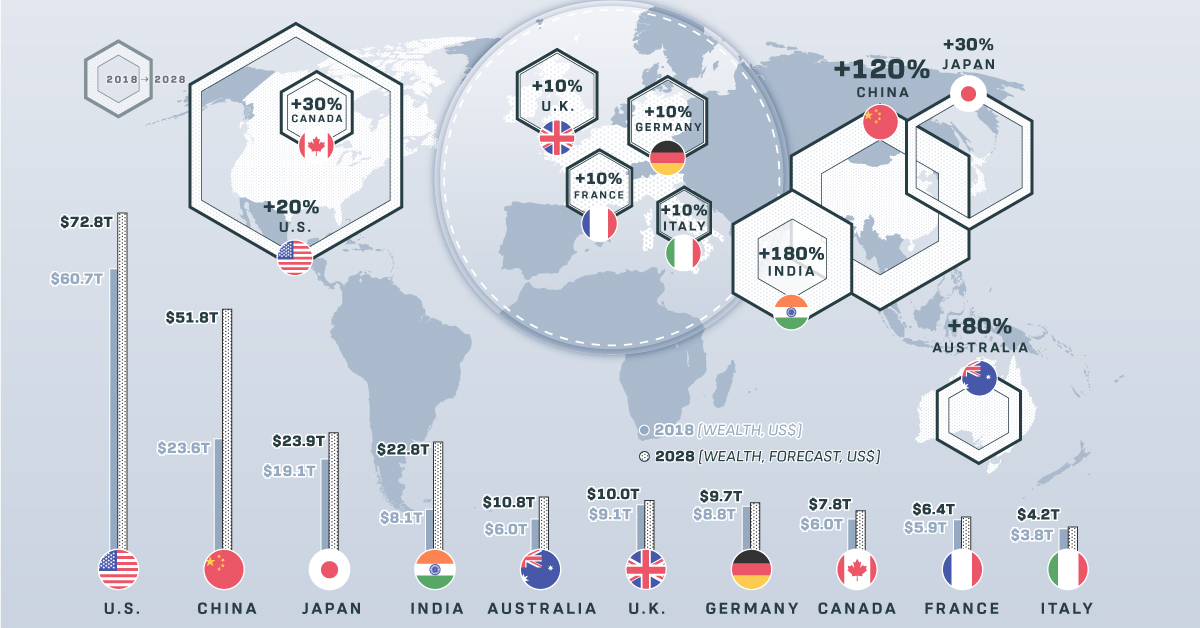
Using data from the Global Wealth Migration Review, here are the 10 wealthiest nations both now and as forecasted in 2028.
| Rank | Country | Wealth (2018) | Wealth (2028F) | Approx. Growth |
|---|---|---|---|---|
| #1 | 🇺🇸 United States | $60.7 trillion | $72.8 trillion | 20% |
| #2 | 🇨🇳 China | $23.6 trillion | $51.8 trillion | 120% |
| #3 | 🇯🇵 Japan | $19.1 trillion | $24.9 trillion | 30% |
| #4 | 🇮🇳 India | $8.1 trillion | $22.8 trillion | 180% |
| #5 | 🇦🇺 Australia | $6.0 trillion | $10.8 trillion | 80% |
| #6 | 🇬🇧 United Kingdom | $9.1 trillion | $10.0 trillion | 10% |
| #7 | 🇩🇪 Germany | $8.8 trillion | $9.7 trillion | 10% |
| #8 | 🇨🇦 Canada | $6.0 trillion | $7.8 trillion | 30% |
| #9 | 🇫🇷 France | $5.9 trillion | $6.4 trillion | 10% |
| #10 | 🇮🇹 Italy | $3.8 trillion | $4.2 trillion | 10% |
It’s worth noting that these figures are meant to represent wealth, which is defined as the total amount of private wealth held by individuals in each country. It includes assets like property, cash, equities, and business interests, minus any liabilities.
China has been the best performing wealth market in the last decade, and these projections show the country as continuing on that track. In fact, both China and India are expected to see triple-digit growth in private wealth between now and 2028.
As far as developed countries go, it’s not surprising that growth rates are much more modest. In Europe, countries like Great Britain, Germany, France, and Italy are only expected to add 10% to private wealth in 10 years, while Canada (30%) and the U.S. (20%) do marginally better.
One notable exception here is Australia, which is expected to add 80% to private wealth over the timeframe – and it will leapfrog both Germany and the U.K. in the rankings in the process.
Wealth per Capita
Here’s a look at the wealth of nations in a different way, this time with numbers adjusted on a per capita basis.
| Rank | Country | Est. Population | Wealth per capita (2018) |
|---|---|---|---|
| #1 | 🇲🇨 Monaco | 38,695 | $2,114,000 |
| #2 | 🇱🇮 Liechtenstein | 37,810 | $786,000 |
| #3 | 🇨🇭 Switzerland | 8,420,000 | $315,000 |
| #4 | 🇱🇺 Luxembourg | 590,667 | $300,000 |
| #5 | 🇦🇺 Australia | 24,600,000 | $244,000 |
| #6 | 🇳🇴 Norway | 5,258,000 | $198,000 |
| #7 | 🇺🇸 United States | 327,200,000 | $186,000 |
| #8 | 🇸🇬 Singapore | 5,612,000 | $177,000 |
| #9 | 🇭🇰 Hong Kong | 7,392,000 | $169,000 |
| #10 | 🇨🇦 Canada | 36,540,000 | $163,000 |
When using per capita numbers, it’s absolutely no contest.
Monaco, the city-state on the French Riviera, is a money magnet with $2.1 million of private wealth per citizen. This means the average Monacan is at least 10 times richer than the average North American or European.
Liechtenstein, a microstate that sits in the Alps between Switzerland and Austria, also has a high average wealth of $786,000 per person. Like Monaco, its population is well under 50,000 people.
Finally, it’s worth mentioning that three countries on the per capita list also made the overall list. Put another way, the countries of Australia, Canada, and the United States can all claim to be among the wealthiest of nations in both absolute and per capita terms.


Money
Charted: Which City Has the Most Billionaires in 2024?
Just two countries account for half of the top 20 cities with the most billionaires. And the majority of the other half are found in Asia.


Charted: Which Country Has the Most Billionaires in 2024?
This was originally posted on our Voronoi app. Download the app for free on iOS or Android and discover incredible data-driven charts from a variety of trusted sources.
Some cities seem to attract the rich. Take New York City for example, which has 340,000 high-net-worth residents with investable assets of more than $1 million.
But there’s a vast difference between being a millionaire and a billionaire. So where do the richest of them all live?
Using data from the Hurun Global Rich List 2024, we rank the top 20 cities with the highest number of billionaires in 2024.
A caveat to these rich lists: sources often vary on figures and exact rankings. For example, in last year’s reports, Forbes had New York as the city with the most billionaires, while the Hurun Global Rich List placed Beijing at the top spot.
Ranked: Top 20 Cities with the Most Billionaires in 2024
The Chinese economy’s doldrums over the course of the past year have affected its ultra-wealthy residents in key cities.
Beijing, the city with the most billionaires in 2023, has not only ceded its spot to New York, but has dropped to #4, overtaken by London and Mumbai.
| Rank | City | Billionaires | Rank Change YoY |
|---|---|---|---|
| 1 | 🇺🇸 New York | 119 | +1 |
| 2 | 🇬🇧 London | 97 | +3 |
| 3 | 🇮🇳 Mumbai | 92 | +4 |
| 4 | 🇨🇳 Beijing | 91 | -3 |
| 5 | 🇨🇳 Shanghai | 87 | -2 |
| 6 | 🇨🇳 Shenzhen | 84 | -2 |
| 7 | 🇭🇰 Hong Kong | 65 | -1 |
| 8 | 🇷🇺 Moscow | 59 | No Change |
| 9 | 🇮🇳 New Delhi | 57 | +6 |
| 10 | 🇺🇸 San Francisco | 52 | No Change |
| 11 | 🇹🇭 Bangkok | 49 | +2 |
| 12 | 🇹🇼 Taipei | 45 | +2 |
| 13 | 🇫🇷 Paris | 44 | -2 |
| 14 | 🇨🇳 Hangzhou | 43 | -5 |
| 15 | 🇸🇬 Singapore | 42 | New to Top 20 |
| 16 | 🇨🇳 Guangzhou | 39 | -4 |
| 17T | 🇮🇩 Jakarta | 37 | +1 |
| 17T | 🇧🇷 Sao Paulo | 37 | No Change |
| 19T | 🇺🇸 Los Angeles | 31 | No Change |
| 19T | 🇰🇷 Seoul | 31 | -3 |
In fact all Chinese cities on the top 20 list have lost billionaires between 2023–24. Consequently, they’ve all lost ranking spots as well, with Hangzhou seeing the biggest slide (-5) in the top 20.
Where China lost, all other Asian cities—except Seoul—in the top 20 have gained ranks. Indian cities lead the way, with New Delhi (+6) and Mumbai (+3) having climbed the most.
At a country level, China and the U.S combine to make up half of the cities in the top 20. They are also home to about half of the world’s 3,200 billionaire population.
In other news of note: Hurun officially counts Taylor Swift as a billionaire, estimating her net worth at $1.2 billion.

-

 Education1 week ago
How Hard Is It to Get Into an Ivy League School?
-

 Technology2 weeks ago
Ranked: Semiconductor Companies by Industry Revenue Share
-

 Markets2 weeks ago
Ranked: The World’s Top Flight Routes, by Revenue
-

 Demographics2 weeks ago
Population Projections: The World’s 6 Largest Countries in 2075
-

 Markets2 weeks ago
The Top 10 States by Real GDP Growth in 2023
-

 Demographics2 weeks ago
The Smallest Gender Wage Gaps in OECD Countries
-

 Economy2 weeks ago
Where U.S. Inflation Hit the Hardest in March 2024
-

 Green2 weeks ago
Top Countries By Forest Growth Since 2001