Money
The Best and Worst Performing Wealth Markets in the Last 10 Years
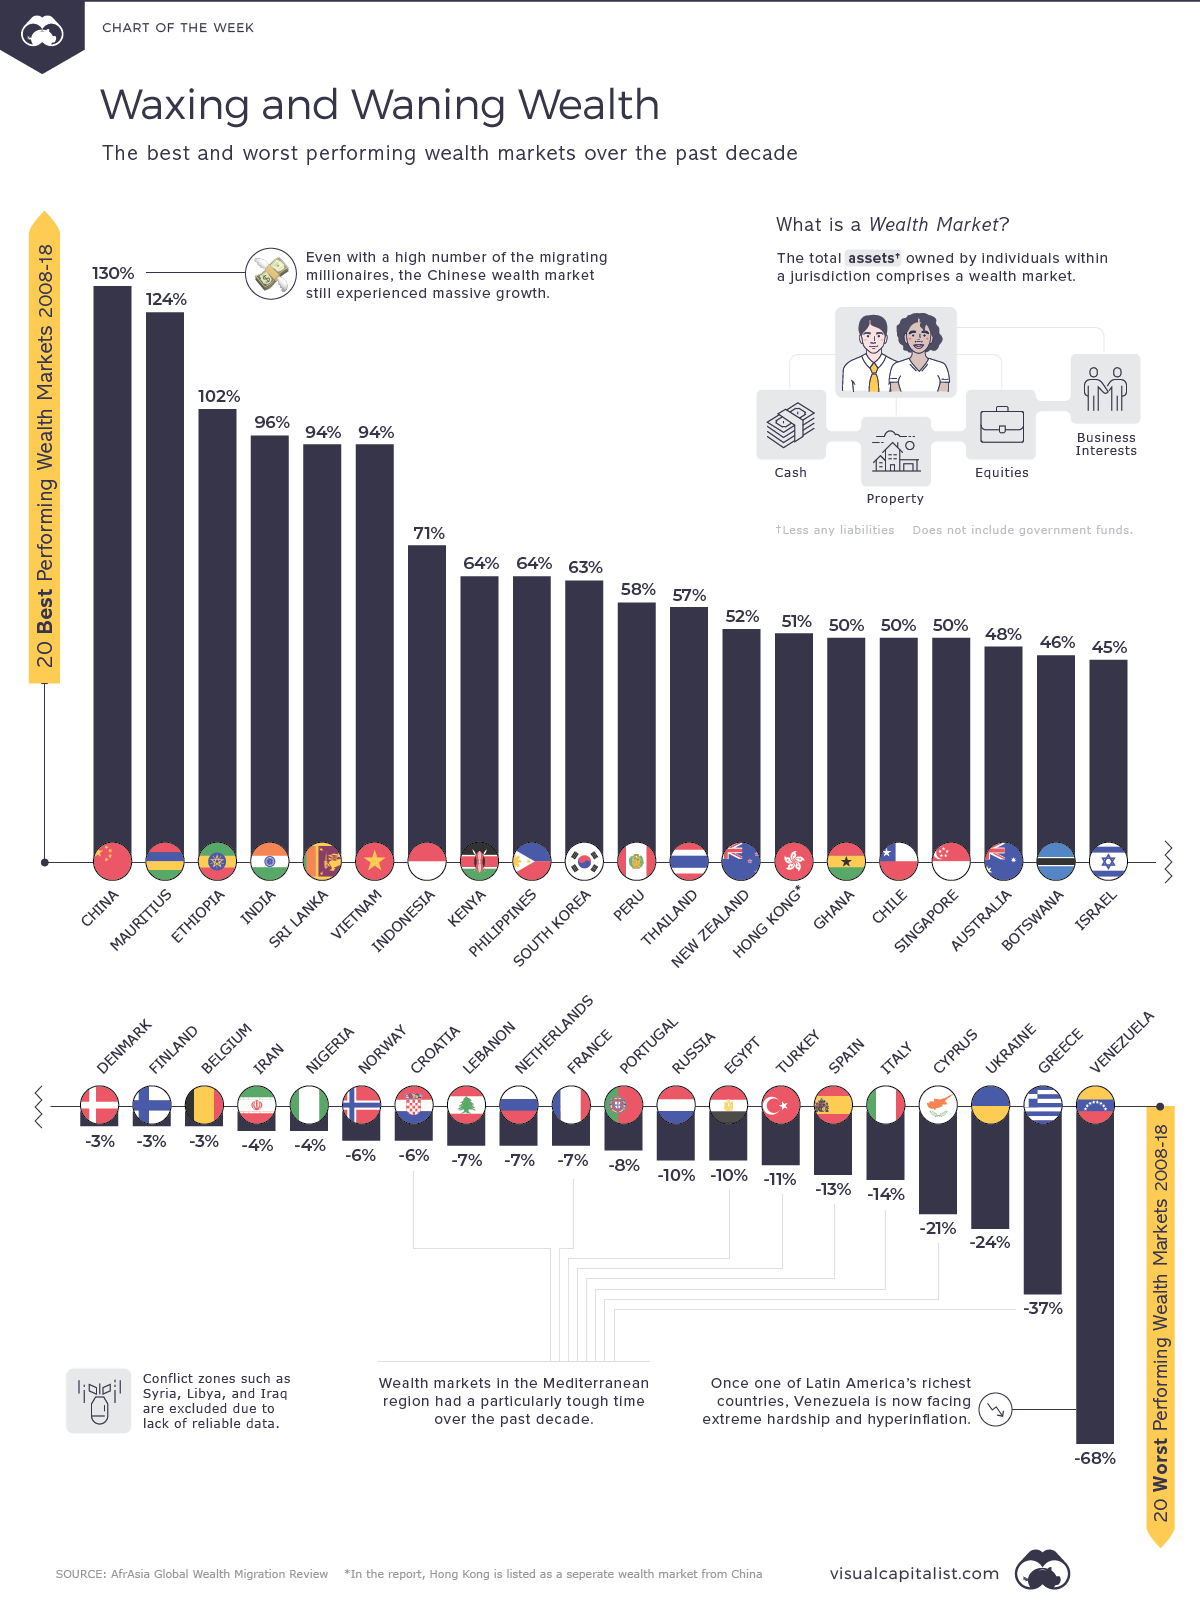
The Best and Worst Performing Wealth Markets
A lot can change in a decade.
Ten years ago, the collapse of Lehman Brothers sent the world’s financial markets into a tailspin, a catalyst for years of economic uncertainty.
At the same time, China’s robust GDP growth was reaching a fever pitch. The country was turning into a wealth creation machine, creating millions of newly-minted millionaires who would end up having a huge impact on wealth markets around the world.
The Ups and Downs of Wealth Markets (2008-2018)
Today’s graphic, using data from the Global Wealth Migration Review, looks at national wealth markets, and how they’ve changed since 2008.
Each wealth market is calculated from the sum of individual assets within the jurisdiction, accounting for the value of cash, property, equity, and business interests owned by people in the country. Just like other kinds of markets, wealth can grow or shrink over time.
Here are a few countries and regions that stand out in the report:
Developing Asian Economies
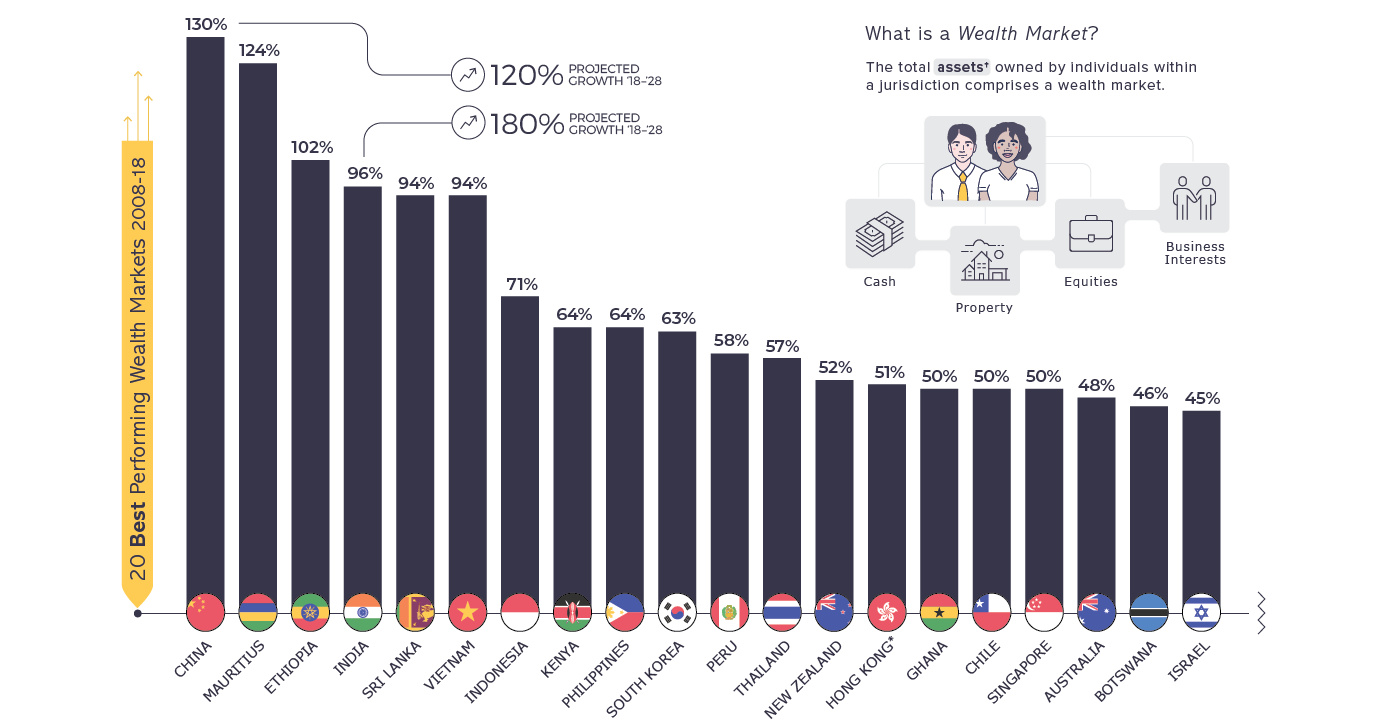
In terms of sheer wealth growth, nothing comes close to countries like China and India. The size of these markets, combined with rapid economic growth, have resulted in triple-digit gains over the last 10 years.
For the world’s two most populous countries, it’s a trend that is expected to continue into the next decade, despite the fact that many millionaire residents are migrating to different jurisdictions.
Mediterranean Malaise
European nations saw very little growth over the past decade, but the Mediterranean region was particularly hard-hit. In fact, eight of the 20 worst performing wealth markets over the last decade are located along the Mediterranean coast:
| Rank (Out of 90) | Country | % Growth (2008-2018) |
|---|---|---|
| 89 | 🇬🇷 Greece | -37% |
| 87 | 🇨🇾 Cyprus | -21% |
| 86 | 🇮🇹 Italy | -14% |
| 85 | 🇪🇸 Spain | -13% |
| 84 | 🇹🇷 Turkey | -11% |
| 82 | 🇪🇬 Egypt | -10% |
| 80 | 🇫🇷 France | -7% |
| 76 | 🇭🇷 Croatia | -6% |
European Bright Spots
There were some bright spots in Europe during this same time period. Malta, Ireland, and Monaco all achieved positive wealth growth at rates higher than 30% over the last 10 years.
Australia
While it’s expected to see rapidly-growing economies as prolific producers of wealth, it is much more surprising when mature markets perform so strongly. Singapore and New Zealand fall under that category, as does Australia, which was already a large, mature wealth market.
Australia recently surpassed both Canada and France to become the seventh largest wealth market in the world, and last year alone, over 12,000 millionaires migrated there.
Venezuela
The long-term economic slide of Venezuela has been well documented, and it comes as no surprise that the country saw extreme contraction of wealth over the last decade. Since war-torn countries are not included in the report, Venezuela ranked 90th, which is dead-last on a global basis.
Short Term, Long Term
In 2018, global wealth actually slumped by 5%, dropping from $215 trillion to $204 trillion.
All 90 countries tracked by the report experienced negative growth in wealth, as global stock and property markets dipped. Here’s a look at the wealth markets that were the hardest hit over the past year:
| Wealth Market | Wealth growth (2017 -2018) |
|---|---|
| 🇻🇪 Venezuela | -25% |
| 🇹🇷 Turkey | -23% |
| 🇦🇷 Argentina | -20% |
| 🇵🇰 Pakistan | -15% |
| 🇦🇴 Angola | -15% |
| 🇺🇦 Ukraine | -13% |
| 🇫🇷 France | -12% |
| 🇷🇺 Russia | -12% |
| 🇮🇷 Iran | -12% |
| 🇶🇦 Qatar | -12% |
The future outlook is rosier. Global wealth is expected to rise by 43% over the next decade, reaching $291 trillion by 2028. If current trends play out as expected, Vietnam could likely top this list a decade from now with a staggering 200% growth rate.


Money
Charted: Which City Has the Most Billionaires in 2024?
Just two countries account for half of the top 20 cities with the most billionaires. And the majority of the other half are found in Asia.


Charted: Which Country Has the Most Billionaires in 2024?
This was originally posted on our Voronoi app. Download the app for free on iOS or Android and discover incredible data-driven charts from a variety of trusted sources.
Some cities seem to attract the rich. Take New York City for example, which has 340,000 high-net-worth residents with investable assets of more than $1 million.
But there’s a vast difference between being a millionaire and a billionaire. So where do the richest of them all live?
Using data from the Hurun Global Rich List 2024, we rank the top 20 cities with the highest number of billionaires in 2024.
A caveat to these rich lists: sources often vary on figures and exact rankings. For example, in last year’s reports, Forbes had New York as the city with the most billionaires, while the Hurun Global Rich List placed Beijing at the top spot.
Ranked: Top 20 Cities with the Most Billionaires in 2024
The Chinese economy’s doldrums over the course of the past year have affected its ultra-wealthy residents in key cities.
Beijing, the city with the most billionaires in 2023, has not only ceded its spot to New York, but has dropped to #4, overtaken by London and Mumbai.
| Rank | City | Billionaires | Rank Change YoY |
|---|---|---|---|
| 1 | 🇺🇸 New York | 119 | +1 |
| 2 | 🇬🇧 London | 97 | +3 |
| 3 | 🇮🇳 Mumbai | 92 | +4 |
| 4 | 🇨🇳 Beijing | 91 | -3 |
| 5 | 🇨🇳 Shanghai | 87 | -2 |
| 6 | 🇨🇳 Shenzhen | 84 | -2 |
| 7 | 🇭🇰 Hong Kong | 65 | -1 |
| 8 | 🇷🇺 Moscow | 59 | No Change |
| 9 | 🇮🇳 New Delhi | 57 | +6 |
| 10 | 🇺🇸 San Francisco | 52 | No Change |
| 11 | 🇹🇭 Bangkok | 49 | +2 |
| 12 | 🇹🇼 Taipei | 45 | +2 |
| 13 | 🇫🇷 Paris | 44 | -2 |
| 14 | 🇨🇳 Hangzhou | 43 | -5 |
| 15 | 🇸🇬 Singapore | 42 | New to Top 20 |
| 16 | 🇨🇳 Guangzhou | 39 | -4 |
| 17T | 🇮🇩 Jakarta | 37 | +1 |
| 17T | 🇧🇷 Sao Paulo | 37 | No Change |
| 19T | 🇺🇸 Los Angeles | 31 | No Change |
| 19T | 🇰🇷 Seoul | 31 | -3 |
In fact all Chinese cities on the top 20 list have lost billionaires between 2023–24. Consequently, they’ve all lost ranking spots as well, with Hangzhou seeing the biggest slide (-5) in the top 20.
Where China lost, all other Asian cities—except Seoul—in the top 20 have gained ranks. Indian cities lead the way, with New Delhi (+6) and Mumbai (+3) having climbed the most.
At a country level, China and the U.S combine to make up half of the cities in the top 20. They are also home to about half of the world’s 3,200 billionaire population.
In other news of note: Hurun officially counts Taylor Swift as a billionaire, estimating her net worth at $1.2 billion.

-

 Debt1 week ago
How Debt-to-GDP Ratios Have Changed Since 2000
-

 Countries2 weeks ago
Population Projections: The World’s 6 Largest Countries in 2075
-

 Markets2 weeks ago
The Top 10 States by Real GDP Growth in 2023
-

 Demographics2 weeks ago
The Smallest Gender Wage Gaps in OECD Countries
-

 United States2 weeks ago
Where U.S. Inflation Hit the Hardest in March 2024
-

 Green2 weeks ago
Top Countries By Forest Growth Since 2001
-

 United States2 weeks ago
Ranked: The Largest U.S. Corporations by Number of Employees
-

 Maps2 weeks ago
The Largest Earthquakes in the New York Area (1970-2024)