Markets
Visualizing S&P 500 Performance in 2022, by Sector
Article/Editing:
Visualizing S&P 500 Performance in 2022, by Sector
Tracking indexes over the course of a year reveals a lot about market trends and sentiment. The S&P 500’s performance over the course of 2022 is a great example.
Throughout the year, inflation rates have remained high and interest rates have likewise been climbing around the world. Accompanied by the looming threat of a recession, some sectors have been hit harder than others.
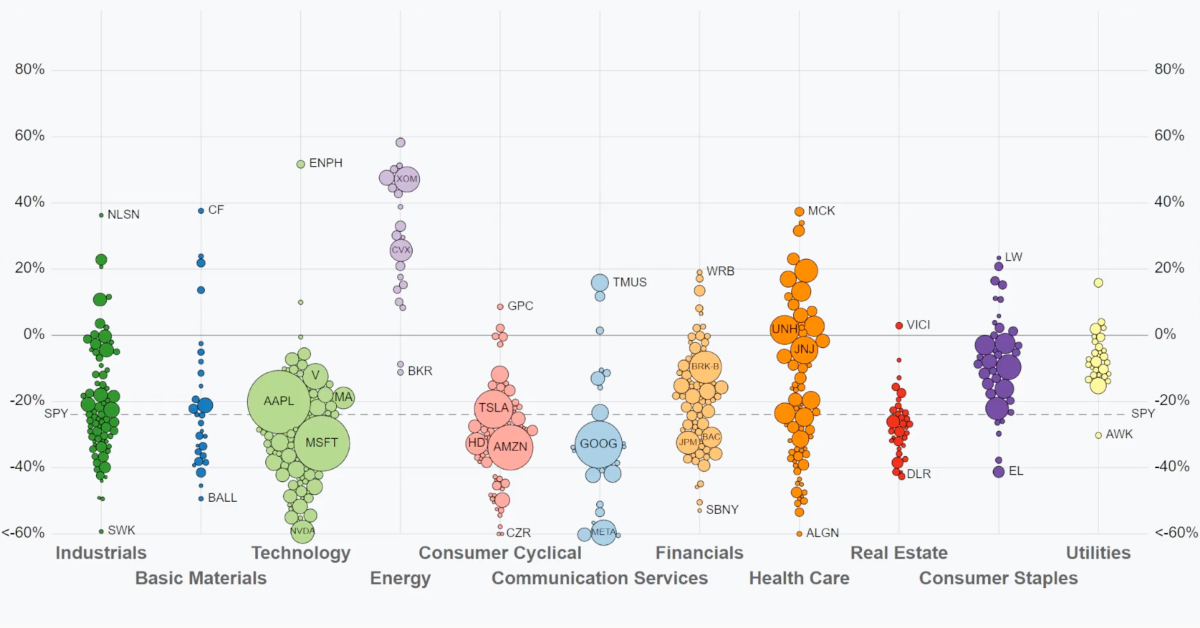
The above visualization from Jan Varsava shows U.S. dividend-adjusted stock performance for each company in the S&P 500 index in 2022, from the start of the year through the end of September.
S&P 500 Performance (Jan 1 to Sep 30, 2022)
In 2022, the S&P 500 index dropped -23.9% through the end of September. Let’s take a look at some of the major trends from this year’s stock market.
| S&P 500 Sector Performance | 2022 Q1–Q3 |
|---|---|
| Energy | +30.71% |
| Utilities | -8.58% |
| Consumer Staples | -13.52% |
| Health Care | -14.15% |
| Industrials | -21.72% |
| Financials | -22.41% |
| Basic Materials | -24.90% |
| Consumer Cyclical | -30.32% |
| Real Estate | -30.43% |
| Technology | -31.93% |
| Communication Services | -39.43% |
Winners
The energy sector has been the noticeable standout and performed significantly well since the beginning of the year, as sanctions surrounding Russia impacted oil and gas supplies resulting in sharp price increases.
Top performing energy stocks as of September 30th, 2022 included Occidental Petroleum (OXY) up 112% year to date (YTD), and Marathon Petroleum (MPC) which rose 52% YTD.
Traditional defensive sectors such as healthcare, consumer staples, and utilities, although down for the year, also performed better than the overall index.
Losers
Growth stocks in both technology and communication services underperformed since the beginning of this year, as the value of future earnings were impacted by rising interest rates increasing the cost of capital.
Real estate, consumer cyclical (or consumer discretionary), and materials also underperformed compared to the overall index.
The trends are reflective of the fact that value stocks like energy and healthcare historically outperform growth stocks during periods of rising rates, though there are many varying factors that can alter performance.
Major Shifts in Q4
But as October has shown, the market is far from settled.
$META plummets a whopping 25%. $AMZN getting crushed on earnings after hours. Outside of big tech the market has been holding up ok. pic.twitter.com/w9TRz8ZOkH
— Jan @ Chartfleau (@chartfleau) October 27, 2022
Lower-than-expected earnings and overspending caused Meta Platforms, Inc. (META) to drop 24% over five days and Amazon to drop 13%.
And the final impact of rising interest rates have yet to be fully felt, though indexes generally fare well in the year following. Since 1927, the average S&P 500 return sits at around 11.5% in the 12 months following peak inflation.

This article was published as a part of Visual Capitalist's Creator Program, which features data-driven visuals from some of our favorite Creators around the world.


Economy
Economic Growth Forecasts for G7 and BRICS Countries in 2024
The IMF has released its economic growth forecasts for 2024. How do the G7 and BRICS countries compare?


G7 & BRICS Real GDP Growth Forecasts for 2024
The International Monetary Fund’s (IMF) has released its real gross domestic product (GDP) growth forecasts for 2024, and while global growth is projected to stay steady at 3.2%, various major nations are seeing declining forecasts.
This chart visualizes the 2024 real GDP growth forecasts using data from the IMF’s 2024 World Economic Outlook for G7 and BRICS member nations along with Saudi Arabia, which is still considering an invitation to join the bloc.
Get the Key Insights of the IMF’s World Economic Outlook
Want a visual breakdown of the insights from the IMF’s 2024 World Economic Outlook report?
This visual is part of a special dispatch of the key takeaways exclusively for VC+ members.
Get the full dispatch of charts by signing up to VC+.
Mixed Economic Growth Prospects for Major Nations in 2024
Economic growth projections by the IMF for major nations are mixed, with the majority of G7 and BRICS countries forecasted to have slower growth in 2024 compared to 2023.
Only three BRICS-invited or member countries, Saudi Arabia, the UAE, and South Africa, have higher projected real GDP growth rates in 2024 than last year.
| Group | Country | Real GDP Growth (2023) | Real GDP Growth (2024P) |
|---|---|---|---|
| G7 | 🇺🇸 U.S. | 2.5% | 2.7% |
| G7 | 🇨🇦 Canada | 1.1% | 1.2% |
| G7 | 🇯🇵 Japan | 1.9% | 0.9% |
| G7 | 🇫🇷 France | 0.9% | 0.7% |
| G7 | 🇮🇹 Italy | 0.9% | 0.7% |
| G7 | 🇬🇧 UK | 0.1% | 0.5% |
| G7 | 🇩🇪 Germany | -0.3% | 0.2% |
| BRICS | 🇮🇳 India | 7.8% | 6.8% |
| BRICS | 🇨🇳 China | 5.2% | 4.6% |
| BRICS | 🇦🇪 UAE | 3.4% | 3.5% |
| BRICS | 🇮🇷 Iran | 4.7% | 3.3% |
| BRICS | 🇷🇺 Russia | 3.6% | 3.2% |
| BRICS | 🇪🇬 Egypt | 3.8% | 3.0% |
| BRICS-invited | 🇸🇦 Saudi Arabia | -0.8% | 2.6% |
| BRICS | 🇧🇷 Brazil | 2.9% | 2.2% |
| BRICS | 🇿🇦 South Africa | 0.6% | 0.9% |
| BRICS | 🇪🇹 Ethiopia | 7.2% | 6.2% |
| 🌍 World | 3.2% | 3.2% |
China and India are forecasted to maintain relatively high growth rates in 2024 at 4.6% and 6.8% respectively, but compared to the previous year, China is growing 0.6 percentage points slower while India is an entire percentage point slower.
On the other hand, four G7 nations are set to grow faster than last year, which includes Germany making its comeback from its negative real GDP growth of -0.3% in 2023.
Faster Growth for BRICS than G7 Nations
Despite mostly lower growth forecasts in 2024 compared to 2023, BRICS nations still have a significantly higher average growth forecast at 3.6% compared to the G7 average of 1%.
While the G7 countries’ combined GDP is around $15 trillion greater than the BRICS nations, with continued higher growth rates and the potential to add more members, BRICS looks likely to overtake the G7 in economic size within two decades.
BRICS Expansion Stutters Before October 2024 Summit
BRICS’ recent expansion has stuttered slightly, as Argentina’s newly-elected president Javier Milei declined its invitation and Saudi Arabia clarified that the country is still considering its invitation and has not joined BRICS yet.
Even with these initial growing pains, South Africa’s Foreign Minister Naledi Pandor told reporters in February that 34 different countries have submitted applications to join the growing BRICS bloc.
Any changes to the group are likely to be announced leading up to or at the 2024 BRICS summit which takes place October 22-24 in Kazan, Russia.
Get the Full Analysis of the IMF’s Outlook on VC+
This visual is part of an exclusive special dispatch for VC+ members which breaks down the key takeaways from the IMF’s 2024 World Economic Outlook.
For the full set of charts and analysis, sign up for VC+.

-

 Markets1 week ago
U.S. Debt Interest Payments Reach $1 Trillion
-

 Markets2 weeks ago
Ranked: The Most Valuable Housing Markets in America
-

 Money2 weeks ago
Which States Have the Highest Minimum Wage in America?
-

 AI2 weeks ago
Ranked: Semiconductor Companies by Industry Revenue Share
-

 Markets2 weeks ago
Ranked: The World’s Top Flight Routes, by Revenue
-

 Countries2 weeks ago
Population Projections: The World’s 6 Largest Countries in 2075
-

 Markets2 weeks ago
The Top 10 States by Real GDP Growth in 2023
-

 Money2 weeks ago
The Smallest Gender Wage Gaps in OECD Countries