Energy
The World’s Projected Energy Mix, 2018-2040
The World’s Projected Energy Mix, from 2018-2040
Since 1977, the International Energy Agency (IEA) has put together the World Energy Outlook, a highly anticipated annual report that looks towards the future of energy production and consumption on a global basis.
In the latest edition, the report dives into two very different policy scenarios that help illustrate the choices and consequences we have ahead of us.
In this post, we’ll look at each policy scenario and then dive into the associated numbers for each, showing how they affect the projected global energy mix from 2018 to 2040.
The Policy Scenarios
The IEA bases its projections based on two policy scenarios:
- The Stated Policies Scenario
This scenario is intended to reflect the impact of existing public policy frameworks, including announced policy intentions. - The Sustainable Development Scenario
This scenario outlines a major transformation of the global energy system, aligned with achieving the energy-related components of the United Nations’ Sustainable Development Goals (SDGs), such as reducing carbon emissions.
Neither scenario is technically a forecast; the IEA sees both scenarios as being possible.
However, this data can still provide a useful starting point for decision makers and investors looking to read the tea leaves. Will countries stick to their guns on their current plans, or will those plans be scrapped in the name of bolder, sustainable initiatives?
Scenario 1: Stated Policies
Today’s chart shows data corresponding to this policies scenario, as adjusted by CAPP.
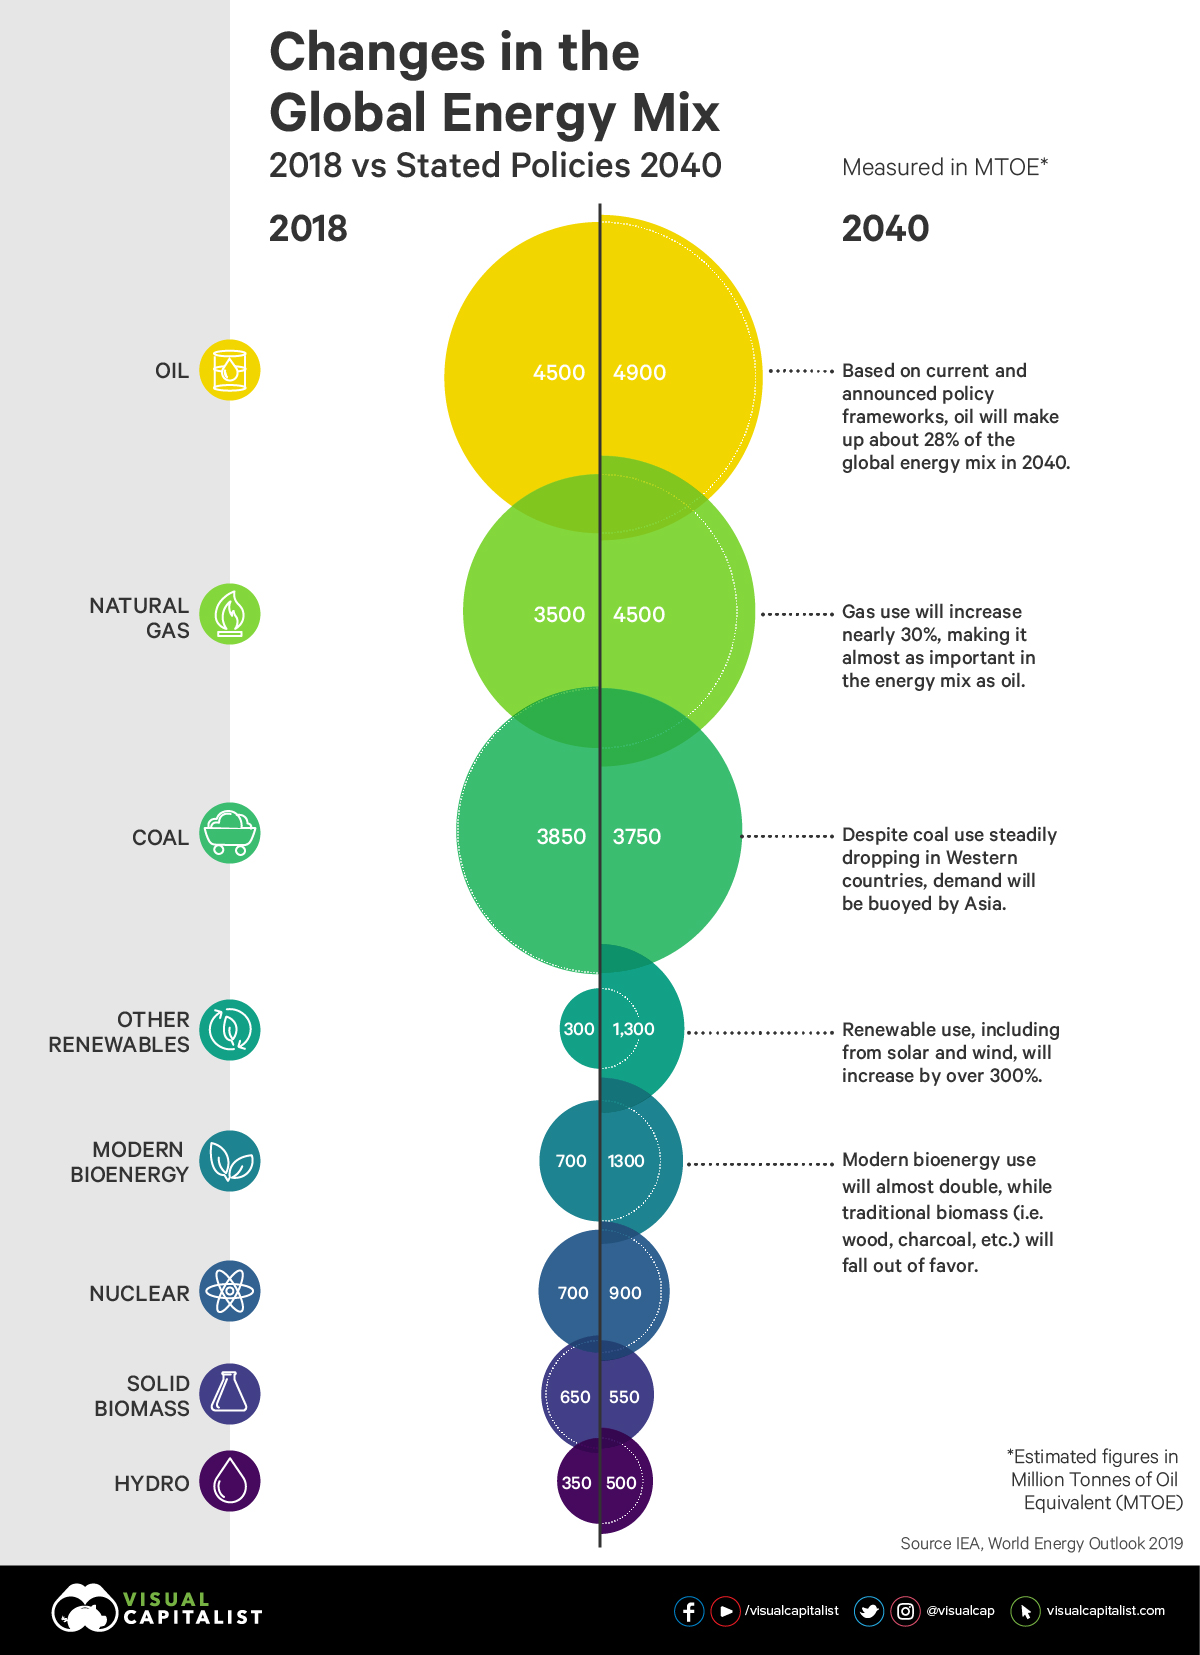
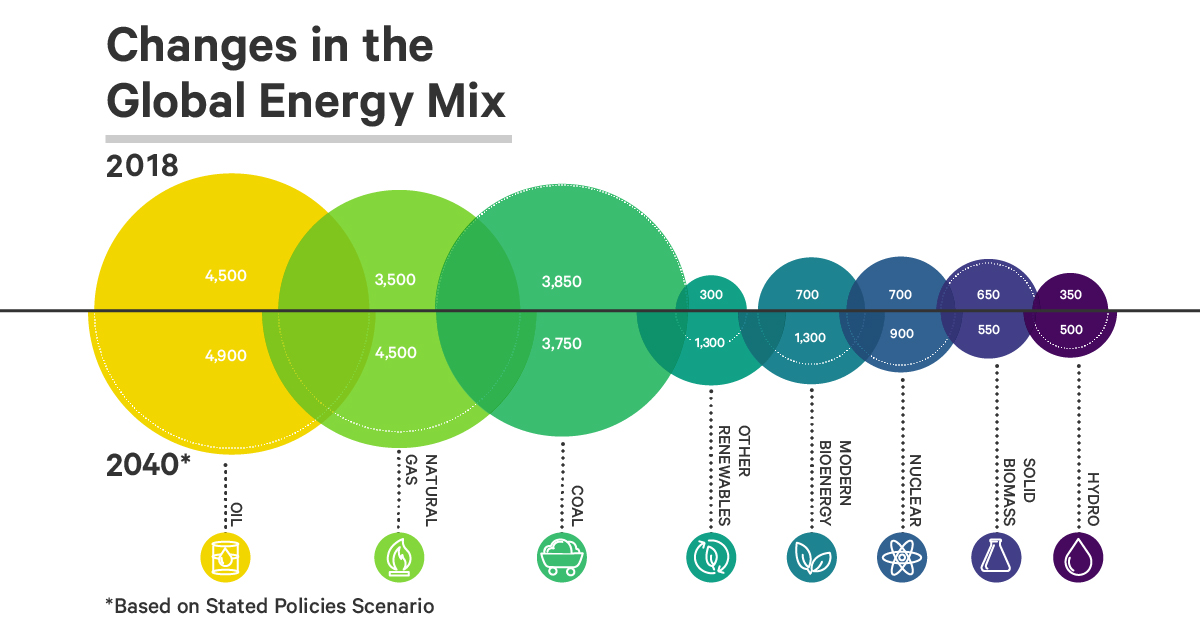
See the energy use data below, shown in terms of Millions of Tonnes of Oil Equivalent (Mtoe):
| 2018 | 2030 | 2040 | Est. % of mix (2040) | |
|---|---|---|---|---|
| Oil | 4,500 | 4,750 | 4,900 | 28% |
| Natural Gas | 3,500 | 3,900 | 4,500 | 25% |
| Coal | 3,850 | 3,900 | 3,750 | 21% |
| Other Renewables | 300 | 750 | 1,300 | 7% |
| Modern Bioenergy | 700 | 1,050 | 1,300 | 7% |
| Nuclear | 700 | 800 | 900 | 5% |
| Solid Biomass | 650 | 600 | 550 | 3% |
| Hydro | 350 | 450 | 500 | 3% |
| Global Total | 14,550 | 16,200 | 17,700 | 100% |
Note: Data is based on CAPP conversion estimates, and is rounded to nearest 50 Mtoe.
In the Stated Policies Scenario, oil will be the largest energy source in 2040, making up about 28% of the global energy mix — and natural gas will be right behind it, for 25% of supply.
Coal consumption, which is decreasing in Western markets, will stay consistent with 2018 levels thanks to growing demand in Asia.
Meanwhile, renewable energy (excl. hydro) will see an impressive renaissance, with this category (which includes wind, solar, geothermal, etc.) increasing its portion in the mix by over 300% over 22 years.
Scenario 2: Sustainable Development
The IEA’s Sustainable Development scenario is very different from the status quo, as shown here:
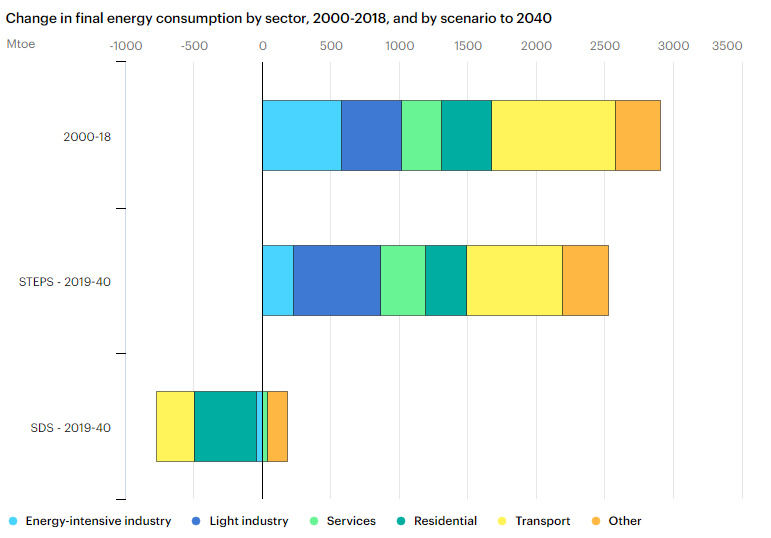
Source: IEA
The contrast between the energy needed in the Stated Policies (STEPS) and Sustainable Development (SDS) projections is stark, going from a 2,500 Mtoe increase to a 800 Mtoe decrease in total consumption, driven by residential and transportation sectors.
Under this scenario, renewable energy use for electricity consumption (incl. hydro) would need to increase by 8,000 TWh more, with ultimately more than half of it in Asia.
| Renewable Energy (Electricity Generation) | 2018 | 2040 | % Increase |
|---|---|---|---|
| Stated Policies | 6,800 TWh | 18,049 TWh | 165% |
| Sustainable Development | 6,800 TWh | 26,065 TWh | 283% |
Under this transformational and ambitious scenario, fossil fuel use would plummet. Coal consumption would drop by roughly 60%, oil consumption by 30%, and the role of natural gas in the energy mix would remain stagnant.
Two Scenarios, One Path
Both scenarios are a possibility, but in reality we will likely find ourselves somewhere in between the two extremes.
This makes these two baselines a helpful place to start for both investors and decision makers. Depending on how you think governments, corporations, and organizations will act, you can then adjust the projections accordingly.


Energy
Charted: 4 Reasons Why Lithium Could Be the Next Gold Rush
Visual Capitalist has partnered with EnergyX to show why drops in prices and growing demand may make now the right time to invest in lithium.


4 Reasons Why You Should Invest in Lithium
Lithium’s importance in powering EVs makes it a linchpin of the clean energy transition and one of the world’s most precious minerals.
In this graphic, Visual Capitalist partnered with EnergyX to explore why now may be the time to invest in lithium.
1. Lithium Prices Have Dropped
One of the most critical aspects of evaluating an investment is ensuring that the asset’s value is higher than its price would indicate. Lithium is integral to powering EVs, and, prices have fallen fast over the last year:
| Date | LiOH·H₂O* | Li₂CO₃** |
|---|---|---|
| Feb 2023 | $76 | $71 |
| March 2023 | $71 | $61 |
| Apr 2023 | $43 | $33 |
| May 2023 | $43 | $33 |
| June 2023 | $47 | $45 |
| July 2023 | $44 | $40 |
| Aug 2023 | $35 | $35 |
| Sept 2023 | $28 | $27 |
| Oct 2023 | $24 | $23 |
| Nov 2023 | $21 | $21 |
| Dec 2023 | $17 | $16 |
| Jan 2024 | $14 | $15 |
| Feb 2024 | $13 | $14 |
Note: Monthly spot prices were taken as close to the 14th of each month as possible.
*Lithium hydroxide monohydrate MB-LI-0033
**Lithium carbonate MB-LI-0029
2. Lithium-Ion Battery Prices Are Also Falling
The drop in lithium prices is just one reason to invest in the metal. Increasing economies of scale, coupled with low commodity prices, have caused the cost of lithium-ion batteries to drop significantly as well.
In fact, BNEF reports that between 2013 and 2023, the price of a Li-ion battery dropped by 82%.
| Year | Price per KWh |
|---|---|
| 2023 | $139 |
| 2022 | $161 |
| 2021 | $150 |
| 2020 | $160 |
| 2019 | $183 |
| 2018 | $211 |
| 2017 | $258 |
| 2016 | $345 |
| 2015 | $448 |
| 2014 | $692 |
| 2013 | $780 |

3. EV Adoption is Sustainable
One of the best reasons to invest in lithium is that EVs, one of the main drivers behind the demand for lithium, have reached a price point similar to that of traditional vehicle.
According to the Kelly Blue Book, Tesla’s average transaction price dropped by 25% between 2022 and 2023, bringing it in line with many other major manufacturers and showing that EVs are a realistic transport option from a consumer price perspective.
| Manufacturer | September 2022 | September 2023 |
|---|---|---|
| BMW | $69,000 | $72,000 |
| Ford | $54,000 | $56,000 |
| Volkswagon | $54,000 | $56,000 |
| General Motors | $52,000 | $53,000 |
| Tesla | $68,000 | $51,000 |
4. Electricity Demand in Transport is Growing
As EVs become an accessible transport option, there’s an investment opportunity in lithium. But possibly the best reason to invest in lithium is that the IEA reports global demand for the electricity in transport could grow dramatically by 2030:
| Transport Type | 2022 | 2025 | 2030 |
|---|---|---|---|
| Buses 🚌 | 23,000 GWh | 50,000 GWh | 130,000 GWh |
| Cars 🚙 | 65,000 GWh | 200,000 GWh | 570,000 GWh |
| Trucks 🛻 | 4,000 GWh | 15,000 GWh | 94,000 GWh |
| Vans 🚐 | 6,000 GWh | 16,000 GWh | 72,000 GWh |
The Lithium Investment Opportunity
Lithium presents a potentially classic investment opportunity. Lithium and battery prices have dropped significantly, and recently, EVs have reached a price point similar to other vehicles. By 2030, the demand for clean energy, especially in transport, will grow dramatically.
With prices dropping and demand skyrocketing, now is the time to invest in lithium.
EnergyX is poised to exploit lithium demand with cutting-edge lithium extraction technology capable of extracting 300% more lithium than current processes.

-

 Lithium4 days ago
Ranked: The Top 10 EV Battery Manufacturers in 2023
Asia dominates this ranking of the world’s largest EV battery manufacturers in 2023.
-

 Energy1 week ago
The World’s Biggest Nuclear Energy Producers
China has grown its nuclear capacity over the last decade, now ranking second on the list of top nuclear energy producers.
-

 Energy1 month ago
The World’s Biggest Oil Producers in 2023
Just three countries accounted for 40% of global oil production last year.
-

 Energy1 month ago
How Much Does the U.S. Depend on Russian Uranium?
Currently, Russia is the largest foreign supplier of nuclear power fuel to the U.S.
-

 Uranium2 months ago
Charted: Global Uranium Reserves, by Country
We visualize the distribution of the world’s uranium reserves by country, with 3 countries accounting for more than half of total reserves.
-

 Energy3 months ago
Visualizing the Rise of the U.S. as Top Crude Oil Producer
Over the last decade, the United States has established itself as the world’s top producer of crude oil, surpassing Saudi Arabia and Russia.


-

 Debt1 week ago
How Debt-to-GDP Ratios Have Changed Since 2000
-

 Markets2 weeks ago
Ranked: The World’s Top Flight Routes, by Revenue
-

 Countries2 weeks ago
Population Projections: The World’s 6 Largest Countries in 2075
-

 Markets2 weeks ago
The Top 10 States by Real GDP Growth in 2023
-

 Demographics2 weeks ago
The Smallest Gender Wage Gaps in OECD Countries
-

 United States2 weeks ago
Where U.S. Inflation Hit the Hardest in March 2024
-

 Green2 weeks ago
Top Countries By Forest Growth Since 2001
-

 United States2 weeks ago
Ranked: The Largest U.S. Corporations by Number of Employees