Mining
Visualizing the Scale and Composition of the Earth’s Crust
Article/Editing:
Visualizing the Scale and Composition of the Earth’s Crust
For as long as humans have been wandering the top of Earth’s crust, we’ve been fascinated with what’s inside.
And Earth’s composition has been vital for our advancement. From finding the right kinds of rocks to make tools, all the way to making efficient batteries and circuit boards, we rely on minerals in Earth’s crust to fuel innovation and technology.
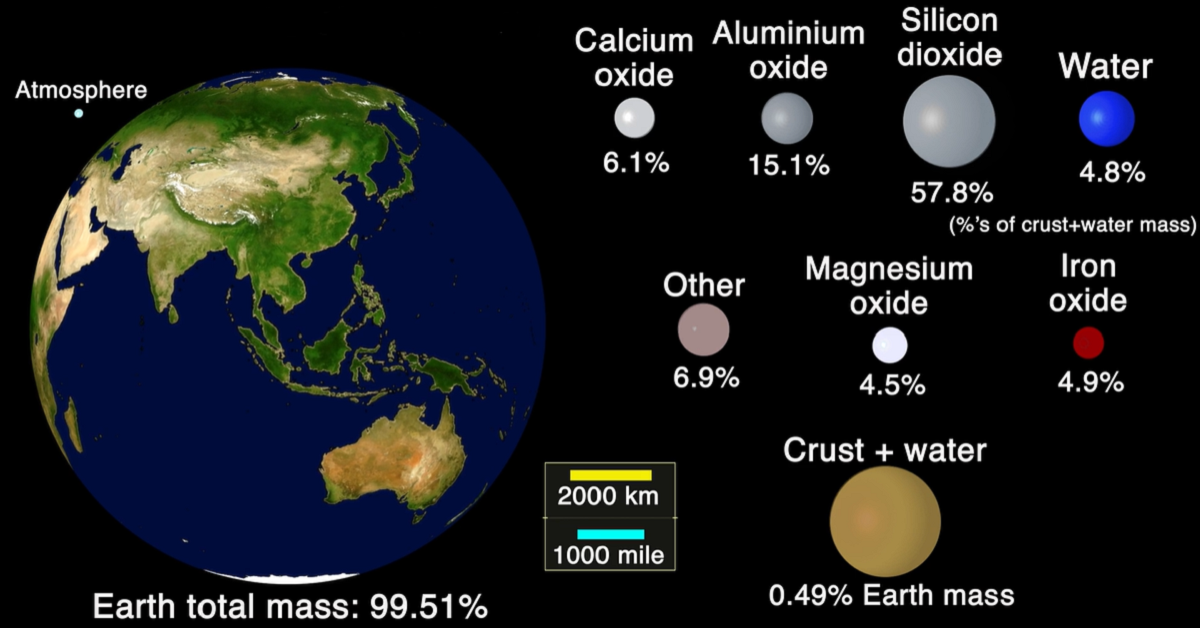
This animation by Dr. James O’Donoghue, a planetary researcher at the Japan Aerospace Exploration Agency (JAXA) and NASA, is a visual comparison of Earth’s outer layers and their major constituents by mass.
What is the Composition of Earth’s Crust?
The combined mass of Earth’s surface water and crust, the stiff outermost layer of our planet, is less than half a percent of the total mass of the Earth.
There are over 90 elements found in Earth’s crust. But only a small handful make up the majority of rocks, minerals, soil, and water we interact with daily.
1. Silicon
Most abundant in the crust is silicon dioxide (SiO2), found in pure form as the mineral quartz. We use quartz in the manufacturing of glass, electronics, and abrasives.
Why is silicon dioxide so abundant? It can easily combine with other elements to form “silicates,” a group of minerals that make up over 90% of Earth’s crust.
Clay is one of the better-known silicates and micas are silicate minerals used in paints and cosmetics to make them sparkle and shimmer.
| Mineral | Major Elements | Percentage of Crust |
|---|---|---|
| Plagioclase Feldspar | O, Si, Al, Ca, Na | 39% |
| Alkali Feldspar | O, Si, Al, Na, K | 12% |
| Quartz | O, Si | 12% |
| Pyroxene | O, Si, Mg, Fe | 11% |
| Amphibole | O, Si, Mg, Fe | 5% |
| Non-silicates | Variable | 8% |
| Micas | O, Si, Al, Mg, Fe, Ca, Na, K | 5% |
| Clay Minerals | O, Si, Al, Mg, Fe, Ca, Na, K | 5% |
| Other Silicates | O, Si | 3% |
2. Aluminum and Calcium
SiO2 bonds very easily with aluminum and calcium, our next most abundant constituents. Together with some sodium and potassium, they form feldspar, a mineral that makes up 41% of rocks on Earth’s surface.
While you may not have heard of feldspar, you use it every day; it’s an important ingredient in ceramics and it lowers the melting point of glass, making it cheaper and easier to produce screens, windows, and drinking glasses.
3. Iron and Magnesium
Iron and magnesium each make up just under 5% of the crust’s mass, but they combine with SiO2 and other elements to form pyroxenes and amphiboles. These two important mineral groups constitute around 16% of crustal rocks.
Maybe the best known of these minerals are the two varieties of jade, jadeite (pyroxene) and nephrite (amphibole). Jade minerals have been prized for their beauty for centuries, and are commonly used in counter-tops, construction, and landscaping.
Some asbestos minerals, now largely banned for their cancer-causing properties, belong to the amphibole mineral group. They were once in high demand for their insulating and fire-retardant properties and were even used in brake pads, cigarette filters, and as artificial snow.
4. Water
Surprisingly, even though it covers almost three quarters of Earth’s surface, water (H2O) makes up less than 5% of the crust’s mass. This is partly because water is significantly less dense than other crustal constituents, meaning it has less mass per volume.
Breaking Earth’s Crust Down by Element
Though there are many different components that form the Earth’s crust, all of the above notably include oxygen.
When breaking down the crust by element, oxygen is indeed the most abundant element at just under half the mass of Earth’s crust. It is followed by silicon, aluminum, iron, calcium, and sodium.
All other remaining elements make up just over 5% of the crust’s mass. But that small section includes all the metals and rare earth elements that we use in construction and technology, which is why discovering and economically extracting them is so crucial.
What Lies Below?
As the crust is only the outermost layer of Earth, there are other layers left to contemplate and discover. While we have never directly interacted with the Earth’s mantle or core, we do know quite a bit about their structure and composition thanks to seismic tomography.
The Upper Mantle
At a few specific spots on Earth, volcanic eruptions and earthquakes have been strong enough to expose pieces of the upper mantle, which are also made of mostly silicates.
The mineral olivine makes up about 55% of the upper mantle composition and causes its greenish color. Pyroxene comes in second at 35%, and calcium-rich feldspar and other calcium and aluminum silicates make up between 5–10%.
Going Even Deeper
Beyond the upper mantle, Earth’s composition is not as well known.
Deep-mantle minerals have only been found on Earth’s surface as components of extra-terrestrial meteorites and as part of diamonds brought up from the deep mantle.
One thing the lower mantle is thought to contain is the silicate mineral bridgmanite, at an abundance of up to 75%. Earth’s core, meanwhile, is believed to be made up of iron and nickel with small amounts of oxygen, silicon, and sulphur.
As technology improves, we will be able to discover more about the mineral and elemental makeup of the Earth and have an even better understanding of the place we all call home.

This article was published as a part of Visual Capitalist's Creator Program, which features data-driven visuals from some of our favorite Creators around the world.


Lithium
Ranked: The Top 10 EV Battery Manufacturers in 2023
Asia dominates this ranking of the world’s largest EV battery manufacturers in 2023.


The Top 10 EV Battery Manufacturers in 2023
This was originally posted on our Voronoi app. Download the app for free on iOS or Android and discover incredible data-driven charts from a variety of trusted sources.
Despite efforts from the U.S. and EU to secure local domestic supply, all major EV battery manufacturers remain based in Asia.
In this graphic we rank the top 10 EV battery manufacturers by total battery deployment (measured in megawatt-hours) in 2023. The data is from EV Volumes.
Chinese Dominance
Contemporary Amperex Technology Co. Limited (CATL) has swiftly risen in less than a decade to claim the title of the largest global battery group.
The Chinese company now has a 34% share of the market and supplies batteries to a range of made-in-China vehicles, including the Tesla Model Y, SAIC’s MG4/Mulan, and various Li Auto models.
| Company | Country | 2023 Production (megawatt-hour) | Share of Total Production |
|---|---|---|---|
| CATL | 🇨🇳 China | 242,700 | 34% |
| BYD | 🇨🇳 China | 115,917 | 16% |
| LG Energy Solution | 🇰🇷 Korea | 108,487 | 15% |
| Panasonic | 🇯🇵 Japan | 56,560 | 8% |
| SK On | 🇰🇷 Korea | 40,711 | 6% |
| Samsung SDI | 🇰🇷 Korea | 35,703 | 5% |
| CALB | 🇨🇳 China | 23,493 | 3% |
| Farasis Energy | 🇨🇳 China | 16,527 | 2% |
| Envision AESC | 🇨🇳 China | 8,342 | 1% |
| Sunwoda | 🇨🇳 China | 6,979 | 1% |
| Other | - | 56,040 | 8% |
In 2023, BYD surpassed LG Energy Solution to claim second place. This was driven by demand from its own models and growth in third-party deals, including providing batteries for the made-in-Germany Tesla Model Y, Toyota bZ3, Changan UNI-V, Venucia V-Online, as well as several Haval and FAW models.
The top three battery makers (CATL, BYD, LG) collectively account for two-thirds (66%) of total battery deployment.
Once a leader in the EV battery business, Panasonic now holds the fourth position with an 8% market share, down from 9% last year. With its main client, Tesla, now sourcing batteries from multiple suppliers, the Japanese battery maker seems to be losing its competitive edge in the industry.
Overall, the global EV battery market size is projected to grow from $49 billion in 2022 to $98 billion by 2029, according to Fortune Business Insights.

-

 Debt1 week ago
How Debt-to-GDP Ratios Have Changed Since 2000
-

 Markets2 weeks ago
Ranked: The World’s Top Flight Routes, by Revenue
-

 Countries2 weeks ago
Population Projections: The World’s 6 Largest Countries in 2075
-

 Markets2 weeks ago
The Top 10 States by Real GDP Growth in 2023
-

 Demographics2 weeks ago
The Smallest Gender Wage Gaps in OECD Countries
-

 United States2 weeks ago
Where U.S. Inflation Hit the Hardest in March 2024
-

 Green2 weeks ago
Top Countries By Forest Growth Since 2001
-

 United States2 weeks ago
Ranked: The Largest U.S. Corporations by Number of Employees