Mining
Ranked: The World’s Biggest Steel Producers, by Country
![]() Subscribe to the Elements free mailing list for more like this
Subscribe to the Elements free mailing list for more like this
Ranked: The World’s Biggest Steel Producers, by Country
This was originally posted on Elements. Sign up to the free mailing list to get beautiful visualizations on real assets and resource megatrends each week.
Steel is a critical component of modern industry and economy, essential for the construction of buildings, automobiles, and many other appliances and infrastructure used in our daily lives.
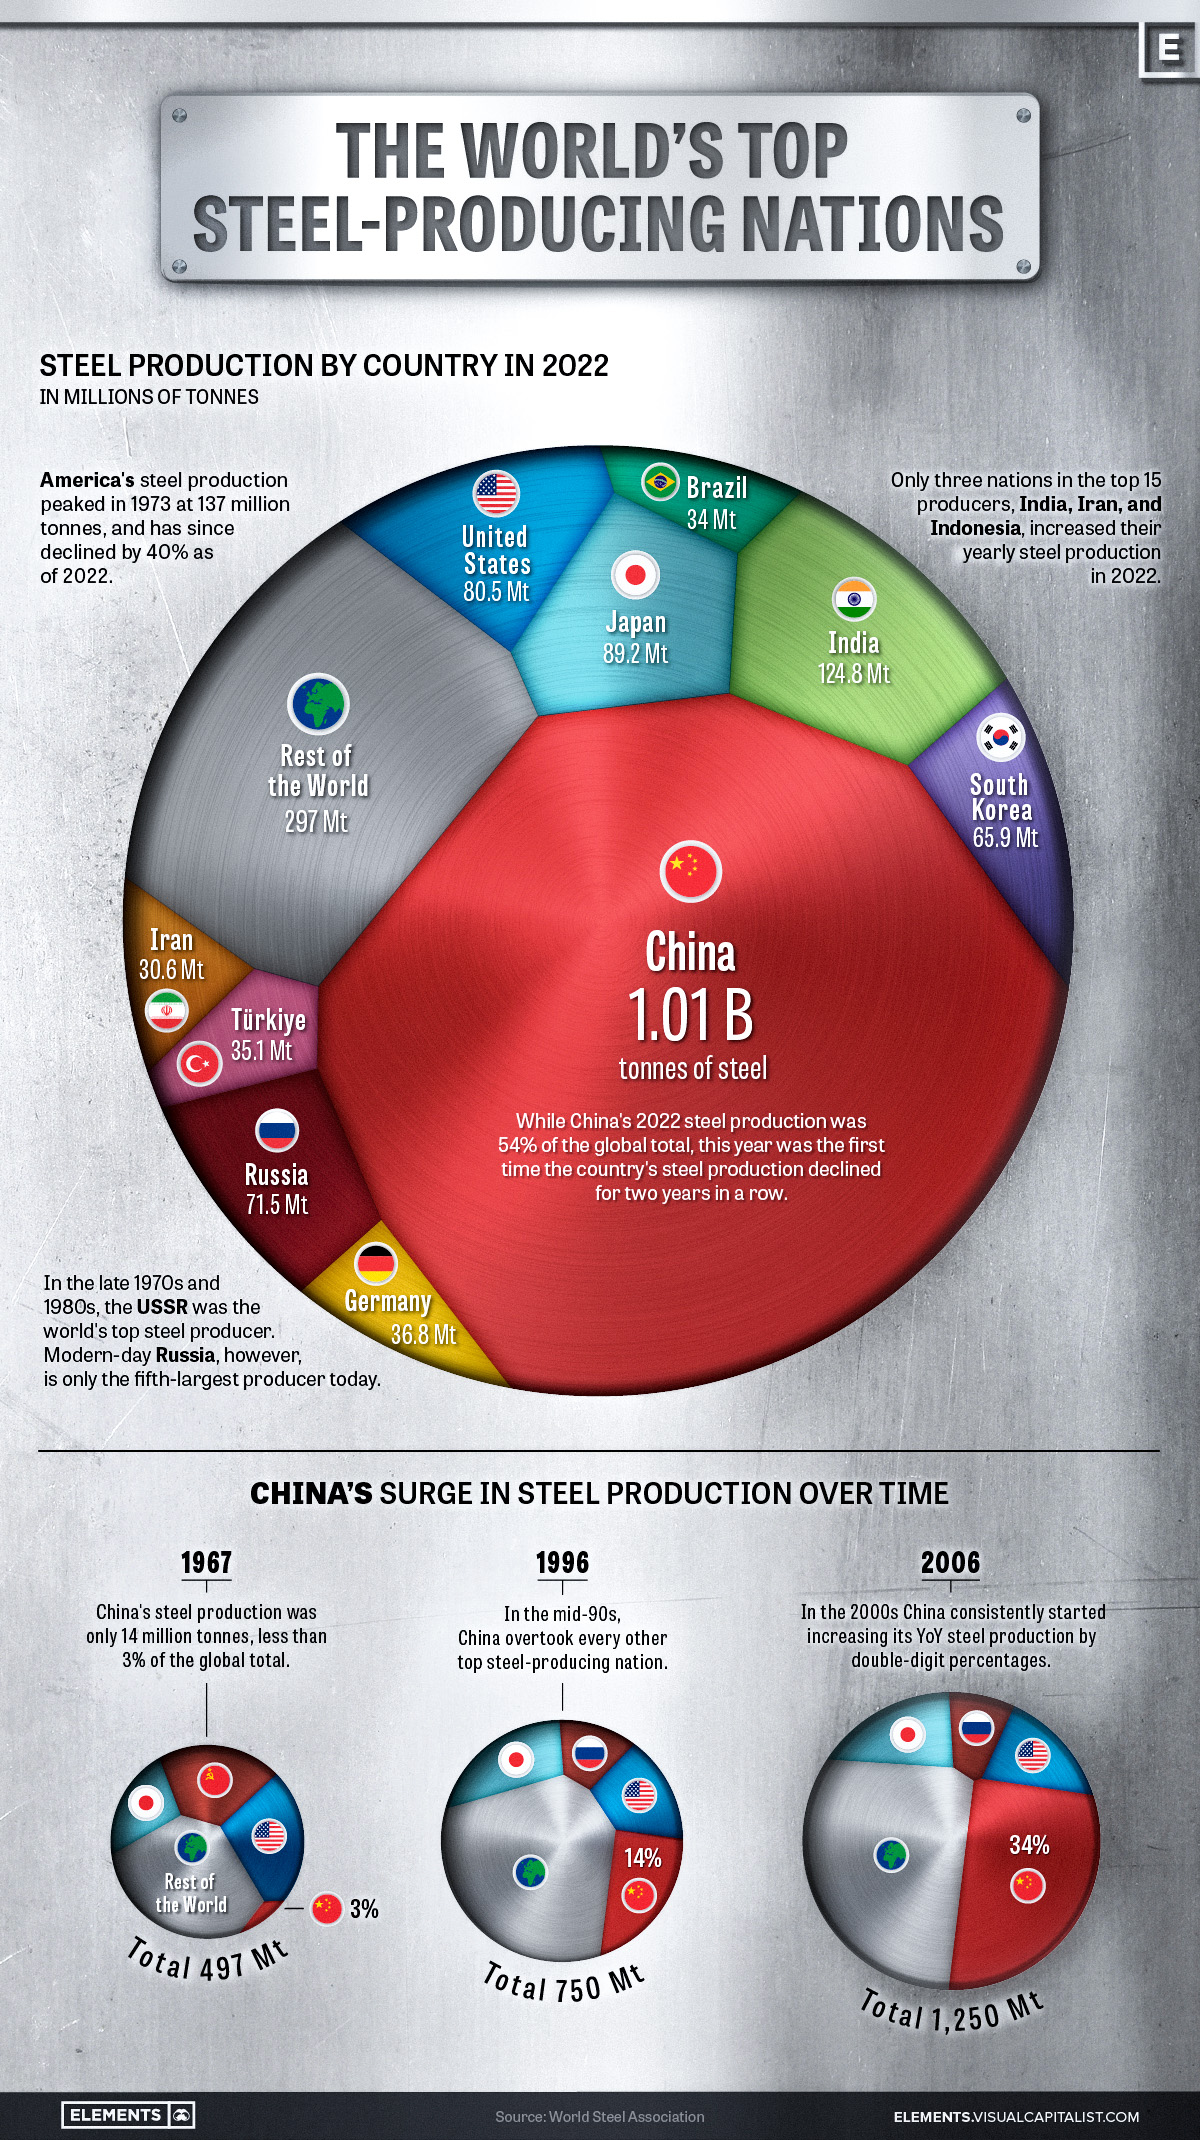
This graphic uses data from the World Steel Association to visualize the world’s top steel-producing countries, and highlights China’s ascent to the top, as it now makes up more than half of the world’s steel production.
The State of Global Steel Production
Global steel production in 2022 reached 1,878 million tonnes, barely surpassing the pre-pandemic production of 1,875 million tonnes in 2019.
| Country | 2022 Production (in million tonnes) | Annual Production Change | Global Share |
|---|---|---|---|
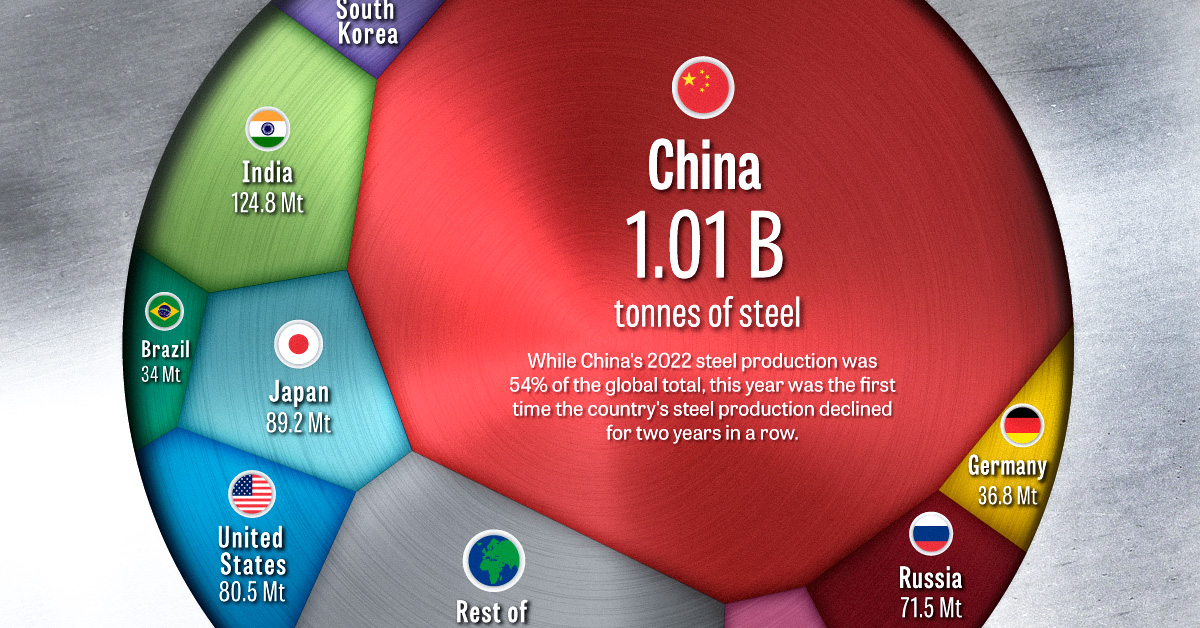
| 🇨🇳 China | 1013.0 | -2.0% | 53.9% |
| 🇮🇳 India | 124.8 | 5.3% | 6.6% |
| 🇯🇵 Japan | 89.2 | -7.9% | 4.8% |
| 🇺🇸 United States | 80.5 | -6.5% | 4.3% |
| 🇷🇺 Russia | 71.5 | -5.8% | 3.8% |
| 🇰🇷 South Korea | 65.9 | -6.9% | 3.5% |
| 🇩🇪 Germany | 36.8 | -8.8% | 2.0% |
| 🇹🇷 Türkiye | 35.1 | -15.0% | 1.9% |
| 🇧🇷 Brazil | 34.0 | -6.5% | 1.8% |
| 🇮🇷 Iran | 30.6 | 6.8% | 1.6% |
| 🇮🇹 Italy | 21.6 | -13.0% | 1.1% |
| 🇹🇼 Taiwan | 20.7 | -12.1% | 1.1% |
| 🇻🇳 Vietnam | 20.0 | -15.0% | 1.1% |
| 🇲🇽 Mexico | 18.2 | -1.9% | 1.0% |
| 🇮🇩 Indonesia | 15.6 | 8.3% | 0.8% |
| Rest of World | 201.0 | -11.2% | 10.7% |
| World Total | 1878.5 | -3.9% | 100.0% |
2022’s steel production marked a significant reduction compared to the post-pandemic rebound of 1,960 million tonnes in 2021, with a year-over-year decline of 4.2%–the largest drop since 2009, and prior to that, 1991.
This decline was spread across many of the world’s top steel producers, with only three of the top fifteen countries, India, Iran, and Indonesia, increasing their yearly production. Most of the other top steel-producing countries saw annual production declines of more than 5%, with Turkey, Italy, Taiwan, and Vietnam’s production all declining by double digits.
Even the world’s top steel-producing nation, China, experienced a modest 2% decline, which due to the country’s large production amounted to a decline of 19.8 million tonnes, more than many other nations produce in a year.
Despite India, the world’s second-largest steel producer, increasing its production by 5.3%, the country’s output still amounts to just over one-tenth of the steel produced by China.
China’s Meteoric Rise in Steel Production
Although China dominates the world’s steel production with more than a 54% share today, this hasn’t always been the case.
In 1967, the World Steel Association’s first recorded year of steel production figures, China only produced an estimated 14 million tonnes, making up barely 3% of global output. At that time, the U.S. and the USSR were competing as the world’s top steel producers at 115 and 102 million tonnes respectively, followed by Japan at 62 million tonnes.
Almost three decades later in 1996, China had successively overtaken Russia, the U.S., and Japan to become the top steel-producing nation with 101 million tonnes of steel produced that year.
The early 2000s marked a period of rapid growth for China, with consistent double-digit percentage increases in steel production each year.
The Recent Decline in China’s Steel Production
Since the early 2000s, China’s average annual growth in steel production has slowed to 3.4% over the last decade (2013-2022), a considerable decline compared to the previous decade’s (2003-2012) 15.2% average annual growth rate.
The past couple of years have seen China’s steel production decline, with 2021 and 2022 marking the first time the country’s production fell for two consecutive years in a row.
While it’s unlikely China will relinquish its position as the top steel-producing nation anytime soon, it remains to be seen whether this recent decline marks the beginning of a new trend or just a brief deviation from the country’s consistent production growth.


Lithium
Ranked: The Top 10 EV Battery Manufacturers in 2023
Asia dominates this ranking of the world’s largest EV battery manufacturers in 2023.


The Top 10 EV Battery Manufacturers in 2023
This was originally posted on our Voronoi app. Download the app for free on iOS or Android and discover incredible data-driven charts from a variety of trusted sources.
Despite efforts from the U.S. and EU to secure local domestic supply, all major EV battery manufacturers remain based in Asia.
In this graphic we rank the top 10 EV battery manufacturers by total battery deployment (measured in megawatt-hours) in 2023. The data is from EV Volumes.
Chinese Dominance
Contemporary Amperex Technology Co. Limited (CATL) has swiftly risen in less than a decade to claim the title of the largest global battery group.
The Chinese company now has a 34% share of the market and supplies batteries to a range of made-in-China vehicles, including the Tesla Model Y, SAIC’s MG4/Mulan, and various Li Auto models.
| Company | Country | 2023 Production (megawatt-hour) | Share of Total Production |
|---|---|---|---|
| CATL | 🇨🇳 China | 242,700 | 34% |
| BYD | 🇨🇳 China | 115,917 | 16% |
| LG Energy Solution | 🇰🇷 Korea | 108,487 | 15% |
| Panasonic | 🇯🇵 Japan | 56,560 | 8% |
| SK On | 🇰🇷 Korea | 40,711 | 6% |
| Samsung SDI | 🇰🇷 Korea | 35,703 | 5% |
| CALB | 🇨🇳 China | 23,493 | 3% |
| Farasis Energy | 🇨🇳 China | 16,527 | 2% |
| Envision AESC | 🇨🇳 China | 8,342 | 1% |
| Sunwoda | 🇨🇳 China | 6,979 | 1% |
| Other | - | 56,040 | 8% |
In 2023, BYD surpassed LG Energy Solution to claim second place. This was driven by demand from its own models and growth in third-party deals, including providing batteries for the made-in-Germany Tesla Model Y, Toyota bZ3, Changan UNI-V, Venucia V-Online, as well as several Haval and FAW models.
The top three battery makers (CATL, BYD, LG) collectively account for two-thirds (66%) of total battery deployment.
Once a leader in the EV battery business, Panasonic now holds the fourth position with an 8% market share, down from 9% last year. With its main client, Tesla, now sourcing batteries from multiple suppliers, the Japanese battery maker seems to be losing its competitive edge in the industry.
Overall, the global EV battery market size is projected to grow from $49 billion in 2022 to $98 billion by 2029, according to Fortune Business Insights.

-

 Debt1 week ago
How Debt-to-GDP Ratios Have Changed Since 2000
-

 Countries2 weeks ago
Population Projections: The World’s 6 Largest Countries in 2075
-

 Markets2 weeks ago
The Top 10 States by Real GDP Growth in 2023
-

 Demographics2 weeks ago
The Smallest Gender Wage Gaps in OECD Countries
-

 United States2 weeks ago
Where U.S. Inflation Hit the Hardest in March 2024
-

 Green2 weeks ago
Top Countries By Forest Growth Since 2001
-

 United States2 weeks ago
Ranked: The Largest U.S. Corporations by Number of Employees
-

 Maps2 weeks ago
The Largest Earthquakes in the New York Area (1970-2024)