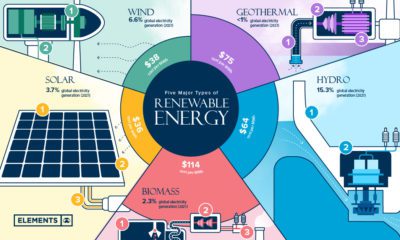

Renewable energy is the foundation of the ongoing energy transition. What are the key types of renewable energy, and how do they work?
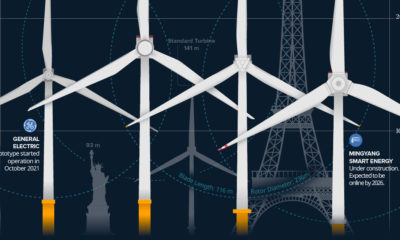

The biggest wind turbines can reach over 200 meters and cost more than $12 million to manufacture and install.
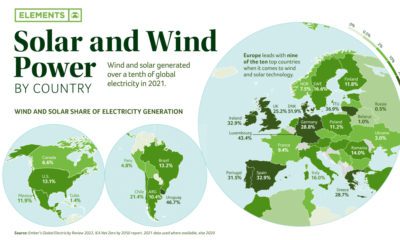

Wind and solar make up 10% of the world’s electricity. Combined, they are the fourth-largest source of electricity after coal, gas, and hydro.
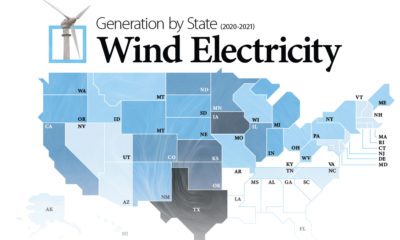

Wind energy is the largest source of renewable electricity in North America. This graphic maps U.S. states by wind electricity generation.
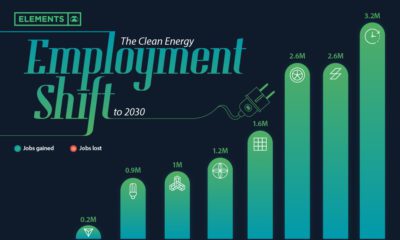

Will the clean energy transition create jobs, or will jobs be lost? Here is projected employment growth in clean energy and related sectors to 2030.
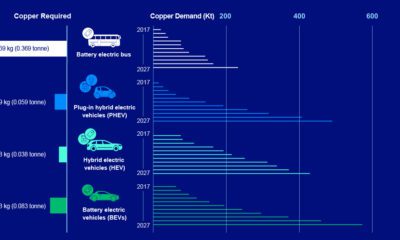

As the world moves towards renewable energy technologies, copper will remain the most widely used metal. Here’s a snapshot of copper’s role in a low-carbon economy...
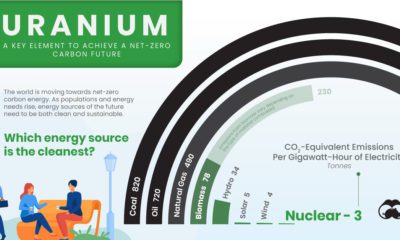

All energy sources have negative impacts, but some are better for the environment than others. Which energy source is the cleanest?
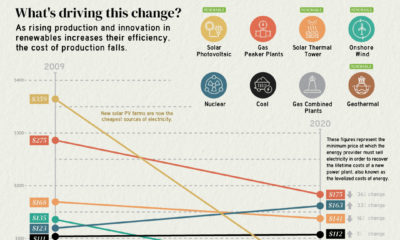

The cost of electricity from solar PV plants has decreased by 90% since 2009, highlighting the rapidly changing economics of electricity production.
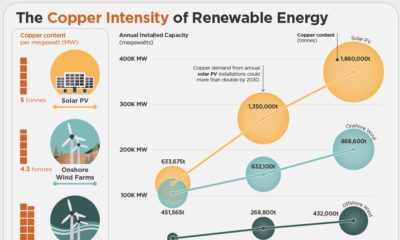

Copper is critical for the transition to clean energy. This infographic charts the copper usage of renewable energy technologies.
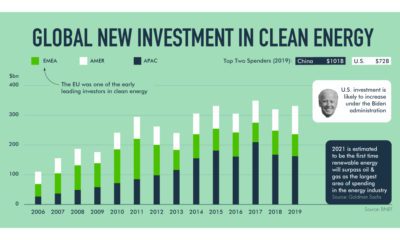

How is the renewable energy shift unfolding? This exploration highlights the market and governmental forces in action.


