Energy
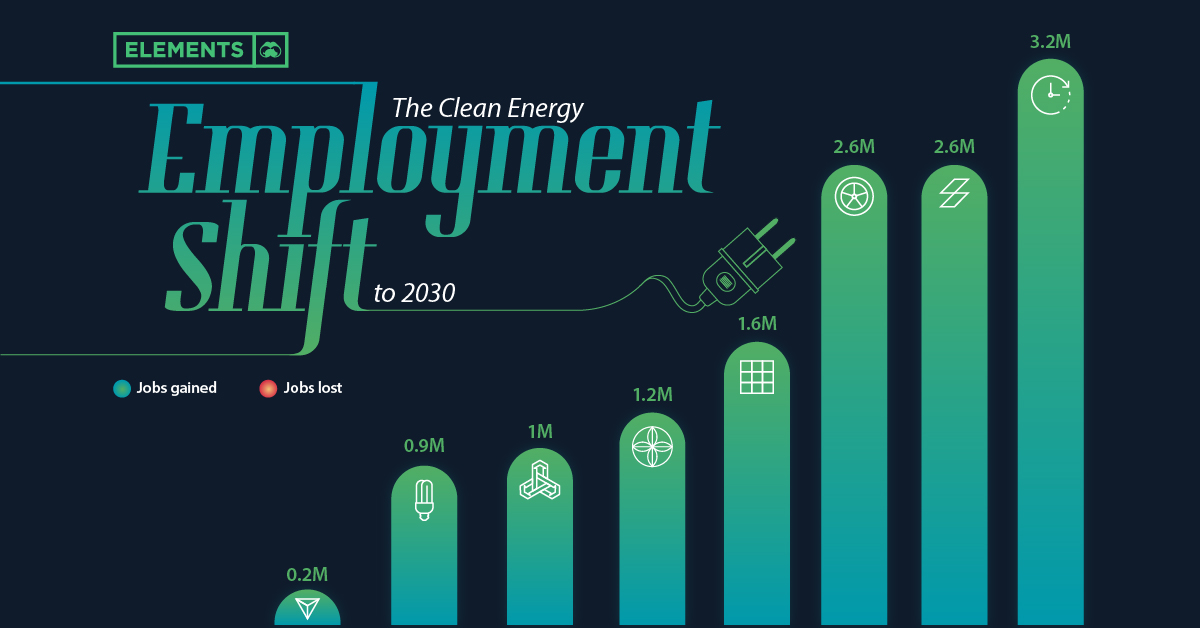
The Clean Energy Employment Shift, by 2030
![]() Subscribe to the Elements free mailing list for more like this
Subscribe to the Elements free mailing list for more like this
The Clean Energy Employment Shift, by 2030
This was originally posted on Elements. Sign up to the free mailing list to get beautiful visualizations on natural resource megatrends in your email every week.
With many countries and companies pledged to reduce emissions, the clean energy transition seems to be an inevitability. And that transition will undoubtedly have an impact on employment.
New sources of power don’t just require new and updated equipment, they also require people to operate them. And as demand for cleaner fuels shifts attention away from fossil fuels, it’s likely that not every sector will see a net gain of employment.
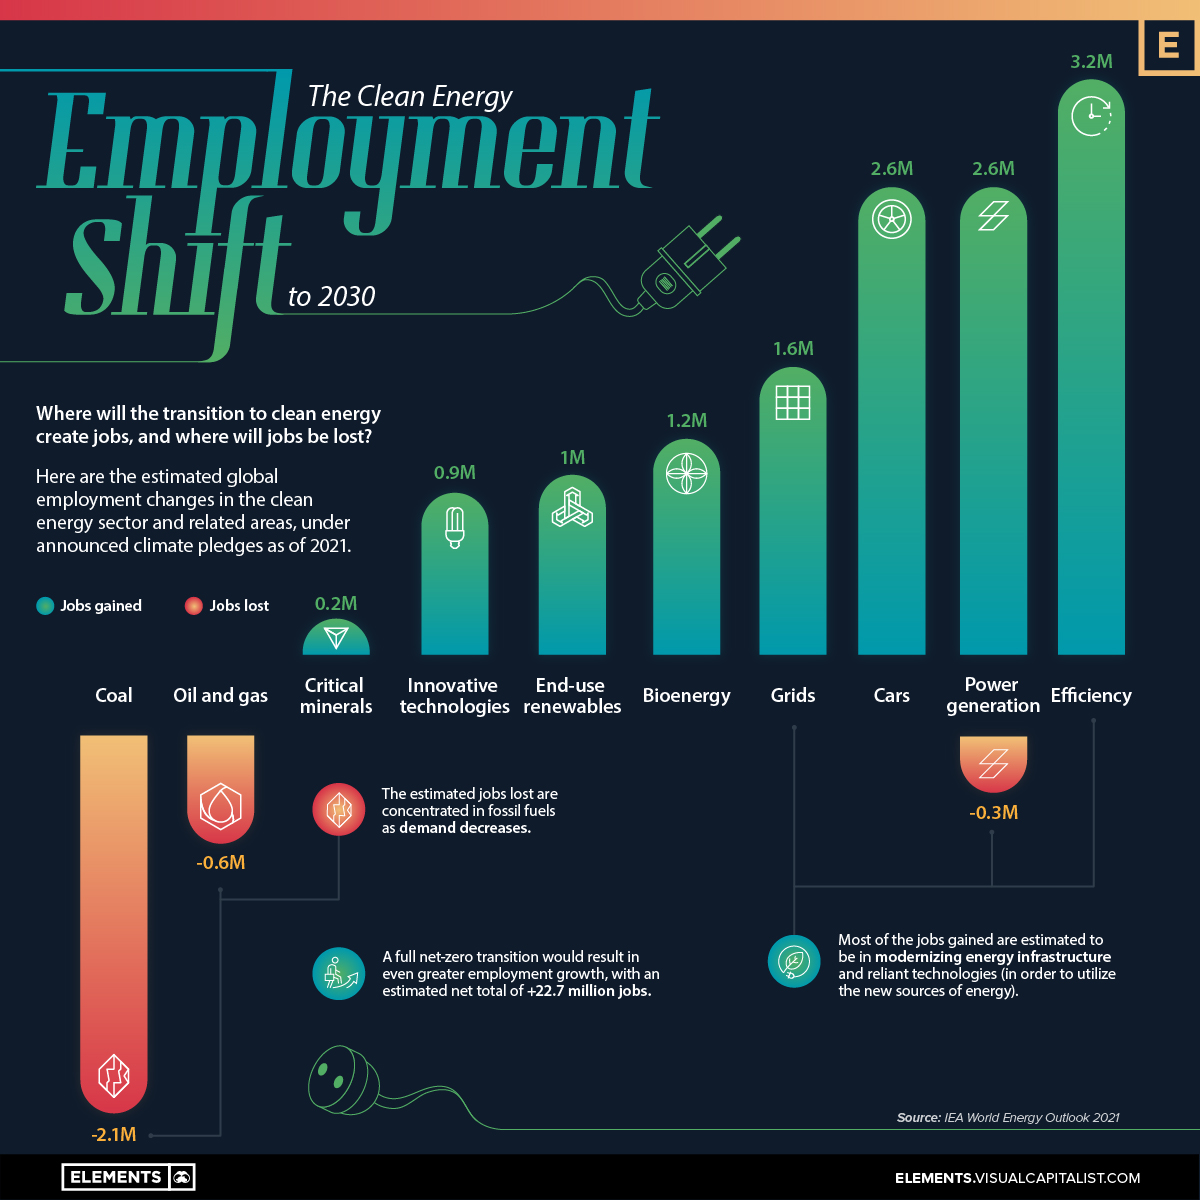
This graphic shows projected global employment growth in the clean energy sector and related areas, under announced climate pledges as of 2021, as tracked by the IEA’s World Energy Outlook.
Which Sectors Will Gain Jobs By 2030?
In total, the clean energy transition is expected to generate 10.3 million net new jobs around the world by 2030.
Though fuel generation will definitely be affected by the clean energy transition, the biggest impact will be felt in modernizing energy infrastructure:
| Clean Energy Jobs By Sector (to 2030) | Jobs Gained | Jobs Lost | Net Job Shift |
|---|---|---|---|
| Efficiency | 3.2M | 0 | 3.2M |
| Cars | 2.6M | 0 | 2.6M |
| Power generation | 2.6M | -0.3M | 2.3M |
| Grids | 1.6M | 0 | 1.6M |
| Bioenergy | 1.2M | 0 | 1.2M |
| End-use renewables | 1M | 0 | 1M |
| Innovative technologies | 0.9M | 0 | 0.9M |
| Critical minerals | 0.2M | 0 | 0.2M |
| Coal | 0 | -0.6M | -0.6M |
| Oil and gas | 0 | -2.1M | -2.1M |
| Total | 13.3M | -3.0M | 10.3M |
In order to properly utilize the new sources of energy, the largest expected job gains are in electrical efficiency, power generation, and the automotive sector. Combined with modernizing the grid, they make up 75% of the 13.3 million in new job gains expected.
Comparatively, new energy sources like bioenergy, end-use renewables, and supply chain resources like innovative technologies and critical minerals combine for 3.3 million jobs. That offsets the 2.7 million jobs expected to be lost in fossil fuel sectors, plus an additional 0.3 million lost in power generation.
But it’s important to note that these expected employment changes are under announced climate pledges as of 2021. The IEA has calculated that in a full net-zero clean energy transition, the estimated quantity of jobs gained and lost would more than double across almost all sectors, with a net addition of 22.7 million new jobs.
Regardless of which path is closest to the reality, it’s clear the job landscape in energy and related sectors will be shifting in the coming years, and it will be interesting to see how and when such changes materialize.


Energy
The World’s Biggest Nuclear Energy Producers
China has grown its nuclear capacity over the last decade, now ranking second on the list of top nuclear energy producers.


The World’s Biggest Nuclear Energy Producers
This was originally posted on our Voronoi app. Download the app for free on Apple or Android and discover incredible data-driven charts from a variety of trusted sources.
Scientists in South Korea recently broke a record in a nuclear fusion experiment. For 48 seconds, they sustained a temperature seven times that of the sun’s core.
But generating commercially viable energy from nuclear fusion still remains more science fiction than reality. Meanwhile, its more reliable sibling, nuclear fission, has been powering our world for many decades.
In this graphic, we visualized the top producers of nuclear energy by their share of the global total, measured in terawatt hours (TWh). Data for this was sourced from the Nuclear Energy Institute, last updated in August 2022.
Which Country Generates the Most Nuclear Energy?
Nuclear energy production in the U.S. is more than twice the amount produced by China (ranked second) and France (ranked third) put together. In total, the U.S. accounts for nearly 30% of global nuclear energy output.
However, nuclear power only accounts for one-fifth of America’s electricity supply. This is in contrast to France, which generates 60% of its electricity from nuclear plants.
| Rank | Country | Nuclear Energy Produced (TWh) | % of Total |
|---|---|---|---|
| 1 | 🇺🇸 U.S. | 772 | 29% |
| 2 | 🇨🇳 China | 383 | 14% |
| 3 | 🇫🇷 France | 363 | 14% |
| 4 | 🇷🇺 Russia | 208 | 8% |
| 5 | 🇰🇷 South Korea | 150 | 6% |
| 6 | 🇨🇦 Canada | 87 | 3% |
| 7 | 🇺🇦 Ukraine | 81 | 3% |
| 8 | 🇩🇪 Germany | 65 | 2% |
| 9 | 🇯🇵 Japan | 61 | 2% |
| 10 | 🇪🇸 Spain | 54 | 2% |
| 11 | 🇸🇪 Sweden | 51 | 2% |
| 12 | 🇧🇪 Belgium | 48 | 2% |
| 13 | 🇬🇧 UK | 42 | 2% |
| 14 | 🇮🇳 India | 40 | 2% |
| 15 | 🇨🇿 Czech Republic | 29 | 1% |
| N/A | 🌐 Other | 219 | 8% |
| N/A | 🌍 Total | 2,653 | 100% |
Another highlight is how China has rapidly grown its nuclear energy capabilities in the last decade. Between 2016 and 2021, for example, it increased its share of global nuclear energy output from less than 10% to more than 14%, overtaking France for second place.
On the opposite end, the UK’s share has slipped to 2% over the same time period.
Meanwhile, Ukraine has heavily relied on nuclear energy to power its grid. In March 2022, it lost access to its key Zaporizhzhia Nuclear Power Station after Russian forces wrested control of the facility. With six 1,000 MW reactors, the plant is one of the largest in Europe. It is currently not producing any power, and has been the site of recent drone attacks.

-

 Green2 weeks ago
Ranked: Top Countries by Total Forest Loss Since 2001
-

 Travel1 week ago
Ranked: The World’s Top Flight Routes, by Revenue
-

 Technology1 week ago
Ranked: Semiconductor Companies by Industry Revenue Share
-

 Money2 weeks ago
Which States Have the Highest Minimum Wage in America?
-

 Real Estate2 weeks ago
Ranked: The Most Valuable Housing Markets in America
-

 Markets2 weeks ago
Charted: Big Four Market Share by S&P 500 Audits
-

 AI2 weeks ago
The Stock Performance of U.S. Chipmakers So Far in 2024
-

 Automotive2 weeks ago
Almost Every EV Stock is Down After Q1 2024