Energy
Animation: The World’s Biggest Wind Turbines
![]() Subscribe to the Elements free mailing list for more like this
Subscribe to the Elements free mailing list for more like this
The World’s Biggest Wind Turbines
This was originally posted on Elements. Sign up to the free mailing list to get beautiful visualizations on natural resource megatrends in your email every week.
Since the early 2000s, wind turbines have grown in size—in both height and blade lengths—to generate more energy per unit.
Today, the tallest turbines can reach over 200 meters (650 ft) in height and cost more than $12 million to manufacture and install.
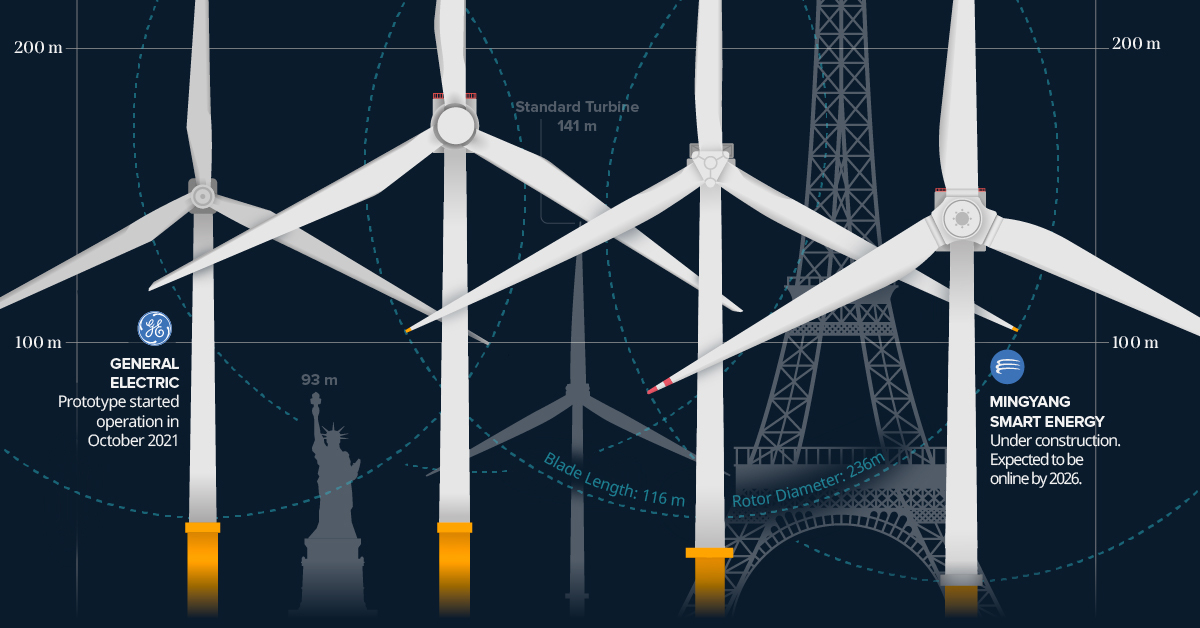
The above infographic uses data compiled from company portfolios to showcase the biggest wind turbines currently being developed and to put these huge structures into perspective.
Blade Runners
The biggest turbines are all located over water. The so-called offshore turbines can be taller than those onshore, which means they can harness more wind energy and produce more electricity.
MingYang Smart Energy, a Chinese wind turbine manufacturer, is in the process of building the biggest wind turbine so far.
Their new MySE 16.0-242 model is still under construction and is expected to be online by 2026. It will be 264 meters tall, with a blade length 118 meters long and rotor diameter of 242 meters. It features a nameplate capacity of 16 megawatts that can power 20,000 homes per unit over a 25-year service life. The first commercial turbine will be installed at the MingYang Yangjiang Qingzhou Four offshore wind farm, which is in the South China Sea.
Here are four of the biggest wind turbine models on the market right now, the companies that are making them, and where the prototypes are being installed:
| Model | Company | Nameplate capacity (MW) | Location | Height (m) | Blade Length (m) | Rotor Diameter (m) |
|---|---|---|---|---|---|---|
| MySE 16.0-242 | MingYang Smart Energy | 16 MW | 🇨🇳 | 264 | 118 | 242 |
| SG 14-236 DD | Siemens Gamesa | 14 MW | 🇩🇰 | Site Specific | 115 | 236 |
| Haliade-X | General Electric | 14 MW | 🇳🇱 | 260 | 107 | 220 |
| V236-15.0 | Vestas | 15 MW | 🇩🇰 | 280 | 116 | 236 |
These huge structures can be two times taller than a typical turbine currently in operation, generating almost four times more energy.
Prototypes for two of the top four turbine models—the SG 14-236 DD and V236-15.0— are scheduled to be installed in 2022 in Denmark, a country that was a pioneer in developing commercial wind power during the 1970s, and is home to the world’s largest wind-turbine manufacturer, Vestas.
From our list, General Electric’s Haliade-X is the only turbine currently online; the prototype has been operating since October 2021 in the Netherlands.
Wind Energy’s Rapid Global Growth
Wind generated 6.6% of the world’s electricity in 2021, up from 3.5% in 2015, when the Paris Agreement was signed, making it the fastest-growing source of electricity after solar.
A number of countries have achieved relatively high levels of wind energy penetration in their electricity grids.
Wind’s share of electricity generation was nearly 50% in Denmark and sits above 25% in countries such as Ireland, Uruguay, and Portugal. In the United States, wind supplied 8.4% of total electricity generation.
| Country | Wind Share of Electricity (%) |
|---|---|
| 🇩🇰 Denmark | 48% |
| 🇺🇾 Uruguay | 43% |
| 🇮🇪 Ireland | 33% |
| 🇵🇹 Portugal | 27% |
| 🇪🇸 Spain | 23% |
| 🇬🇧 United Kingdom | 21% |
| 🇩🇪 Germany | 20% |
| 🇬🇷 Greece | 20% |
| 🇰🇪 Kenya | 16% |
| 🇸🇪 Sweden | 16% |
Source: Ember’s Global Electricity Review 2022
Note: Countries with populations fewer than 3 million in 2021 were not included in this ranking.
The global wind turbine market size was valued at $53.4 billion in 2020 and is projected to reach $98.4 billion by 2030, growing at a CAGR of 6.3%.
As one of the fastest-growing segments of the energy sector, wind energy generation will continue to grow as wind turbines also scale up in size.


Energy
Charted: 4 Reasons Why Lithium Could Be the Next Gold Rush
Visual Capitalist has partnered with EnergyX to show why drops in prices and growing demand may make now the right time to invest in lithium.


4 Reasons Why You Should Invest in Lithium
Lithium’s importance in powering EVs makes it a linchpin of the clean energy transition and one of the world’s most precious minerals.
In this graphic, Visual Capitalist partnered with EnergyX to explore why now may be the time to invest in lithium.
1. Lithium Prices Have Dropped
One of the most critical aspects of evaluating an investment is ensuring that the asset’s value is higher than its price would indicate. Lithium is integral to powering EVs, and, prices have fallen fast over the last year:
| Date | LiOH·H₂O* | Li₂CO₃** |
|---|---|---|
| Feb 2023 | $76 | $71 |
| March 2023 | $71 | $61 |
| Apr 2023 | $43 | $33 |
| May 2023 | $43 | $33 |
| June 2023 | $47 | $45 |
| July 2023 | $44 | $40 |
| Aug 2023 | $35 | $35 |
| Sept 2023 | $28 | $27 |
| Oct 2023 | $24 | $23 |
| Nov 2023 | $21 | $21 |
| Dec 2023 | $17 | $16 |
| Jan 2024 | $14 | $15 |
| Feb 2024 | $13 | $14 |
Note: Monthly spot prices were taken as close to the 14th of each month as possible.
*Lithium hydroxide monohydrate MB-LI-0033
**Lithium carbonate MB-LI-0029
2. Lithium-Ion Battery Prices Are Also Falling
The drop in lithium prices is just one reason to invest in the metal. Increasing economies of scale, coupled with low commodity prices, have caused the cost of lithium-ion batteries to drop significantly as well.
In fact, BNEF reports that between 2013 and 2023, the price of a Li-ion battery dropped by 82%.
| Year | Price per KWh |
|---|---|
| 2023 | $139 |
| 2022 | $161 |
| 2021 | $150 |
| 2020 | $160 |
| 2019 | $183 |
| 2018 | $211 |
| 2017 | $258 |
| 2016 | $345 |
| 2015 | $448 |
| 2014 | $692 |
| 2013 | $780 |

3. EV Adoption is Sustainable
One of the best reasons to invest in lithium is that EVs, one of the main drivers behind the demand for lithium, have reached a price point similar to that of traditional vehicle.
According to the Kelly Blue Book, Tesla’s average transaction price dropped by 25% between 2022 and 2023, bringing it in line with many other major manufacturers and showing that EVs are a realistic transport option from a consumer price perspective.
| Manufacturer | September 2022 | September 2023 |
|---|---|---|
| BMW | $69,000 | $72,000 |
| Ford | $54,000 | $56,000 |
| Volkswagon | $54,000 | $56,000 |
| General Motors | $52,000 | $53,000 |
| Tesla | $68,000 | $51,000 |
4. Electricity Demand in Transport is Growing
As EVs become an accessible transport option, there’s an investment opportunity in lithium. But possibly the best reason to invest in lithium is that the IEA reports global demand for the electricity in transport could grow dramatically by 2030:
| Transport Type | 2022 | 2025 | 2030 |
|---|---|---|---|
| Buses 🚌 | 23,000 GWh | 50,000 GWh | 130,000 GWh |
| Cars 🚙 | 65,000 GWh | 200,000 GWh | 570,000 GWh |
| Trucks 🛻 | 4,000 GWh | 15,000 GWh | 94,000 GWh |
| Vans 🚐 | 6,000 GWh | 16,000 GWh | 72,000 GWh |
The Lithium Investment Opportunity
Lithium presents a potentially classic investment opportunity. Lithium and battery prices have dropped significantly, and recently, EVs have reached a price point similar to other vehicles. By 2030, the demand for clean energy, especially in transport, will grow dramatically.
With prices dropping and demand skyrocketing, now is the time to invest in lithium.
EnergyX is poised to exploit lithium demand with cutting-edge lithium extraction technology capable of extracting 300% more lithium than current processes.

-

 Lithium4 days ago
Ranked: The Top 10 EV Battery Manufacturers in 2023
Asia dominates this ranking of the world’s largest EV battery manufacturers in 2023.
-

 Energy1 week ago
The World’s Biggest Nuclear Energy Producers
China has grown its nuclear capacity over the last decade, now ranking second on the list of top nuclear energy producers.
-

 Energy1 month ago
The World’s Biggest Oil Producers in 2023
Just three countries accounted for 40% of global oil production last year.
-

 Energy1 month ago
How Much Does the U.S. Depend on Russian Uranium?
Currently, Russia is the largest foreign supplier of nuclear power fuel to the U.S.
-

 Uranium2 months ago
Charted: Global Uranium Reserves, by Country
We visualize the distribution of the world’s uranium reserves by country, with 3 countries accounting for more than half of total reserves.
-

 Energy3 months ago
Visualizing the Rise of the U.S. as Top Crude Oil Producer
Over the last decade, the United States has established itself as the world’s top producer of crude oil, surpassing Saudi Arabia and Russia.

-

 Debt1 week ago
How Debt-to-GDP Ratios Have Changed Since 2000
-

 Markets2 weeks ago
Ranked: The World’s Top Flight Routes, by Revenue
-

 Countries2 weeks ago
Population Projections: The World’s 6 Largest Countries in 2075
-

 Markets2 weeks ago
The Top 10 States by Real GDP Growth in 2023
-

 Demographics2 weeks ago
The Smallest Gender Wage Gaps in OECD Countries
-

 United States2 weeks ago
Where U.S. Inflation Hit the Hardest in March 2024
-

 Green2 weeks ago
Top Countries By Forest Growth Since 2001
-

 United States2 weeks ago
Ranked: The Largest U.S. Corporations by Number of Employees