Energy
Visualizing U.S. Crude Oil and Petroleum Product Imports in 2021
![]() Subscribe to the Elements free mailing list for more like this
Subscribe to the Elements free mailing list for more like this
U.S. Petroleum Product and Crude Oil Imports in 2021: Visualized
This was originally posted on Elements. Sign up to the free mailing list to get beautiful visualizations on natural resource megatrends in your email every week.
Energy independence is top of mind for many nations as Russia’s invasion of Ukraine has prompted sanctions and bans against Russian coal and crude oil imports.
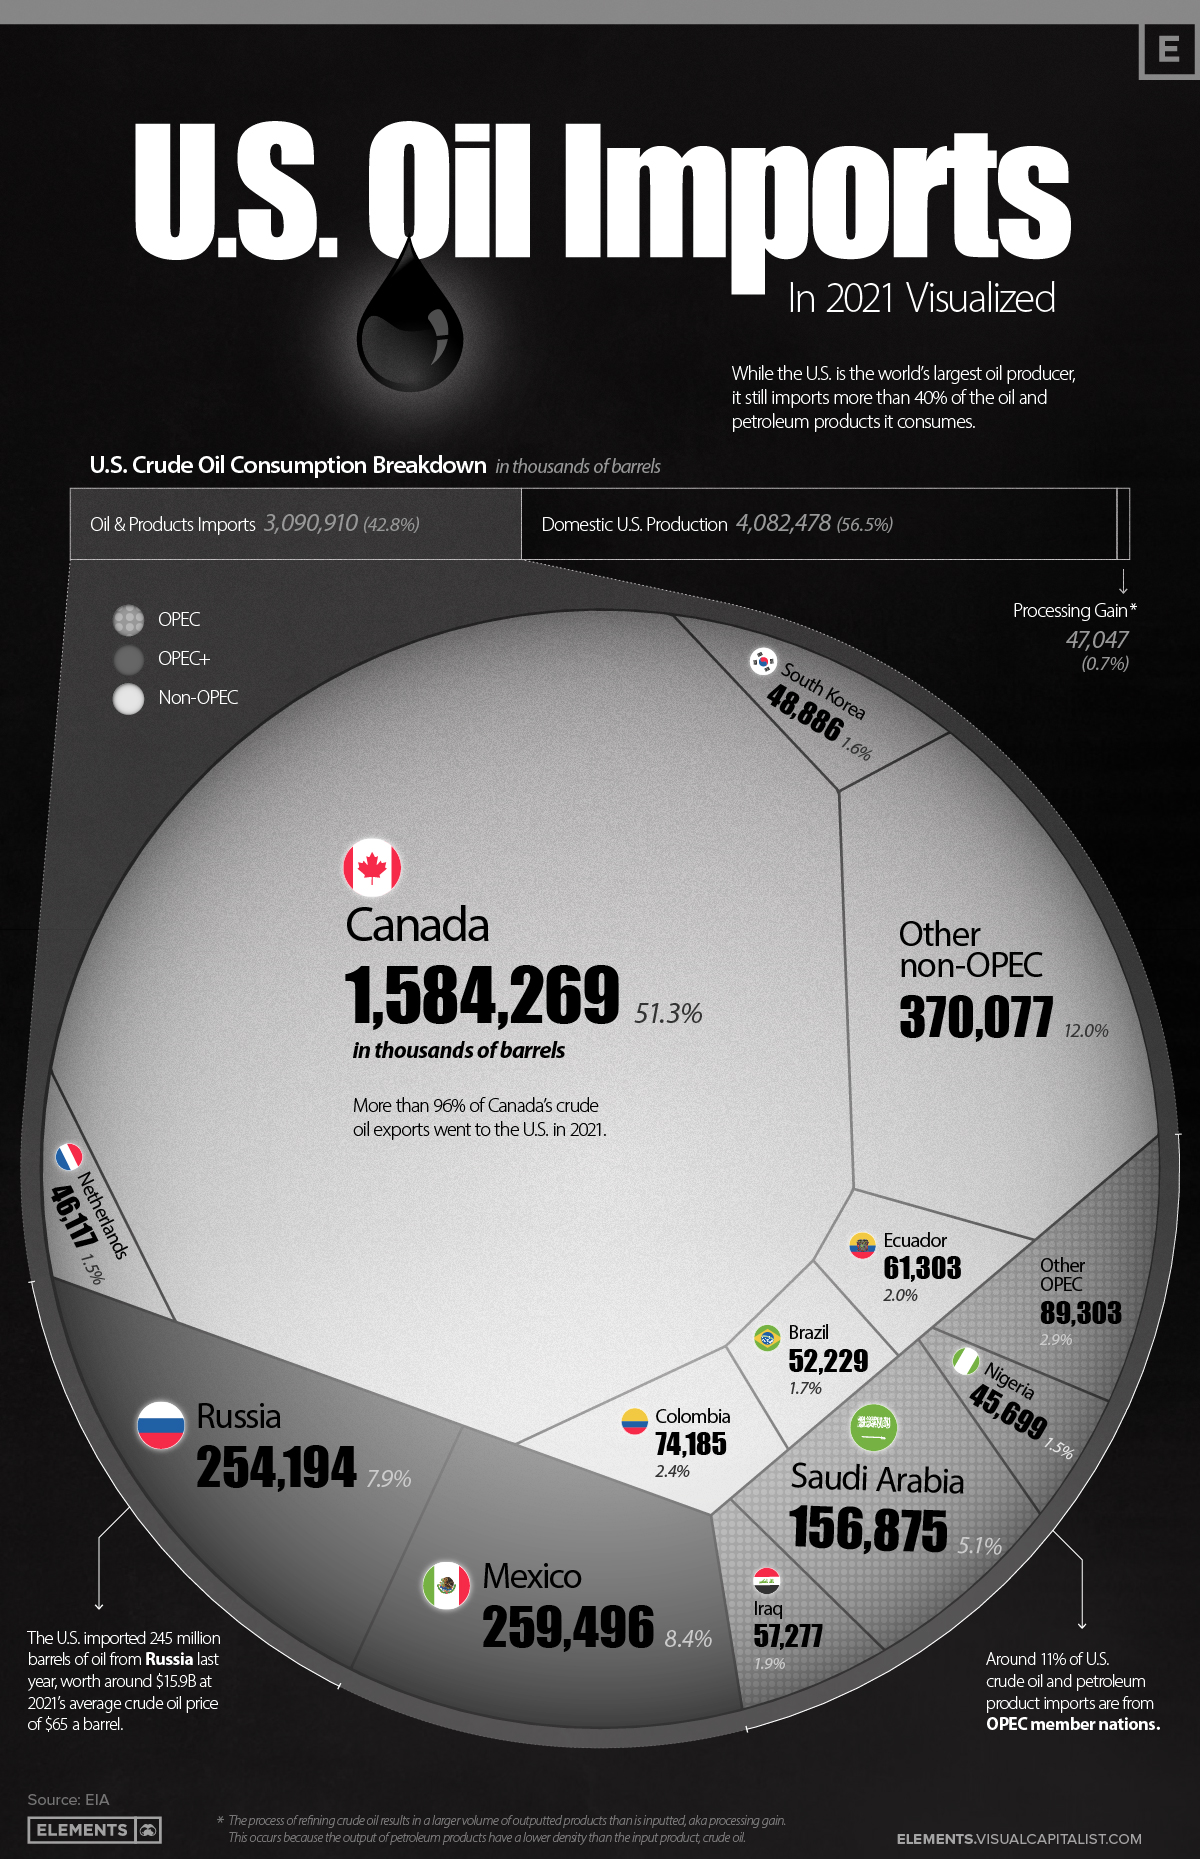
Despite being the world’s largest oil producer, in 2021 the U.S. still imported more than 3 billion barrels of crude oil and petroleum products, equal to 43% of the country’s consumption.
This visualization uses data from the Energy Information Administration (EIA) to compare U.S. crude oil and refined product imports with domestic crude oil production, and breaks down which countries the U.S. imported its oil from in 2021.
U.S. Crude Oil Imports, by Country
The U.S. imports more than 8 million barrels of petroleum products a day from other nations, making it the world’s second-largest importer of crude oil behind China.
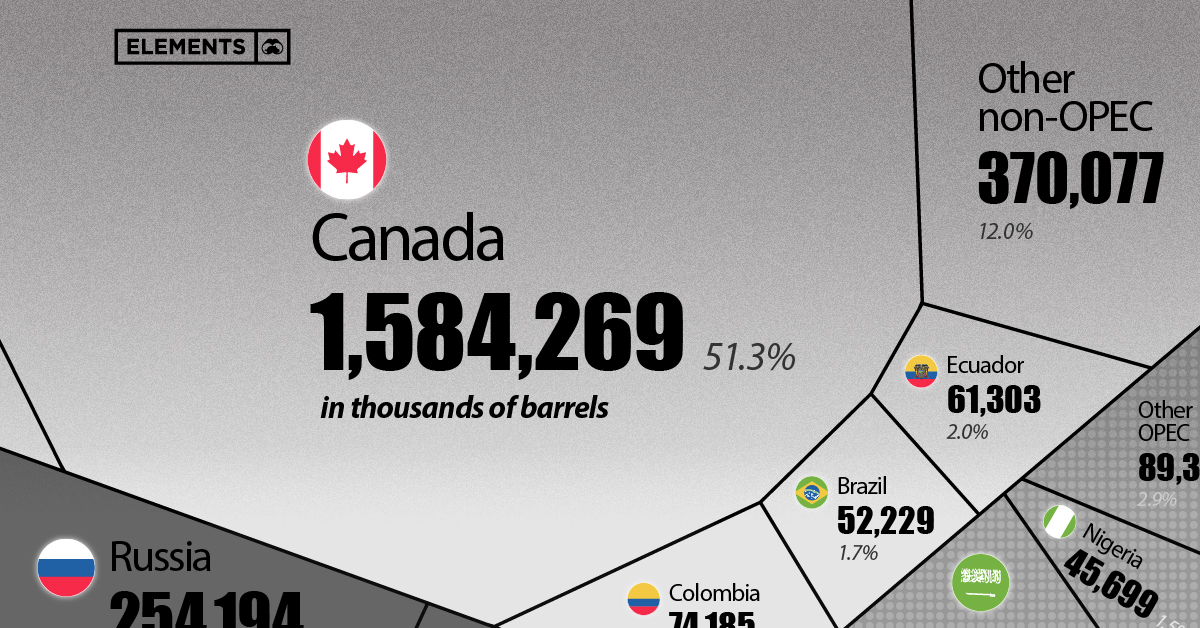
America’s northern neighbor, Canada, is the largest source of petroleum imports at 1.58 billion barrels in 2021. These made up more than 51% of U.S. petroleum imports, and when counting only crude oil imports, Canada’s share rises to 62%.
| Rank | Country | U.S. Oil Imports (2021, in barrels) | Share |
|---|---|---|---|
| #1 | 🇨🇦 Canada | 1,584 million | 51.3% |
| #2 | 🇲🇽 Mexico | 259 million | 8.4% |
| #3 | 🇷🇺 Russia | 254 million | 7.9% |
| #4 | 🇸🇦 Saudi Arabia | 156 million | 5.1% |
| #5 | 🇨🇴 Colombia | 74 million | 2.4% |
| #6 | 🇪🇨 Ecuador | 61 million | 2.0% |
| #7 | 🇮🇶 Iraq | 57 million | 1.9% |
| #8 | 🇧🇷 Brazil | 52 million | 1.7% |
| #9 | 🇰🇷 South Korea | 48 million | 1.6% |
| #10 | 🇳🇱 Netherlands | 46 million | 1.5% |
| #11 | 🇳🇬 Nigeria | 45 million | 1.5% |
| Other countries | 459 million | 14.7% | |
| Total | 3,091 million | 100.0% |
The second-largest contributor to U.S. petroleum imports was another neighbor, Mexico, with 259 million barrels imported in 2021—making up a bit more than 8% of U.S. petroleum imports.
Russia was the third-largest exporter of crude oil and petroleum products to the U.S. in 2021, with their 254 million barrels accounting for almost 8% of total imports.
U.S. Crude Oil and Petroleum Imports from OPEC and OPEC+
Only about 11% of U.S. crude oil and petroleum product imports come from OPEC nations, with another 16.3% coming from OPEC+ members.
While imports from OPEC and OPEC+ members make up more than a quarter of America’s total petroleum imports, this share is fairly small when considering OPEC members currently control nearly 80% of the world’s oil reserves.
Which Countries are Part of OPEC and OPEC-Plus?
The Organization of Petroleum Exporting Countries (OPEC) is a group of 13 petroleum producing nations that formed in 1960 to provide steady prices and supply distribution of crude oil and petroleum products.
In 2016, OPEC-plus was formed with additional oil-exporting nations in order to better control global oil supply and markets in response to a deluge of U.S. shale supply hitting the markets at that time.
OPEC members:
- 🇮🇷 Iran*
- 🇮🇶 Iraq*
- 🇰🇼 Kuwait*
- 🇸🇦 Saudi Arabia*
- 🇻🇪 Venezuela*
- 🇩🇿 Algeria
- 🇦🇴 Angola
- 🇬🇶 Equatorial Guinea
- 🇬🇦 Gabon
- 🇱🇾 Libya
- 🇳🇬 Nigeria
- 🇨🇩 Republic of the Congo
- 🇦🇪 United Arab Emirates
* Founding members
OPEC+ members:
- 🇷🇺 Russia
- 🇲🇽 Mexico
- 🇰🇿 Kazakhstan
- 🇲🇾 Malaysia
- 🇦🇿 Azerbaijan
- 🇧🇭 Bahrain
- 🇧🇳 Brunei
- 🇴🇲 Oman
- 🇸🇩 Sudan
- 🇸🇸 South Sudan
Although OPEC and OPEC+ members supply a significant part of U.S. crude oil and petroleum imports, America has avoided overdependence on the group by instead building strong ties with neighboring exporters Canada and Mexico.
Crude Oil Imports Capitalize on U.S. Refineries
While the U.S. has been a net exporter of crude oil and petroleum products the past two years, exporting 3.15 billion barrels while importing 3.09 billion barrels in 2021, crude oil-only trade tells a different story.
In terms of just crude oil trade, the U.S. was a significant net importer, with 2.23 billion barrels of crude oil imports and only 1.08 billion barrels of crude oil exports. But with the U.S. being the world’s largest crude oil producer, why is this?
As noted earlier, neighboring Canada makes up larger shares of U.S. crude oil imports compared to crude oil and petroleum product imports. Similarly, Mexico reaches 10% of America’s crude oil imports when excluding petroleum products.
Maximizing imports from neighboring countries makes sense on multiple fronts for all parties due to lower transportation costs and risks, and it’s no surprise Canada and Mexico are providing large shares of just crude oil as well. With such a large collection of oil refineries across the border, it’s ultimately more cost-efficient for Canada and Mexico to tap into U.S. oil refining rather than refining domestically.
In turn, Mexico is the largest importer of U.S. produced gasoline and diesel fuel, and Canada is the third-largest importer of American-produced refined petroleum products.
Replacing Russian Crude Oil Imports
While Russia only makes up 8% of American petroleum product imports, their 254 million barrels will need to be replaced as both countries ceased trading soon after Russia’s invasion of Ukraine.
In an effort to curb rising oil and gasoline prices, in March President Joe Biden announced the release of up to 180 million barrels from the U.S. Strategic Petroleum Reserves. Other IEA nations are also releasing emergency oil reserves in an attempt to curb rising prices at the pump and volatility in the oil market.
While the U.S. and the rest of the world are still managing the short-term solutions to this oil supply gap, the long-term solution is complex and has various moving parts. From ramping up domestic oil production to replacing oil demand with other cleaner energy solutions, oil trade and imports will remain a vital part of America’s energy supply.


Energy
Charted: 4 Reasons Why Lithium Could Be the Next Gold Rush
Visual Capitalist has partnered with EnergyX to show why drops in prices and growing demand may make now the right time to invest in lithium.


4 Reasons Why You Should Invest in Lithium
Lithium’s importance in powering EVs makes it a linchpin of the clean energy transition and one of the world’s most precious minerals.
In this graphic, Visual Capitalist partnered with EnergyX to explore why now may be the time to invest in lithium.
1. Lithium Prices Have Dropped
One of the most critical aspects of evaluating an investment is ensuring that the asset’s value is higher than its price would indicate. Lithium is integral to powering EVs, and, prices have fallen fast over the last year:
| Date | LiOH·H₂O* | Li₂CO₃** |
|---|---|---|
| Feb 2023 | $76 | $71 |
| March 2023 | $71 | $61 |
| Apr 2023 | $43 | $33 |
| May 2023 | $43 | $33 |
| June 2023 | $47 | $45 |
| July 2023 | $44 | $40 |
| Aug 2023 | $35 | $35 |
| Sept 2023 | $28 | $27 |
| Oct 2023 | $24 | $23 |
| Nov 2023 | $21 | $21 |
| Dec 2023 | $17 | $16 |
| Jan 2024 | $14 | $15 |
| Feb 2024 | $13 | $14 |
Note: Monthly spot prices were taken as close to the 14th of each month as possible.
*Lithium hydroxide monohydrate MB-LI-0033
**Lithium carbonate MB-LI-0029
2. Lithium-Ion Battery Prices Are Also Falling
The drop in lithium prices is just one reason to invest in the metal. Increasing economies of scale, coupled with low commodity prices, have caused the cost of lithium-ion batteries to drop significantly as well.
In fact, BNEF reports that between 2013 and 2023, the price of a Li-ion battery dropped by 82%.
| Year | Price per KWh |
|---|---|
| 2023 | $139 |
| 2022 | $161 |
| 2021 | $150 |
| 2020 | $160 |
| 2019 | $183 |
| 2018 | $211 |
| 2017 | $258 |
| 2016 | $345 |
| 2015 | $448 |
| 2014 | $692 |
| 2013 | $780 |

3. EV Adoption is Sustainable
One of the best reasons to invest in lithium is that EVs, one of the main drivers behind the demand for lithium, have reached a price point similar to that of traditional vehicle.
According to the Kelly Blue Book, Tesla’s average transaction price dropped by 25% between 2022 and 2023, bringing it in line with many other major manufacturers and showing that EVs are a realistic transport option from a consumer price perspective.
| Manufacturer | September 2022 | September 2023 |
|---|---|---|
| BMW | $69,000 | $72,000 |
| Ford | $54,000 | $56,000 |
| Volkswagon | $54,000 | $56,000 |
| General Motors | $52,000 | $53,000 |
| Tesla | $68,000 | $51,000 |
4. Electricity Demand in Transport is Growing
As EVs become an accessible transport option, there’s an investment opportunity in lithium. But possibly the best reason to invest in lithium is that the IEA reports global demand for the electricity in transport could grow dramatically by 2030:
| Transport Type | 2022 | 2025 | 2030 |
|---|---|---|---|
| Buses 🚌 | 23,000 GWh | 50,000 GWh | 130,000 GWh |
| Cars 🚙 | 65,000 GWh | 200,000 GWh | 570,000 GWh |
| Trucks 🛻 | 4,000 GWh | 15,000 GWh | 94,000 GWh |
| Vans 🚐 | 6,000 GWh | 16,000 GWh | 72,000 GWh |
The Lithium Investment Opportunity
Lithium presents a potentially classic investment opportunity. Lithium and battery prices have dropped significantly, and recently, EVs have reached a price point similar to other vehicles. By 2030, the demand for clean energy, especially in transport, will grow dramatically.
With prices dropping and demand skyrocketing, now is the time to invest in lithium.
EnergyX is poised to exploit lithium demand with cutting-edge lithium extraction technology capable of extracting 300% more lithium than current processes.

-

 Lithium5 days ago
Ranked: The Top 10 EV Battery Manufacturers in 2023
Asia dominates this ranking of the world’s largest EV battery manufacturers in 2023.
-

 Energy1 week ago
The World’s Biggest Nuclear Energy Producers
China has grown its nuclear capacity over the last decade, now ranking second on the list of top nuclear energy producers.
-

 Energy1 month ago
The World’s Biggest Oil Producers in 2023
Just three countries accounted for 40% of global oil production last year.
-

 Energy1 month ago
How Much Does the U.S. Depend on Russian Uranium?
Currently, Russia is the largest foreign supplier of nuclear power fuel to the U.S.
-

 Uranium2 months ago
Charted: Global Uranium Reserves, by Country
We visualize the distribution of the world’s uranium reserves by country, with 3 countries accounting for more than half of total reserves.
-

 Energy3 months ago
Visualizing the Rise of the U.S. as Top Crude Oil Producer
Over the last decade, the United States has established itself as the world’s top producer of crude oil, surpassing Saudi Arabia and Russia.


-

 Debt1 week ago
How Debt-to-GDP Ratios Have Changed Since 2000
-

 Countries2 weeks ago
Population Projections: The World’s 6 Largest Countries in 2075
-

 Markets2 weeks ago
The Top 10 States by Real GDP Growth in 2023
-

 Demographics2 weeks ago
The Smallest Gender Wage Gaps in OECD Countries
-

 Economy2 weeks ago
Where U.S. Inflation Hit the Hardest in March 2024
-

 Green2 weeks ago
Top Countries By Forest Growth Since 2001
-

 United States2 weeks ago
Ranked: The Largest U.S. Corporations by Number of Employees
-

 Maps2 weeks ago
The Largest Earthquakes in the New York Area (1970-2024)