How Battery Metals Can Power Energy Independence in America
How Battery Metals Can Power Energy Independence in America
The U.S. has been historically dependent on foreign sources of energy to meet the needs of domestic consumption.
However, as the country transitions to clean energy and electrified transport, the raw materials behind green technologies offer an opportunity to build an energy-independent future. As clean energy technologies grow, the U.S. can reshore energy production for the future by investing in domestic mineral supply chains, from mine to battery.
This infographic from our sponsor Surge Battery Metals highlights the state of America’s energy transition and explains how battery metals can help in enabling energy independence. This is part three of the Energy Independence Series.
America’s Energy Transition in Numbers
The United States may not be on track to reach its climate goals yet, but the country’s energy transition is well underway.
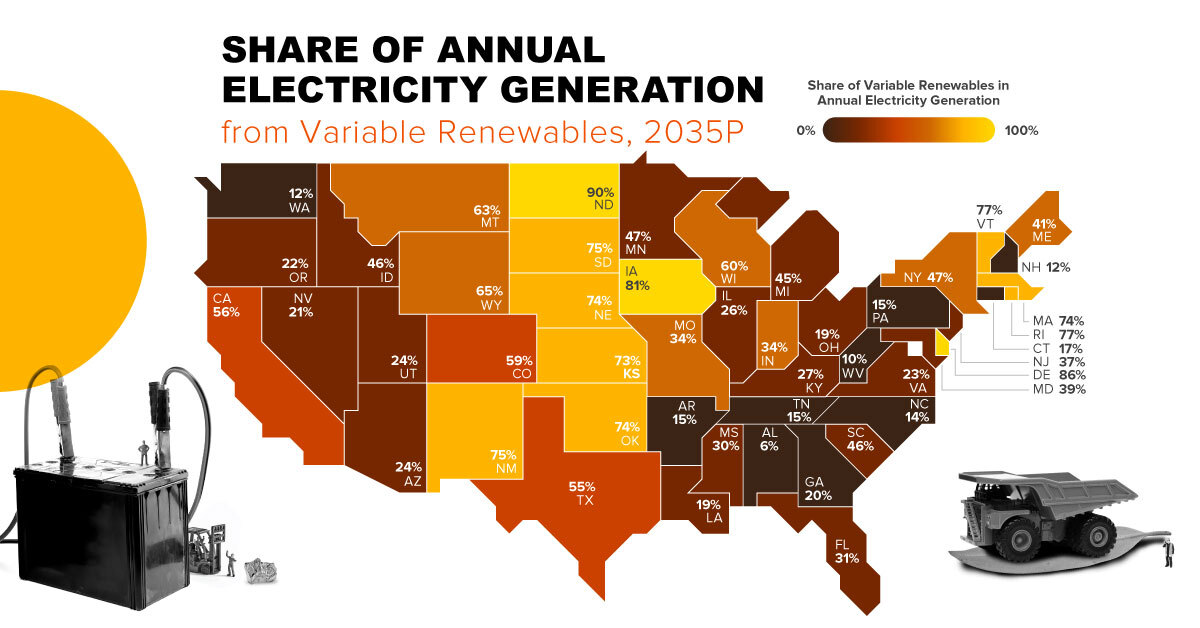
For example, no new coal-fired power plants have come online since 2013, and the energy sector has retired 30% of its coal-fired capacity since 2010. In turn, the decline in coal-fired generation is being offset by new renewable capacity.
| Energy Source | Net Capacity Additions (2021-2025P, megawatts) | 2021 Total Capacity (megawatts) | Net Capacity Additions as % of Current Capacity |
|---|---|---|---|
| Coal | -33,072.0 | 210,000 | -16% |
| Nuclear | -5,913.8 | 95,000 | -6% |
| Natural Gas | 18,151.8 | 491,000 | 4% |
| Wind | 33,433.9 | 132,400 | 25% |
| Solar | 51,241.7 | 61,000 | 84% |
| U.S. Total | 63,841.6 | 989,400 | 6% |
U.S. solar generation capacity is projected to nearly double, increasing 84% by 2025 relative to 2021 levels. Wind capacity, which is already twice that of solar, is projected to increase by 25% by 2025.
Alongside renewables, the U.S. electric vehicle (EV) market is charging ahead. The Biden Administration is targeting 50% of all new car sales to be zero-emissions by 2030, and this requires a significant uptick in EV adoption. Consequently, the government is pouring billions into supporting EVs through the Inflation Reduction Act, which includes funding for charging infrastructure and EV purchase incentives.
Moreover, battery manufacturers are flocking to North America as the region seeks to reduce reliance on imports from China.
The expansions in clean energy capacity, EV adoption, and battery manufacturing mean that the U.S. will need more battery metals like lithium and nickel. These metals are key to developing energy storage for renewables, and of course, batteries for EVs.
The Need for Battery Metals
The U.S. is projected to sell 17.5 million electric cars in 2030. What does that mean for metal demand?
According to the IEA, the average electric car contains about 8.9kg of lithium and 39.9kg of nickel. Based on these figures, here’s how much of each the U.S. would need for 17.5 million electric cars:
- 155,928 tonnes of lithium in 2030
- 699,048 tonnes of nickel in 2030
Currently, the U.S. produces less than 0.1% and 3% of the lithium and nickel needed in 2030, respectively. While these are approximate figures based on the above projections, they show how current production is lagging relative to future demand.
With a high reliance on imports for both lithium and nickel, the U.S. needs to reshore the production of battery metals. Domestic production of these metals is not only critical for clean energy and EVs but also for an energy-independent future.
>> Surge Battery Metals is focused on exploring North American deposits of lithium and nickel, furthering the potential to develop domestic battery metal sources.

-

 Lithium4 days ago
Ranked: The Top 10 EV Battery Manufacturers in 2023
Asia dominates this ranking of the world’s largest EV battery manufacturers in 2023.
-

 Energy1 week ago
The World’s Biggest Nuclear Energy Producers
China has grown its nuclear capacity over the last decade, now ranking second on the list of top nuclear energy producers.
-

 Energy1 month ago
The World’s Biggest Oil Producers in 2023
Just three countries accounted for 40% of global oil production last year.
-

 Energy1 month ago
How Much Does the U.S. Depend on Russian Uranium?
Currently, Russia is the largest foreign supplier of nuclear power fuel to the U.S.
-

 Uranium2 months ago
Charted: Global Uranium Reserves, by Country
We visualize the distribution of the world’s uranium reserves by country, with 3 countries accounting for more than half of total reserves.
-

 Energy3 months ago
Visualizing the Rise of the U.S. as Top Crude Oil Producer
Over the last decade, the United States has established itself as the world’s top producer of crude oil, surpassing Saudi Arabia and Russia.


