

Inflation has impacted various car ownership costs in America, including prices for new and used cars, parts, and insurance.
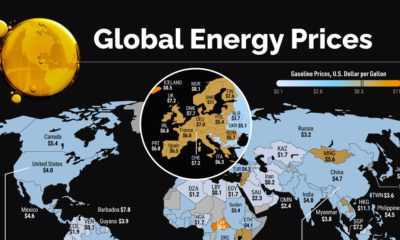

Energy prices have been extremely volatile in 2022. Which countries are seeing the highest prices in the world?
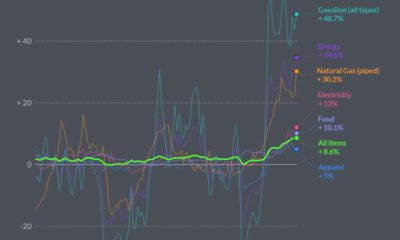

In May 2022, U.S. Inflation was the highest its been since 1981. Here’s a look at which products saw the biggest price jumps.
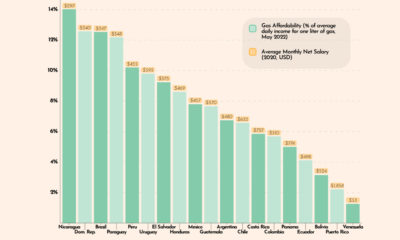

This graphic looks at gas affordability in Latin America, showing how much a liter of gas costs in 19 countries, relative to average incomes.
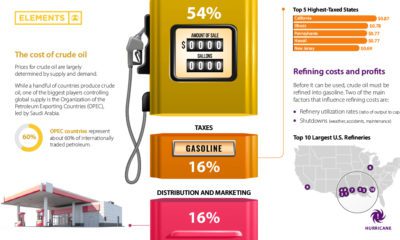

Gasoline prices across the U.S. have reached record-highs. Why? This graphic helps explain what factors influence the cost of gasoline.
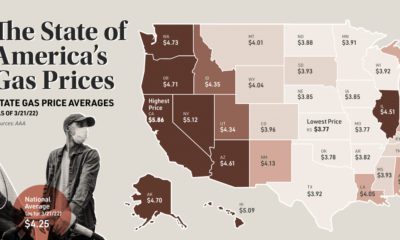

This map looks at gas prices across various states, and historical context for today's sky-high prices at the pump.
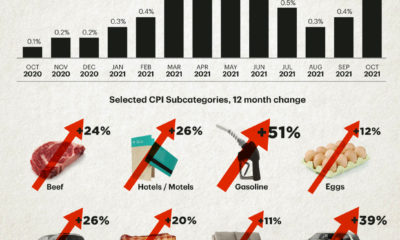

The U.S. inflation rate has seen its fastest annual increase in over 30 years. Which consumer spending categories have been hit the hardest?
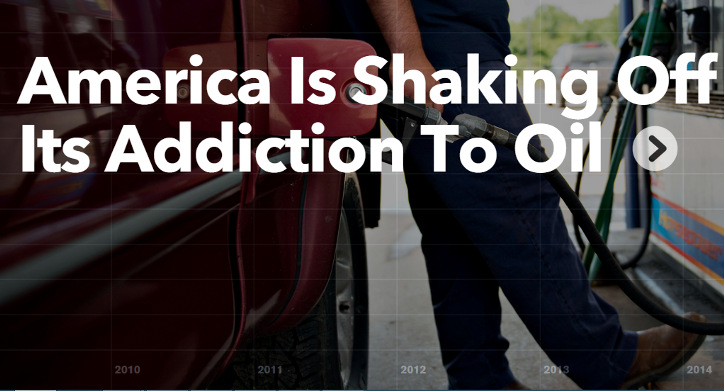
With gas prices as low as they have been since 2010, America's oil addiction is waning.


 Creator Program