Money
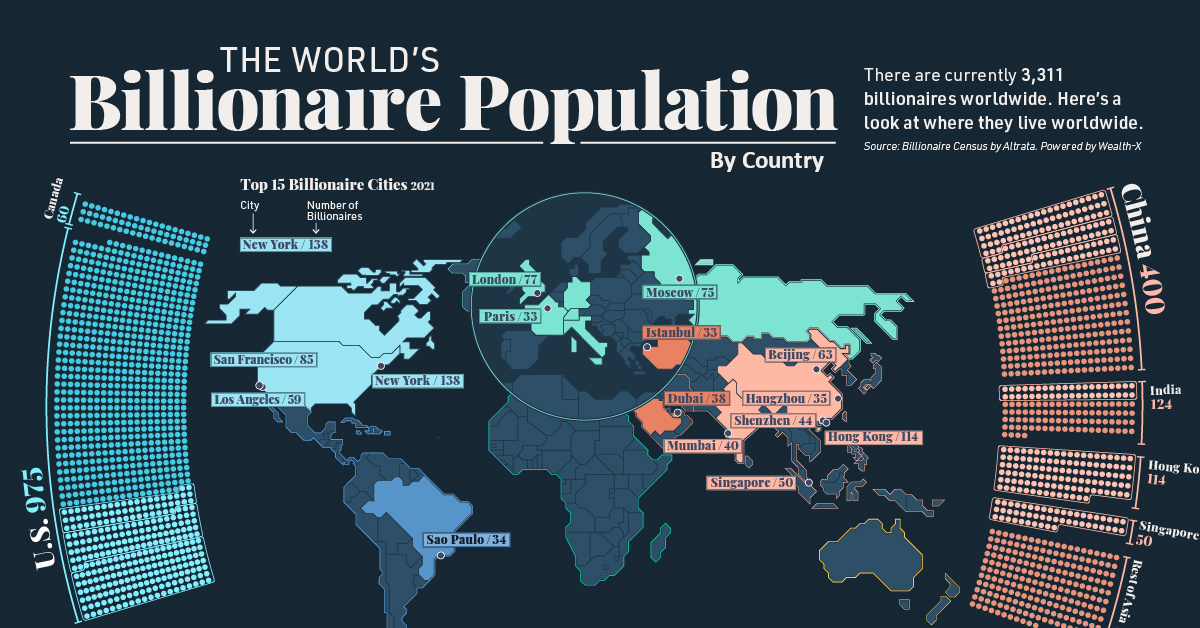
Mapped: The World’s Billionaire Population, by Country


Visualized: The World’s Billionaire Population
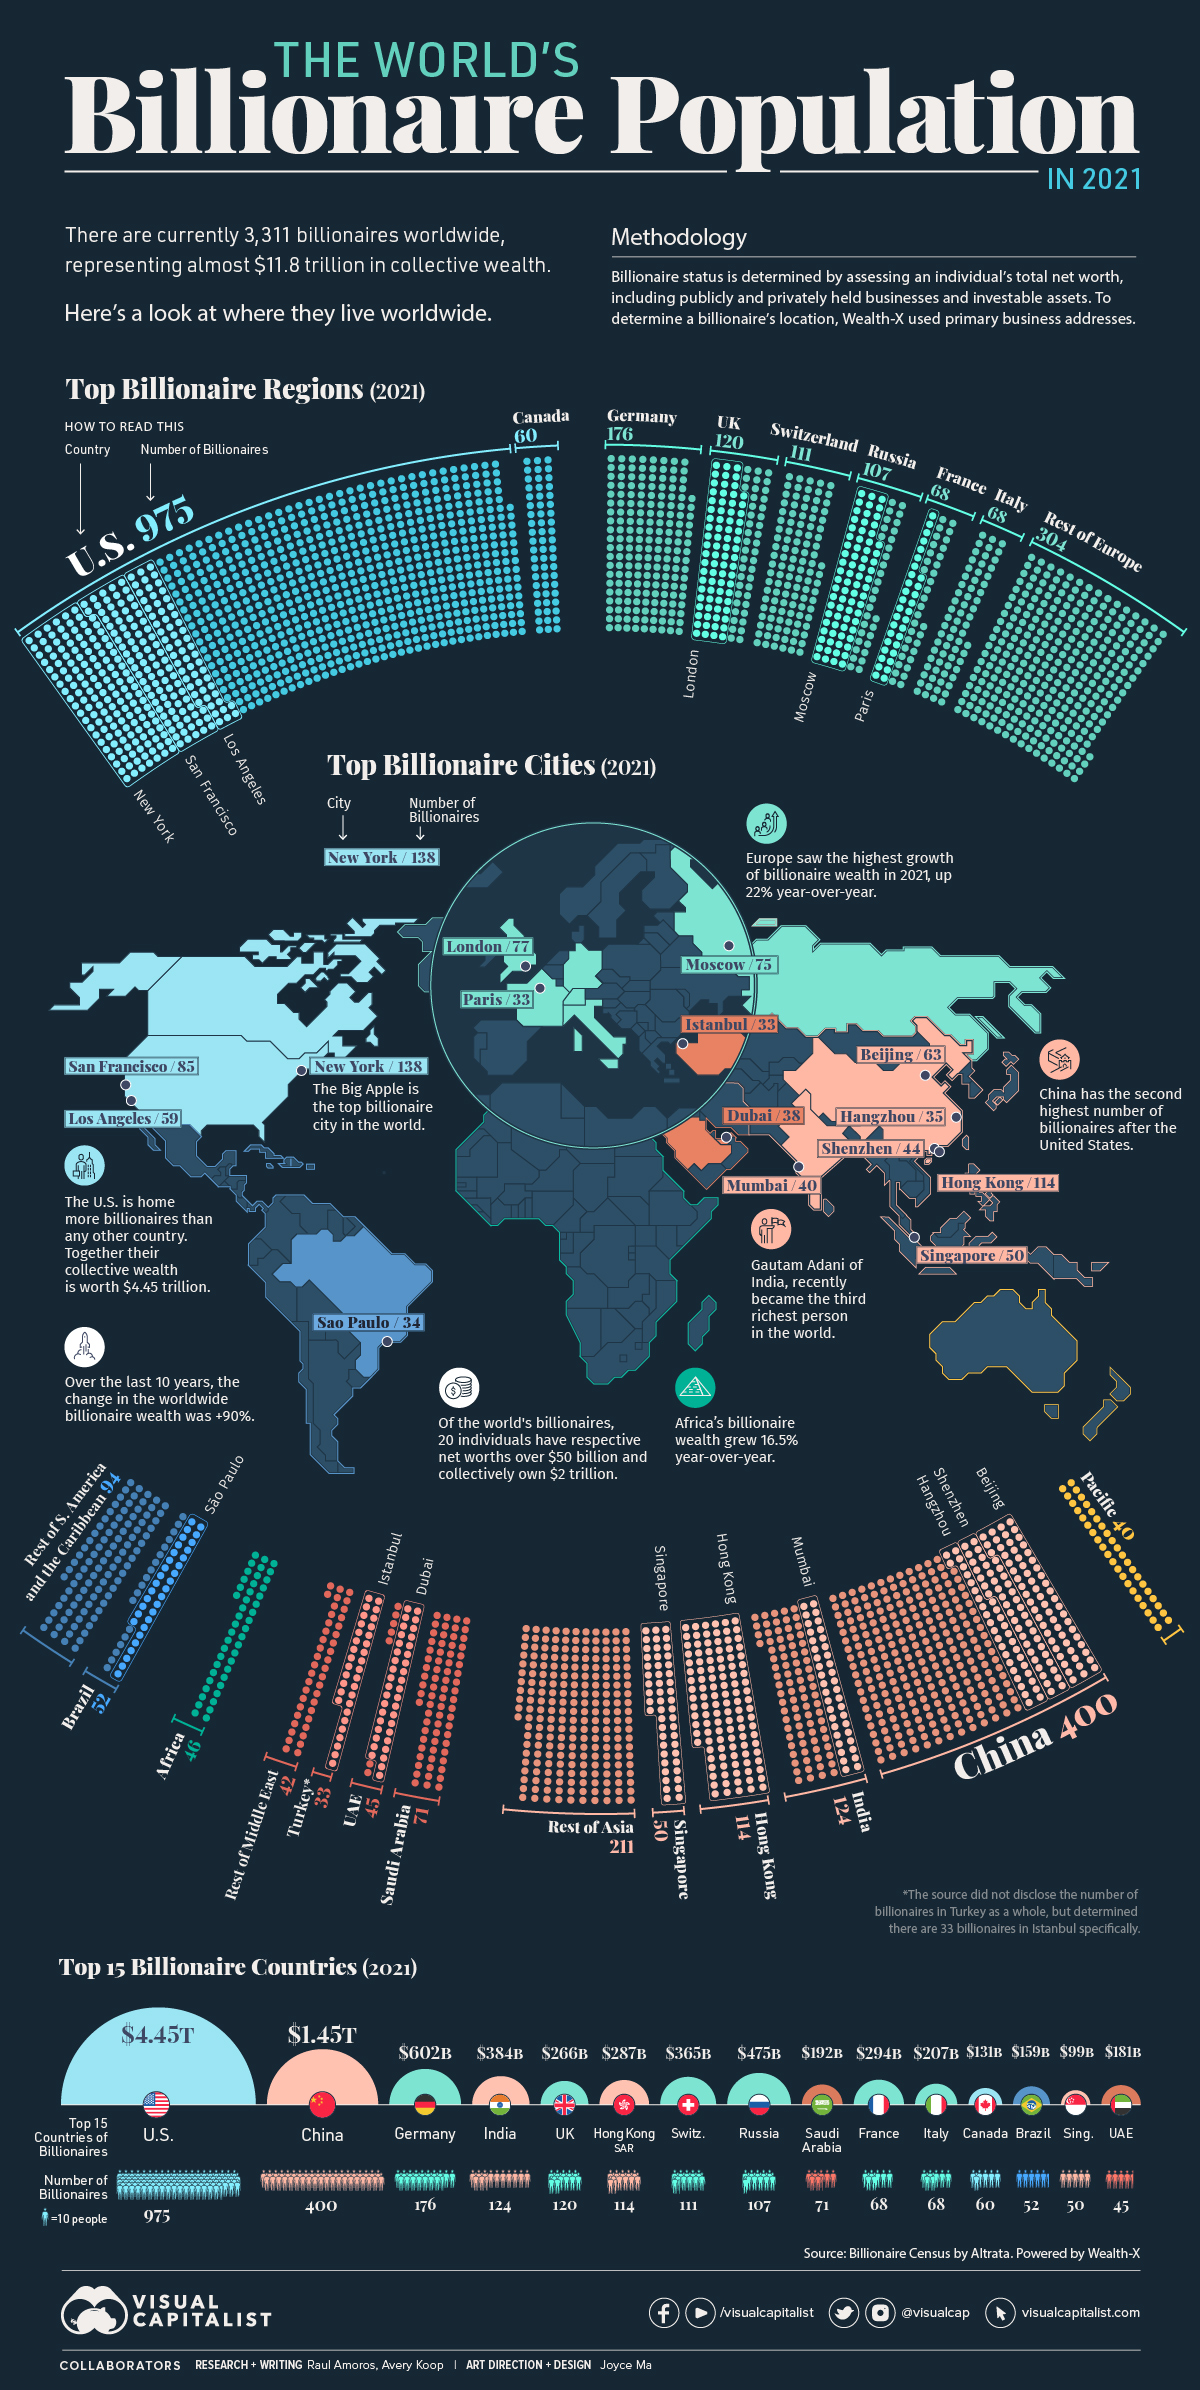
The world’s billionaires—only 3,311 individuals—represent almost $11.8 trillion in wealth. The global billionaire population continued to grow in 2021, increasing by 3%. Over the same period, billionaire wealth also increased by 18%.
This map uses data from the Wealth-X Billionaire Census to visualize where the world’s billionaires live and breaks down their collective wealth.
Note on methodology: The report uses proprietary data from Wealth-X. Billionaire status is determined by assessing an individual’s total net worth, including publicly and privately held businesses and investable assets. To determine a billionaire’s location, Wealth-X used their primary business address.
Billionaires by Region
We’ll begin by zooming out to look at how various continents and world regions rank in terms of their billionaire population.
North America is home to most billionaires, worth $4.6 trillion. The U.S., unsurprisingly, accounts for the majority of this wealth, with 975 billionaires and a collective net worth of $4.45 trillion.
| Rank | Region | Number of billionaires | Collective Billionaire Wealth |
|---|---|---|---|
| #1 | North America | 1,035 | $4.6 trillion |
| #2 | Europe | 954 | $3.1 trillion |
| #3 | Asia | 899 | $2.9 trillion |
| #4 | Middle East | 191 | $519 billion |
| #5 | Latin America and the Caribbean | 146 | $465 billion |
| #6 | Africa | 46 | $104 billion |
| #7 | Pacific | 40 | $89 billion |
In regional terms, Europe’s billionaire wealth is growing the fastest, up 22% year-over-year in 2021. In contrast, the year-over-year change in the Middle East was -12.5%.
Asia is inching towards Europe, holding almost a quarter of all billionaire wealth worldwide, compared to Europe’s 26.5%.
Wealth in Africa will also be important to watch in coming years. Although only home to 46 billionaires currently, the change in billionaire wealth increased by almost 17% year-over-year. Additionally, while they no longer live there, a number of the world’s billionaires hail from African countries originally.
Billionaires by Country
Now, let’s look at the ranking broken down by the top 15 countries:
| Rank | Country | Number of Billionaires | Collective Billionaire Wealth |
|---|---|---|---|
| #1 | 🇺🇸 US | 975 | $4.45 trillion |
| #2 | 🇨🇳 China | 400 | $1.45 trillion |
| #3 | 🇩🇪 Germany | 176 | $602 billion |
| #4 | 🇮🇳 India | 124 | $384 billion |
| #5 | 🇬🇧 UK | 120 | $266 billion |
| #6 | 🇭🇰 Hong Kong SAR | 114 | $287 billion |
| #7 | 🇨🇭 Switzerland | 111 | $365 billion |
| #8 | 🇷🇺 Russia | 107 | $475 billion |
| #9 | 🇸🇦 Saudi Arabia | 71 | $192 billion |
| #10 | 🇫🇷 France | 68 | $294 billion |
| #11 | 🇮🇹 Italy | 68 | $207 billion |
| #12 | 🇨🇦 Canada | 60 | $131 billion |
| #13 | 🇧🇷 Brazil | 52 | $159 billion |
| #14 | 🇸🇬 Singapore | 50 | $99 billion |
| #15 | 🇦🇪 UAE | 45 | $181 billion |
China is an obvious second in billionaire wealth to the United States, with famous billionaires like Zhang Yiming ($44.5 billion) of TikTok and Zhong Shanshan ($67.1 billion), whose wealth primarily comes from the pharmaceutical and beverages industries.
That said, Chinese billionaire wealth actually decreased 2% last year. It was India that came out on top in terms of growth, seeing a 19% increase in 2021.
Billionaires by City
Looking at cities, New York is home to the most billionaires—with 13 added billionaire residents last year—followed by Hong Kong.
| Rank | City | Country | Number of Billionaires |
|---|---|---|---|
| #1 | New York City | 🇺🇸 U.S. | 138 |
| #2 | Hong Kong | 🇭🇰 China | 114 |
| #3 | San Francisco | 🇺🇸 U.S. | 85 |
| #4 | London | 🇬🇧 UK | 77 |
| #5 | Moscow | 🇷🇺 Russia | 75 |
| #6 | Beijing | 🇨🇳 China | 63 |
| #7 | Los Angeles | 🇺🇸 U.S. | 59 |
| #8 | Singapore | 🇸🇬 Singapore | 50 |
| #9 | Shenzhen | 🇨🇳 China | 44 |
| #10 | Mumbai | 🇮🇳 India | 40 |
| #11 | Dubai | 🇦🇪 UAE | 38 |
| #12 | Hangzhou | 🇨🇳 China | 35 |
| #13 | São Paulo | 🇧🇷 Brazil | 34 |
| #14 | Istanbul | 🇹🇷 Turkey | 33 |
| #15 | Paris | 🇫🇷 France | 33 |
Billionaire Wealth in 2022
Billionaires have significant power and influence, not in the least because their collective wealth is equivalent to about 11.8% of global GDP.
In recent billionaire news, Gautam Adani’s wealth has been soaring, most recently hitting the $145 billion mark, making him the third-richest person in the world according to Bloomberg’s Billionaire Index. However, not all billionaires are holding on to their wealth. Patagonia founder, Yvon Chouinard, recently transferred ownership of his company to an organization that fights climate change.
Over the last decade, billionaires have been grown their fortunes considerably, with wealth increasing at a faster rate than the growth in the number of billionaires themselves. According to Wealth-X, collective billionaire net worth grew by an astonishing 90% in the last 10 years.
But in the shorter term, the situation is often more volatile. With markets reeling in 2022, Bloomberg reported that billionaires lost a record $1.4 trillion over the first half of the year. Once the year is over and the final numbers are in, it will be interesting to see how the billionaire landscape shapes up in comparison to the more long-term trend.


Money
Charted: Which City Has the Most Billionaires in 2024?
Just two countries account for half of the top 20 cities with the most billionaires. And the majority of the other half are found in Asia.


Charted: Which Country Has the Most Billionaires in 2024?
This was originally posted on our Voronoi app. Download the app for free on iOS or Android and discover incredible data-driven charts from a variety of trusted sources.
Some cities seem to attract the rich. Take New York City for example, which has 340,000 high-net-worth residents with investable assets of more than $1 million.
But there’s a vast difference between being a millionaire and a billionaire. So where do the richest of them all live?
Using data from the Hurun Global Rich List 2024, we rank the top 20 cities with the highest number of billionaires in 2024.
A caveat to these rich lists: sources often vary on figures and exact rankings. For example, in last year’s reports, Forbes had New York as the city with the most billionaires, while the Hurun Global Rich List placed Beijing at the top spot.
Ranked: Top 20 Cities with the Most Billionaires in 2024
The Chinese economy’s doldrums over the course of the past year have affected its ultra-wealthy residents in key cities.
Beijing, the city with the most billionaires in 2023, has not only ceded its spot to New York, but has dropped to #4, overtaken by London and Mumbai.
| Rank | City | Billionaires | Rank Change YoY |
|---|---|---|---|
| 1 | 🇺🇸 New York | 119 | +1 |
| 2 | 🇬🇧 London | 97 | +3 |
| 3 | 🇮🇳 Mumbai | 92 | +4 |
| 4 | 🇨🇳 Beijing | 91 | -3 |
| 5 | 🇨🇳 Shanghai | 87 | -2 |
| 6 | 🇨🇳 Shenzhen | 84 | -2 |
| 7 | 🇭🇰 Hong Kong | 65 | -1 |
| 8 | 🇷🇺 Moscow | 59 | No Change |
| 9 | 🇮🇳 New Delhi | 57 | +6 |
| 10 | 🇺🇸 San Francisco | 52 | No Change |
| 11 | 🇹🇭 Bangkok | 49 | +2 |
| 12 | 🇹🇼 Taipei | 45 | +2 |
| 13 | 🇫🇷 Paris | 44 | -2 |
| 14 | 🇨🇳 Hangzhou | 43 | -5 |
| 15 | 🇸🇬 Singapore | 42 | New to Top 20 |
| 16 | 🇨🇳 Guangzhou | 39 | -4 |
| 17T | 🇮🇩 Jakarta | 37 | +1 |
| 17T | 🇧🇷 Sao Paulo | 37 | No Change |
| 19T | 🇺🇸 Los Angeles | 31 | No Change |
| 19T | 🇰🇷 Seoul | 31 | -3 |
In fact all Chinese cities on the top 20 list have lost billionaires between 2023–24. Consequently, they’ve all lost ranking spots as well, with Hangzhou seeing the biggest slide (-5) in the top 20.
Where China lost, all other Asian cities—except Seoul—in the top 20 have gained ranks. Indian cities lead the way, with New Delhi (+6) and Mumbai (+3) having climbed the most.
At a country level, China and the U.S combine to make up half of the cities in the top 20. They are also home to about half of the world’s 3,200 billionaire population.
In other news of note: Hurun officially counts Taylor Swift as a billionaire, estimating her net worth at $1.2 billion.

-

 Debt1 week ago
How Debt-to-GDP Ratios Have Changed Since 2000
-

 Markets2 weeks ago
Ranked: The World’s Top Flight Routes, by Revenue
-

 Countries2 weeks ago
Population Projections: The World’s 6 Largest Countries in 2075
-

 Markets2 weeks ago
The Top 10 States by Real GDP Growth in 2023
-

 Demographics2 weeks ago
The Smallest Gender Wage Gaps in OECD Countries
-

 United States2 weeks ago
Where U.S. Inflation Hit the Hardest in March 2024
-

 Green2 weeks ago
Top Countries By Forest Growth Since 2001
-

 United States2 weeks ago
Ranked: The Largest U.S. Corporations by Number of Employees