Wealth
Mapped: How Much Does it Take to be the Top 1% in Each U.S. State?
How Much Does it Take to be the Top 1% in Each U.S. State?
There’s an old saying: everyone thinks that they’re middle-class.
But how many people think, or know, that they really belong to the top 1% in the country?
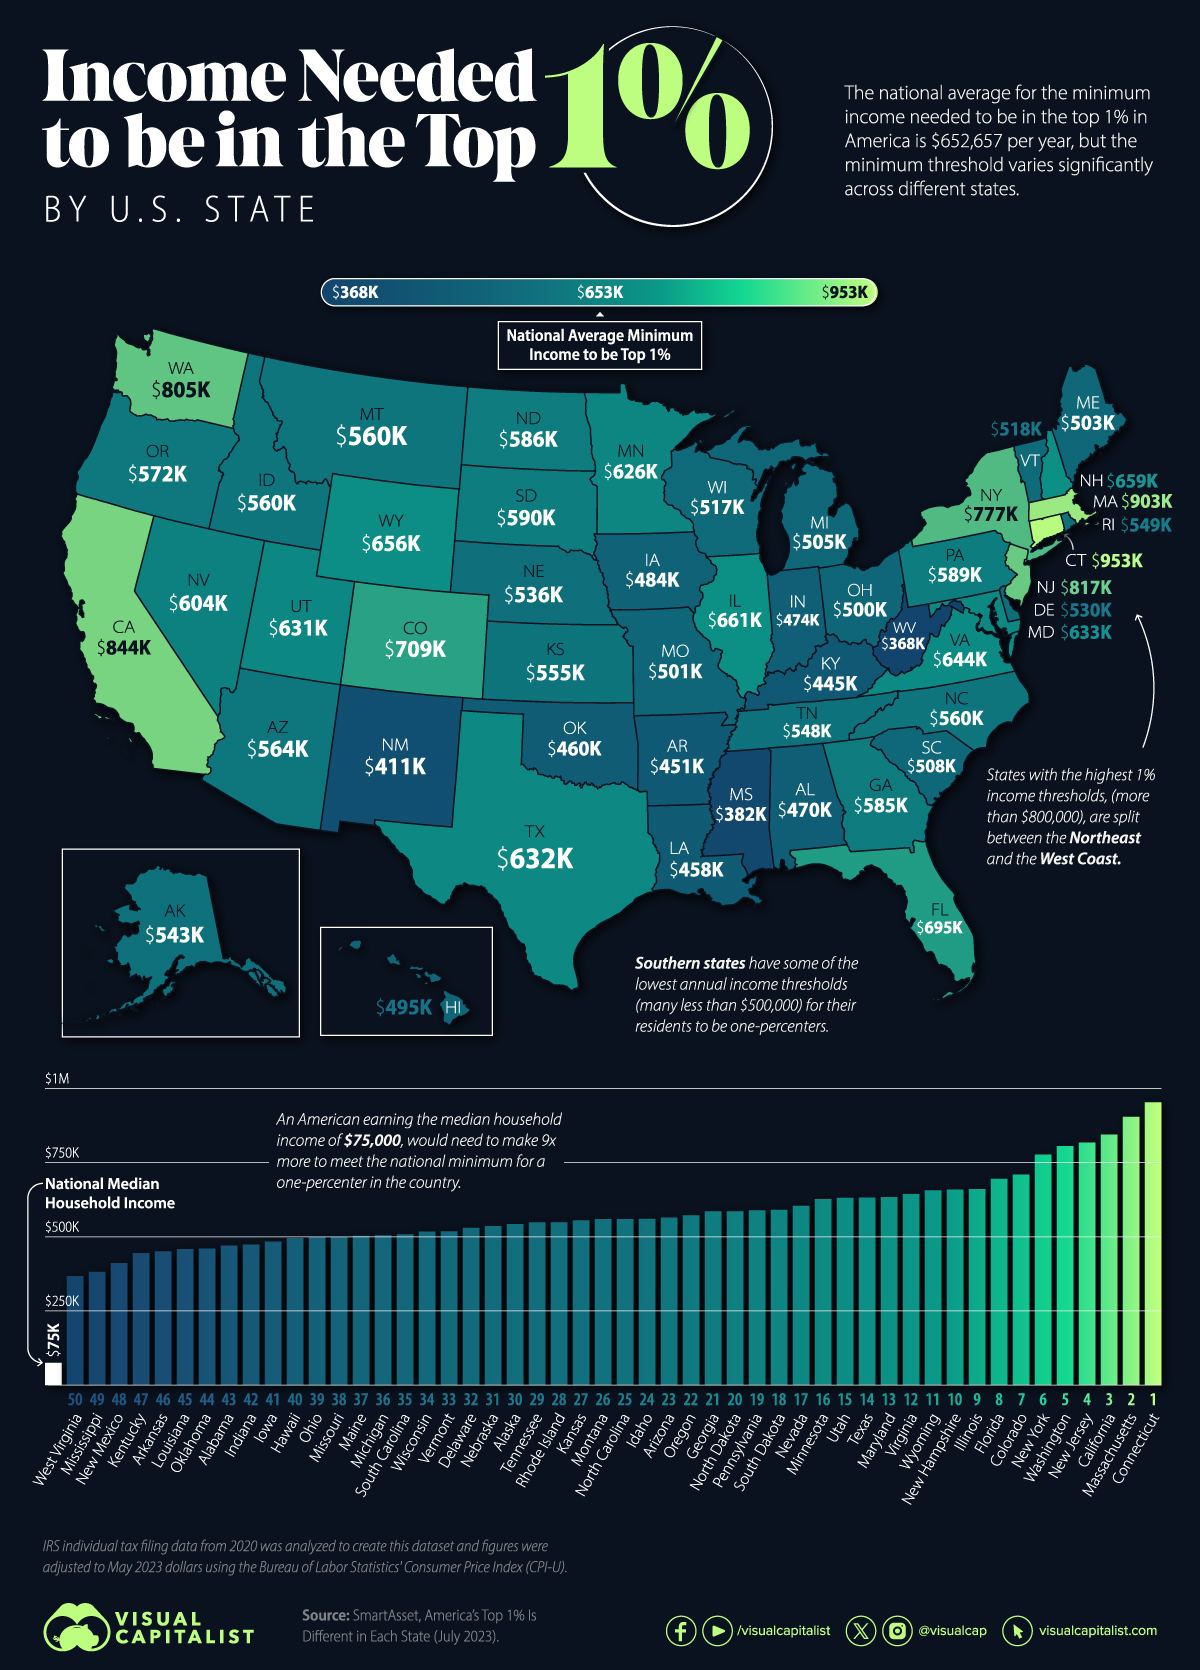
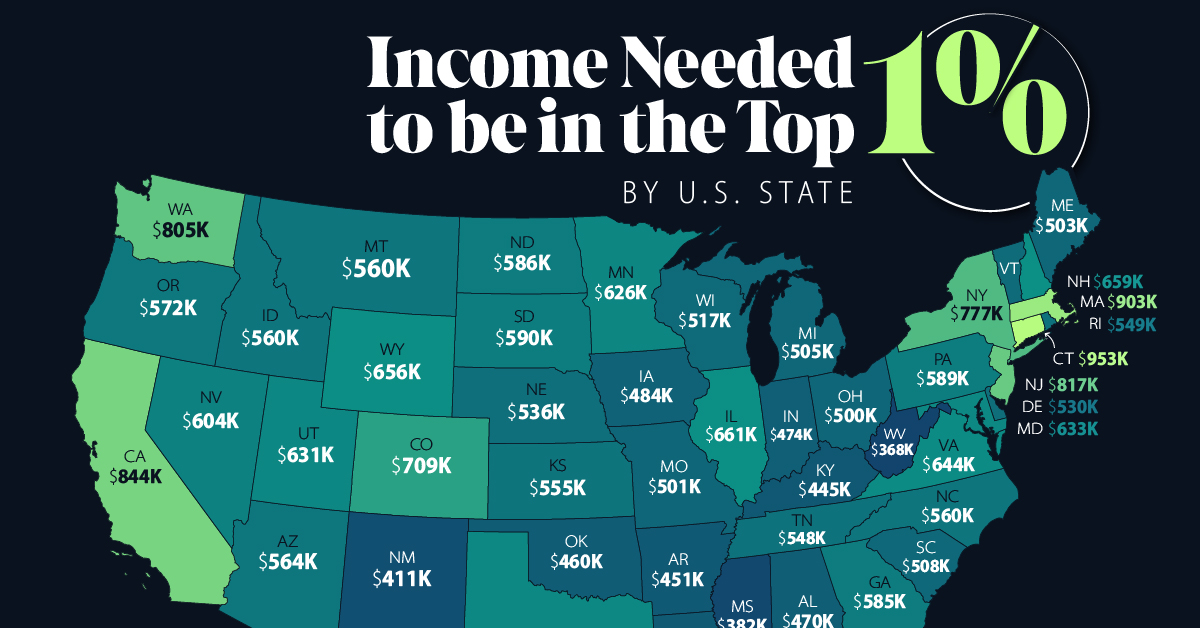
Data from personal finance advisory services company, SmartAsset, reveals the annual income threshold at which a household can be considered part of the top 1% in their state.
Some states demand a much higher yearly earnings from their residents to be a part of the rarefied league, but which ones are they, and how much does one need to earn to make it to the very top echelon of income?
Ranking U.S. States By Income to Be in the Top 1%
At the top of the list, a household in Connecticut needs to earn nearly $953,000 annually to be part of the one-percenters. This is the highest minimum threshold across the country.
In the same region, Massachusetts requires a minimum annual earnings of $903,401 from its top 1% residents.
Here’s the list of all 50 U.S. states along with the annual income needed to be in the 1%.
| Rank | State | Top 1% Income Threshold | Top 1% Tax Rate (% of annual income) |
|---|---|---|---|
| 1 | Connecticut | $952,902 | 28.40% |
| 2 | Massachusetts | $903,401 | 27.15% |
| 3 | California | $844,266 | 26.95% |
| 4 | New Jersey | $817,346 | 28.01% |
| 5 | Washington | $804,853 | 25.99% |
| 6 | New York | $776,662 | 28.29% |
| 7 | Colorado | $709,092 | 25.86% |
| 8 | Florida | $694,987 | 25.82% |
| 9 | Illinois | $660,810 | 26.35% |
| 10 | New Hampshire | $659,037 | 26.25% |
| 11 | Wyoming | $656,118 | 24.79% |
| 12 | Virginia | $643,848 | 26.11% |
| N/A | National Average | $652,657 | N/A |
| 13 | Maryland | $633,333 | 25.94% |
| 14 | Texas | $631,849 | 25.83% |
| 15 | Utah | $630,544 | 23.77% |
| 16 | Minnesota | $626,451 | 25.53% |
| 17 | Nevada | $603,751 | 25.19% |
| 18 | South Dakota | $590,373 | 22.99% |
| 19 | Pennsylvania | $588,702 | 24.95% |
| 20 | North Dakota | $585,556 | 24.76% |
| 21 | Georgia | $585,397 | 25.06% |
| 22 | Oregon | $571,813 | 24.66% |
| 23 | Arizona | $564,031 | 25.22% |
| 24 | Idaho | $560,040 | 23.17% |
| 25 | North Carolina | $559,762 | 25.31% |
| 26 | Montana | $559,656 | 24.46% |
| 27 | Kansas | $554,912 | 25.03% |
| 28 | Rhode Island | $548,531 | 25.26% |
| 29 | Tennessee | $548,329 | 25.12% |
| 30 | Alaska | $542,824 | 25.38% |
| 31 | Nebraska | $535,651 | 24.10% |
| 32 | Delaware | $529,928 | 25.37% |
| 33 | Vermont | $518,039 | 23.63% |
| 34 | Wisconsin | $517,321 | 24.90% |
| 35 | South Carolina | $508,427 | 24.40% |
| 36 | Michigan | $504,671 | 25.01% |
| 37 | Maine | $502,605 | 24.04% |
| 38 | Missouri | $500,626 | 24.93% |
| 39 | Ohio | $500,253 | 25.09% |
| 40 | Hawaii | $495,263 | 24.12% |
| 41 | Iowa | $483,985 | 24.09% |
| 42 | Indiana | $473,685 | 24.55% |
| 43 | Alabama | $470,341 | 23.82% |
| 44 | Oklahoma | $460,172 | 23.68% |
| 45 | Louisiana | $458,269 | 24.80% |
| 46 | Arkansas | $450,700 | 21.11% |
| 47 | Kentucky | $445,294 | 24.14% |
| 48 | New Mexico | $411,395 | 23.35% |
| 49 | Mississippi | $381,919 | 23.04% |
| 50 | West Virginia | $367,582 | 23.26% |
| N/A | National Median Household Income | $75,000 | N/A |
California ($844,266), New Jersey ($817,346), and Washington ($804,853) round out the top five states with the highest minimum thresholds to make it to their exclusive rich club.
On the other end of the spectrum, the top one-percenters in West Virginia make a minimum of $367,582 a year, the lowest of all the states, and about one-third of the threshold in Connecticut. And just down southwest of the Mountain State, Mississippi’s one-percenters need to make at least $381,919 a year to qualify for the 1%.
A quick glance at the map above also reveals some regional insights.
The Northeast and West Coast, with their large urban and economic hubs, have higher income entry requirements for the top 1% than states in the American South.
This also correlates to the median income by state, a measure showing Massachusetts households make nearly $90,000 a year, compared to Mississippians who take home $49,000 annually.
How Much Do the Top 1% Pay in Taxes?
Meanwhile, if one does make it to the top 1% in states like Connecticut and Massachusetts, expect to pay more in taxes than other states, according to SmartAsset’s analysis.
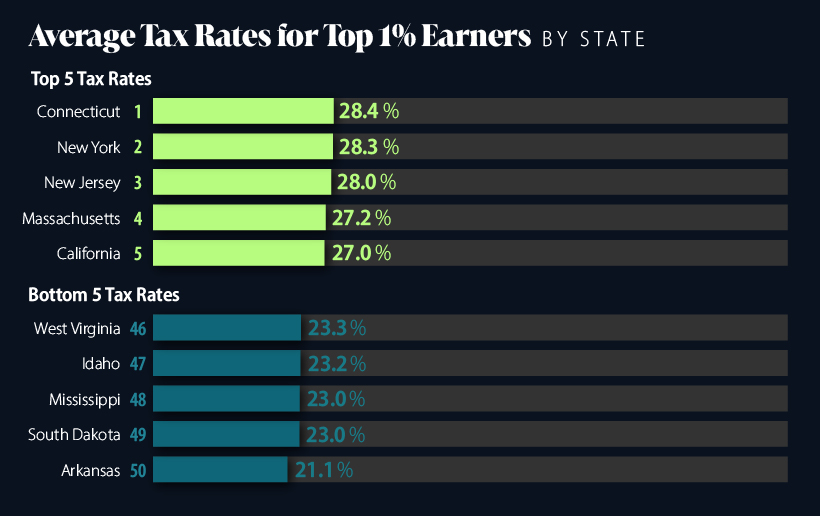
The one-percenters in the top five states pay, on average, between 26–28% of their income in tax, compared to those in the bottom five who pay between 21–23%.
And this pattern exists through the dataset, with higher top 1% income thresholds correlating with higher average tax rates for the wealthy.
| State Ranks | Median Tax Rate |
|---|---|
| Top 10 | 26.65% |
| 20-30 | 25.09% |
| 30-40 | 24.65% |
| 10-20 | 25.07% |
| 40-50 | 23.75% |
These higher tax rates point to attempts to reign in the increasing wealth disparity in the nation where the top 1% hold more than one-third of the country’s wealth, up from 27% in 1989.
Where Does This Data Come From?
Source: SmartAsset’s America’s Top 1% Is Different in Each State uses data from 2020 individual tax filings from the IRS, adjusted to 2023 dollars using the Bureau of Labor Statistics’ Consumer Price Index.


Money
Charted: Which City Has the Most Billionaires in 2024?
Just two countries account for half of the top 20 cities with the most billionaires. And the majority of the other half are found in Asia.


Charted: Which Country Has the Most Billionaires in 2024?
This was originally posted on our Voronoi app. Download the app for free on iOS or Android and discover incredible data-driven charts from a variety of trusted sources.
Some cities seem to attract the rich. Take New York City for example, which has 340,000 high-net-worth residents with investable assets of more than $1 million.
But there’s a vast difference between being a millionaire and a billionaire. So where do the richest of them all live?
Using data from the Hurun Global Rich List 2024, we rank the top 20 cities with the highest number of billionaires in 2024.
A caveat to these rich lists: sources often vary on figures and exact rankings. For example, in last year’s reports, Forbes had New York as the city with the most billionaires, while the Hurun Global Rich List placed Beijing at the top spot.
Ranked: Top 20 Cities with the Most Billionaires in 2024
The Chinese economy’s doldrums over the course of the past year have affected its ultra-wealthy residents in key cities.
Beijing, the city with the most billionaires in 2023, has not only ceded its spot to New York, but has dropped to #4, overtaken by London and Mumbai.
| Rank | City | Billionaires | Rank Change YoY |
|---|---|---|---|
| 1 | 🇺🇸 New York | 119 | +1 |
| 2 | 🇬🇧 London | 97 | +3 |
| 3 | 🇮🇳 Mumbai | 92 | +4 |
| 4 | 🇨🇳 Beijing | 91 | -3 |
| 5 | 🇨🇳 Shanghai | 87 | -2 |
| 6 | 🇨🇳 Shenzhen | 84 | -2 |
| 7 | 🇭🇰 Hong Kong | 65 | -1 |
| 8 | 🇷🇺 Moscow | 59 | No Change |
| 9 | 🇮🇳 New Delhi | 57 | +6 |
| 10 | 🇺🇸 San Francisco | 52 | No Change |
| 11 | 🇹🇭 Bangkok | 49 | +2 |
| 12 | 🇹🇼 Taipei | 45 | +2 |
| 13 | 🇫🇷 Paris | 44 | -2 |
| 14 | 🇨🇳 Hangzhou | 43 | -5 |
| 15 | 🇸🇬 Singapore | 42 | New to Top 20 |
| 16 | 🇨🇳 Guangzhou | 39 | -4 |
| 17T | 🇮🇩 Jakarta | 37 | +1 |
| 17T | 🇧🇷 Sao Paulo | 37 | No Change |
| 19T | 🇺🇸 Los Angeles | 31 | No Change |
| 19T | 🇰🇷 Seoul | 31 | -3 |
In fact all Chinese cities on the top 20 list have lost billionaires between 2023–24. Consequently, they’ve all lost ranking spots as well, with Hangzhou seeing the biggest slide (-5) in the top 20.
Where China lost, all other Asian cities—except Seoul—in the top 20 have gained ranks. Indian cities lead the way, with New Delhi (+6) and Mumbai (+3) having climbed the most.
At a country level, China and the U.S combine to make up half of the cities in the top 20. They are also home to about half of the world’s 3,200 billionaire population.
In other news of note: Hurun officially counts Taylor Swift as a billionaire, estimating her net worth at $1.2 billion.

-

 Education1 week ago
How Hard Is It to Get Into an Ivy League School?
-

 Technology2 weeks ago
Ranked: Semiconductor Companies by Industry Revenue Share
-

 Markets2 weeks ago
Ranked: The World’s Top Flight Routes, by Revenue
-

 Demographics2 weeks ago
Population Projections: The World’s 6 Largest Countries in 2075
-

 Markets2 weeks ago
The Top 10 States by Real GDP Growth in 2023
-

 Demographics2 weeks ago
The Smallest Gender Wage Gaps in OECD Countries
-

 Economy2 weeks ago
Where U.S. Inflation Hit the Hardest in March 2024
-

 Environment2 weeks ago
Top Countries By Forest Growth Since 2001