Markets
Charted: Market Volatility at its Lowest Point Since 2020
Subscribe to the Advisor Channel free mailing list for more like this
Market Volatility at its Lowest Point Since 2020
This was originally posted on Advisor Channel. Sign up to the free mailing list to get beautiful visualizations on financial markets that help advisors and their clients.
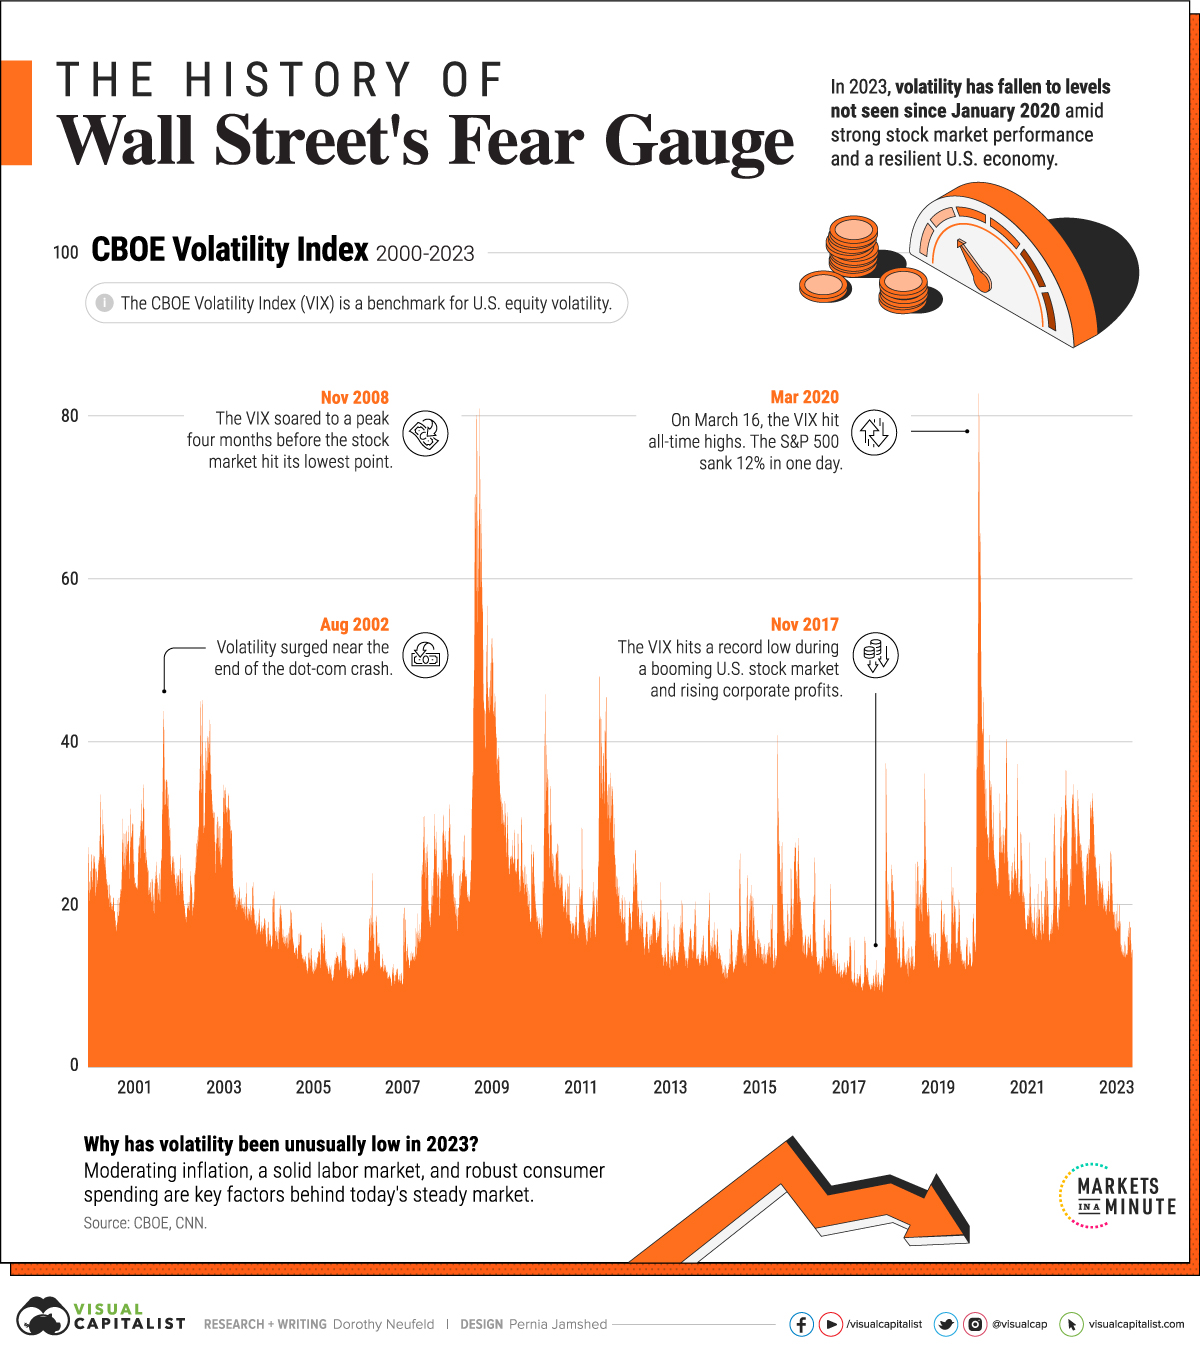
Market volatility has been remarkably low in 2023, apart from the brief shock following the failure of Silicon Valley Bank earlier this year.
In fact, the CBOE Volatility Index (VIX)—a primary gauge for measuring U.S. equity volatility—has fallen to lows not seen since before the pandemic.
This graphic shows how today’s market volatility compares to the last two decades, and the factors that may explain its steadiness, based on data from CBOE.
How is Market Volatility Measured?
The most widely used index to track market volatility is the VIX.
In short, it measures the market’s expectation for price changes in the S&P 500. When investor uncertainty is high, the VIX spikes. For this reason, it serves as a barometer of fear in the market and often has a negative correlation to returns. For instance, when the VIX hit a peak on March 16, 2020, the S&P 500 fell 12% in one day.
Market Volatility: All-Time Highs and Lows
To put today’s market volatility in context, here are the market’s peak periods of volatility, through highs and lows:
| Date | VIX All-Time Highs | S&P 500 Daily % Change |
|---|---|---|
| Mar 16, 2020 | 82.7 | -12.0% |
| Nov 20, 2008 | 80.9 | -6.7% |
| Oct 27, 2008 | 80.1 | -3.2% |
| Oct 24, 2008 | 79.1 | -3.5% |
| Mar 3, 2020 | 76.5 | -2.8% |
We can see in the above chart that the VIX skyrocketed in 2020 and 2008 at the height of recession fears.
By contrast market volatility hit all-time lows during 2017, when corporate profitability was high and the S&P 500 was in the middle of the second-longest bull run in history:
| Date | VIX All-Time Lows | S&P 500 Daily % Change |
|---|---|---|
| Nov 3, 2017 | 9.1 | +0.3% |
| Jan 3, 2018 | 9.2 | +0.6% |
| Oct 5, 2017 | 9.2 | +0.6% |
| Jan 4, 2018 | 9.2 | +0.4% |
| Jan 5, 2018 | 9.2 | +0.7% |
When investors have muted reactions to the market’s outlook, often market volatility is lower—reflecting mixed reactions to the market instead of a unanimous, surprise reaction to economic data or other factors that could sway investor behavior.
2023’s Volatility in Context
In September, the VIX declined to 12.8, the lowest point since January 2020. Since then, it has hovered near these levels as investors scale back recession fears, and factor in the likelihood of the U.S. economy achieving a soft landing. To date, the S&P 500 is up almost 17%.
Many factors are influencing the market’s relative calmness. Inflation has been moderating, falling at 3.7% in August, down from a peak of 9.1% seen in June last year.
Labor market strength has also played a key role. The unemployment rate hovers near five-decade lows, and wage growth remains above historical averages at 4.3% annually as of August.
Despite 11 interest rate hikes since March 2022, consumer spending remains strong, although savings have declined considerably over the year. Household spending makes up roughly two-thirds of U.S. GDP, a key driver of economic output.
Together, these factors, among others, are influencing investor sentiment. Some may argue that investors are complacent as economic data could be weakening, but so far the resilience of the economy is supporting lower market volatility.


Markets
The European Stock Market: Attractive Valuations Offer Opportunities
On average, the European stock market has valuations that are nearly 50% lower than U.S. valuations. But how can you access the market?


European Stock Market: Attractive Valuations Offer Opportunities
Europe is known for some established brands, from L’Oréal to Louis Vuitton. However, the European stock market offers additional opportunities that may be lesser known.
The above infographic, sponsored by STOXX, outlines why investors may want to consider European stocks.
Attractive Valuations
Compared to most North American and Asian markets, European stocks offer lower or comparable valuations.
| Index | Price-to-Earnings Ratio | Price-to-Book Ratio |
|---|---|---|
| EURO STOXX 50 | 14.9 | 2.2 |
| STOXX Europe 600 | 14.4 | 2 |
| U.S. | 25.9 | 4.7 |
| Canada | 16.1 | 1.8 |
| Japan | 15.4 | 1.6 |
| Asia Pacific ex. China | 17.1 | 1.8 |
Data as of February 29, 2024. See graphic for full index names. Ratios based on trailing 12 month financials. The price to earnings ratio excludes companies with negative earnings.
On average, European valuations are nearly 50% lower than U.S. valuations, potentially offering an affordable entry point for investors.
Research also shows that lower price ratios have historically led to higher long-term returns.
Market Movements Not Closely Connected
Over the last decade, the European stock market had low-to-moderate correlation with North American and Asian equities.
The below chart shows correlations from February 2014 to February 2024. A value closer to zero indicates low correlation, while a value of one would indicate that two regions are moving in perfect unison.
| EURO STOXX 50 | STOXX EUROPE 600 | U.S. | Canada | Japan | Asia Pacific ex. China |
|
|---|---|---|---|---|---|---|
| EURO STOXX 50 | 1.00 | 0.97 | 0.55 | 0.67 | 0.24 | 0.43 |
| STOXX EUROPE 600 | 1.00 | 0.56 | 0.71 | 0.28 | 0.48 | |
| U.S. | 1.00 | 0.73 | 0.12 | 0.25 | ||
| Canada | 1.00 | 0.22 | 0.40 | |||
| Japan | 1.00 | 0.88 | ||||
| Asia Pacific ex. China | 1.00 |
Data is based on daily USD returns.
European equities had relatively independent market movements from North American and Asian markets. One contributing factor could be the differing sector weights in each market. For instance, technology makes up a quarter of the U.S. market, but health care and industrials dominate the broader European market.
Ultimately, European equities can enhance portfolio diversification and have the potential to mitigate risk for investors.
Tracking the Market
For investors interested in European equities, STOXX offers a variety of flagship indices:
| Index | Description | Market Cap |
|---|---|---|
| STOXX Europe 600 | Pan-regional, broad market | €10.5T |
| STOXX Developed Europe | Pan-regional, broad-market | €9.9T |
| STOXX Europe 600 ESG-X | Pan-regional, broad market, sustainability focus | €9.7T |
| STOXX Europe 50 | Pan-regional, blue-chip | €5.1T |
| EURO STOXX 50 | Eurozone, blue-chip | €3.5T |
Data is as of February 29, 2024. Market cap is free float, which represents the shares that are readily available for public trading on stock exchanges.
The EURO STOXX 50 tracks the Eurozone’s biggest and most traded companies. It also underlies one of the world’s largest ranges of ETFs and mutual funds. As of November 2023, there were €27.3 billion in ETFs and €23.5B in mutual fund assets under management tracking the index.
“For the past 25 years, the EURO STOXX 50 has served as an accurate, reliable and tradable representation of the Eurozone equity market.”
— Axel Lomholt, General Manager at STOXX
Partnering with STOXX to Track the European Stock Market
Are you interested in European equities? STOXX can be a valuable partner:
- Comprehensive, liquid and investable ecosystem
- European heritage, global reach
- Highly sophisticated customization capabilities
- Open architecture approach to using data
- Close partnerships with clients
- Part of ISS STOXX and Deutsche Börse Group
With a full suite of indices, STOXX can help you benchmark against the European stock market.
Learn how STOXX’s European indices offer liquid and effective market access.

-

 Economy3 days ago
Economic Growth Forecasts for G7 and BRICS Countries in 2024
The IMF has released its economic growth forecasts for 2024. How do the G7 and BRICS countries compare?
-

 Markets2 weeks ago
U.S. Debt Interest Payments Reach $1 Trillion
U.S. debt interest payments have surged past the $1 trillion dollar mark, amid high interest rates and an ever-expanding debt burden.
-

 United States2 weeks ago
Ranked: The Largest U.S. Corporations by Number of Employees
We visualized the top U.S. companies by employees, revealing the massive scale of retailers like Walmart, Target, and Home Depot.
-

 Markets2 weeks ago
The Top 10 States by Real GDP Growth in 2023
This graphic shows the states with the highest real GDP growth rate in 2023, largely propelled by the oil and gas boom.
-

 Markets3 weeks ago
Ranked: The World’s Top Flight Routes, by Revenue
In this graphic, we show the highest earning flight routes globally as air travel continued to rebound in 2023.
-

 Markets3 weeks ago
Ranked: The Most Valuable Housing Markets in America
The U.S. residential real estate market is worth a staggering $47.5 trillion. Here are the most valuable housing markets in the country.
-

 Science7 days ago
Visualizing the Average Lifespans of Mammals
-
Markets2 weeks ago
The Top 10 States by Real GDP Growth in 2023
-

 Demographics2 weeks ago
The Smallest Gender Wage Gaps in OECD Countries
-

 United States2 weeks ago
Where U.S. Inflation Hit the Hardest in March 2024
-

 Green2 weeks ago
Top Countries By Forest Growth Since 2001
-
United States2 weeks ago
Ranked: The Largest U.S. Corporations by Number of Employees
-

 Maps2 weeks ago
The Largest Earthquakes in the New York Area (1970-2024)
-

 Green2 weeks ago
Ranked: The Countries With the Most Air Pollution in 2023