Markets
Ranked: The Highest Paid CEOs in the S&P 500
Ranked: The Highest Paid CEOs in the S&P 500
Many of the world’s most valuable companies are listed on the S&P 500, the benchmark index for the U.S. stock market.
For this reason, it is no surprise to see that CEOs of these key companies have multi-million dollar compensation packages. But what do these pay packages comprise? And do these CEOs always receive the compensation they are awarded? Or does it increase and decrease with stock market fluctuations?
In today’s infographic, we use data published by The Wall Street Journal to show the highest paid CEOs of S&P 500 companies in 2022, and delve into what their compensation includes.
The 20 Highest Paid CEOs
The compensation packages of CEOs of S&P 500 companies comprise not just salaries, but bonuses, stock awards, and other incentives.
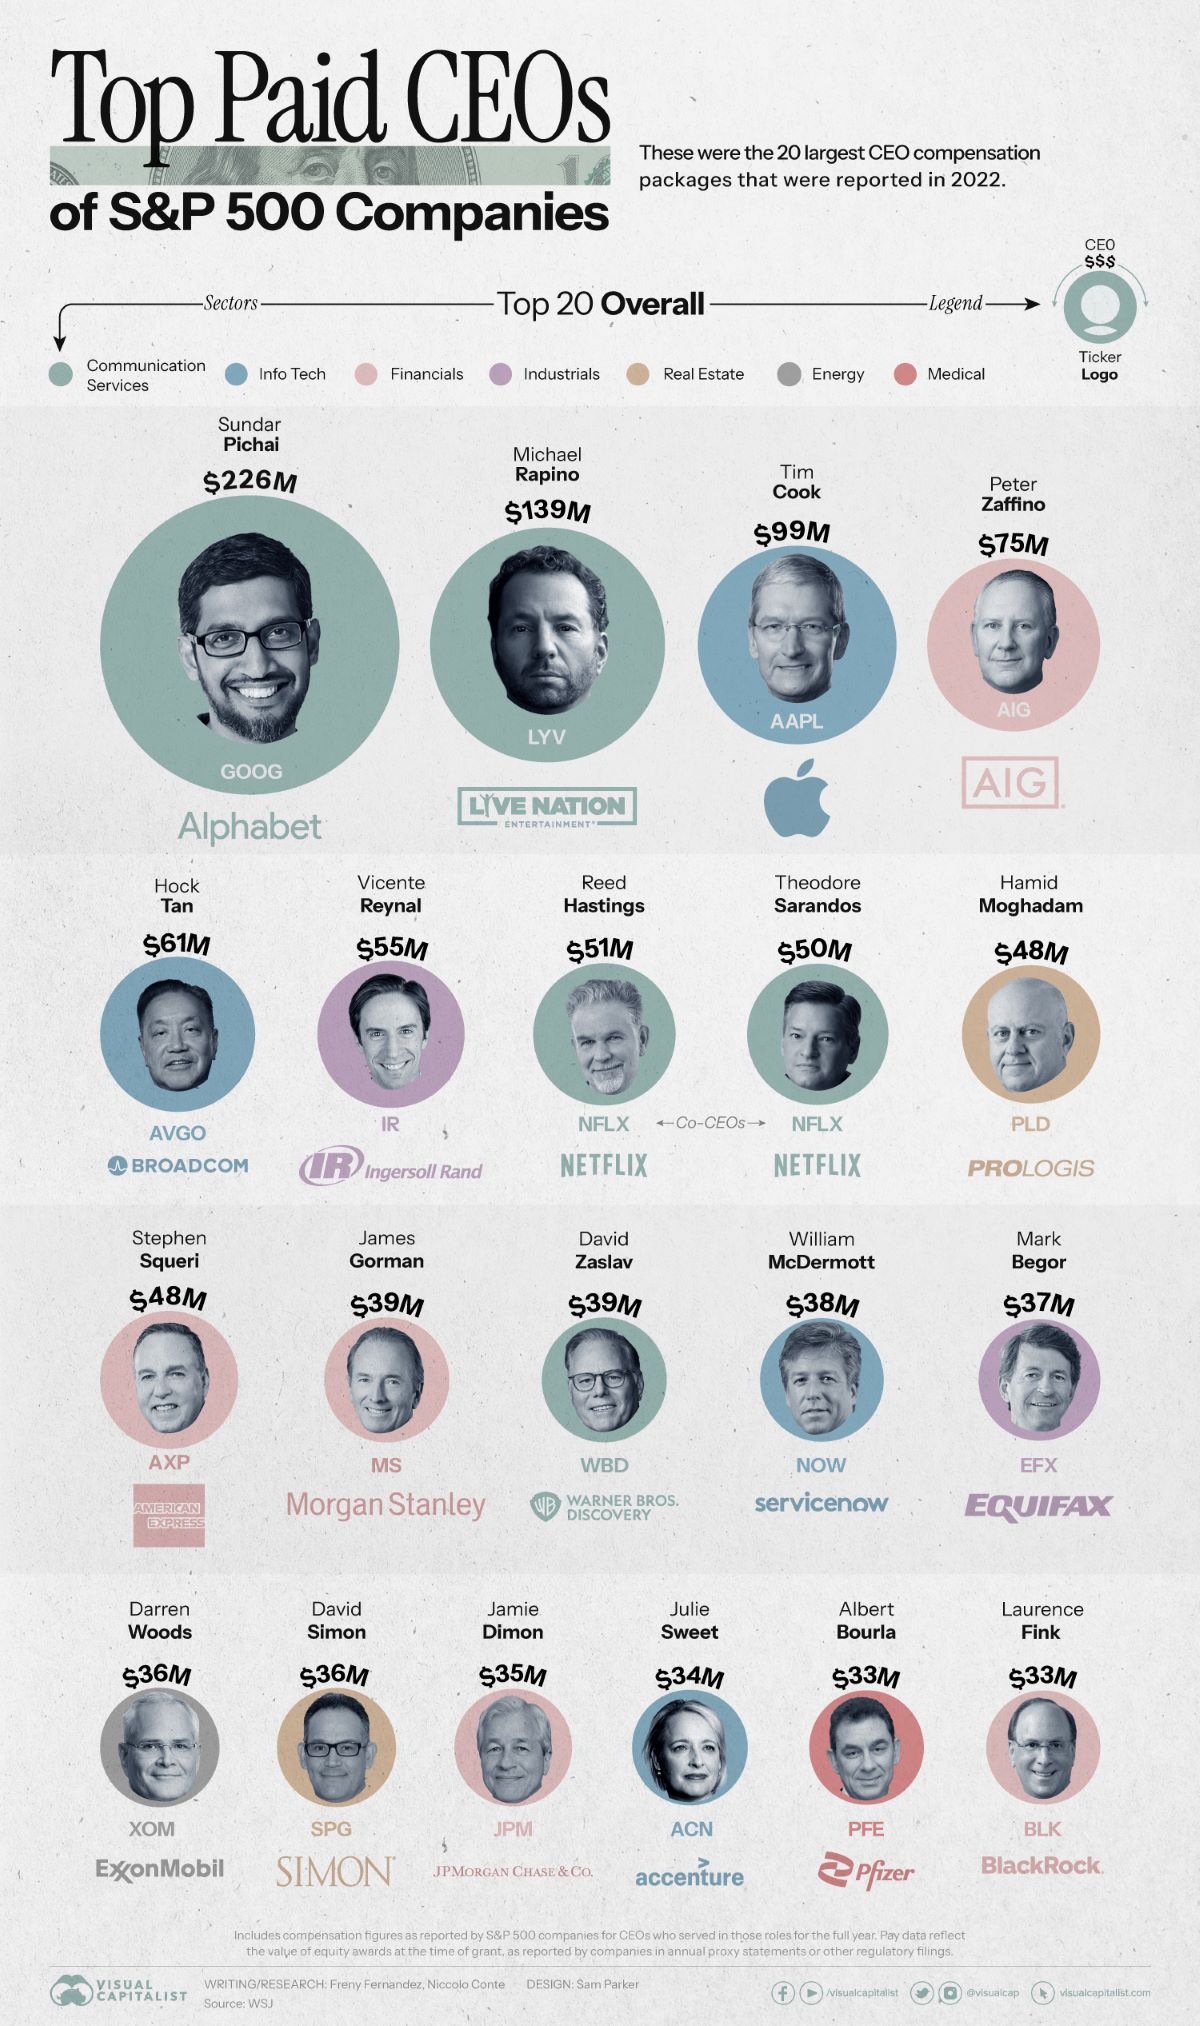
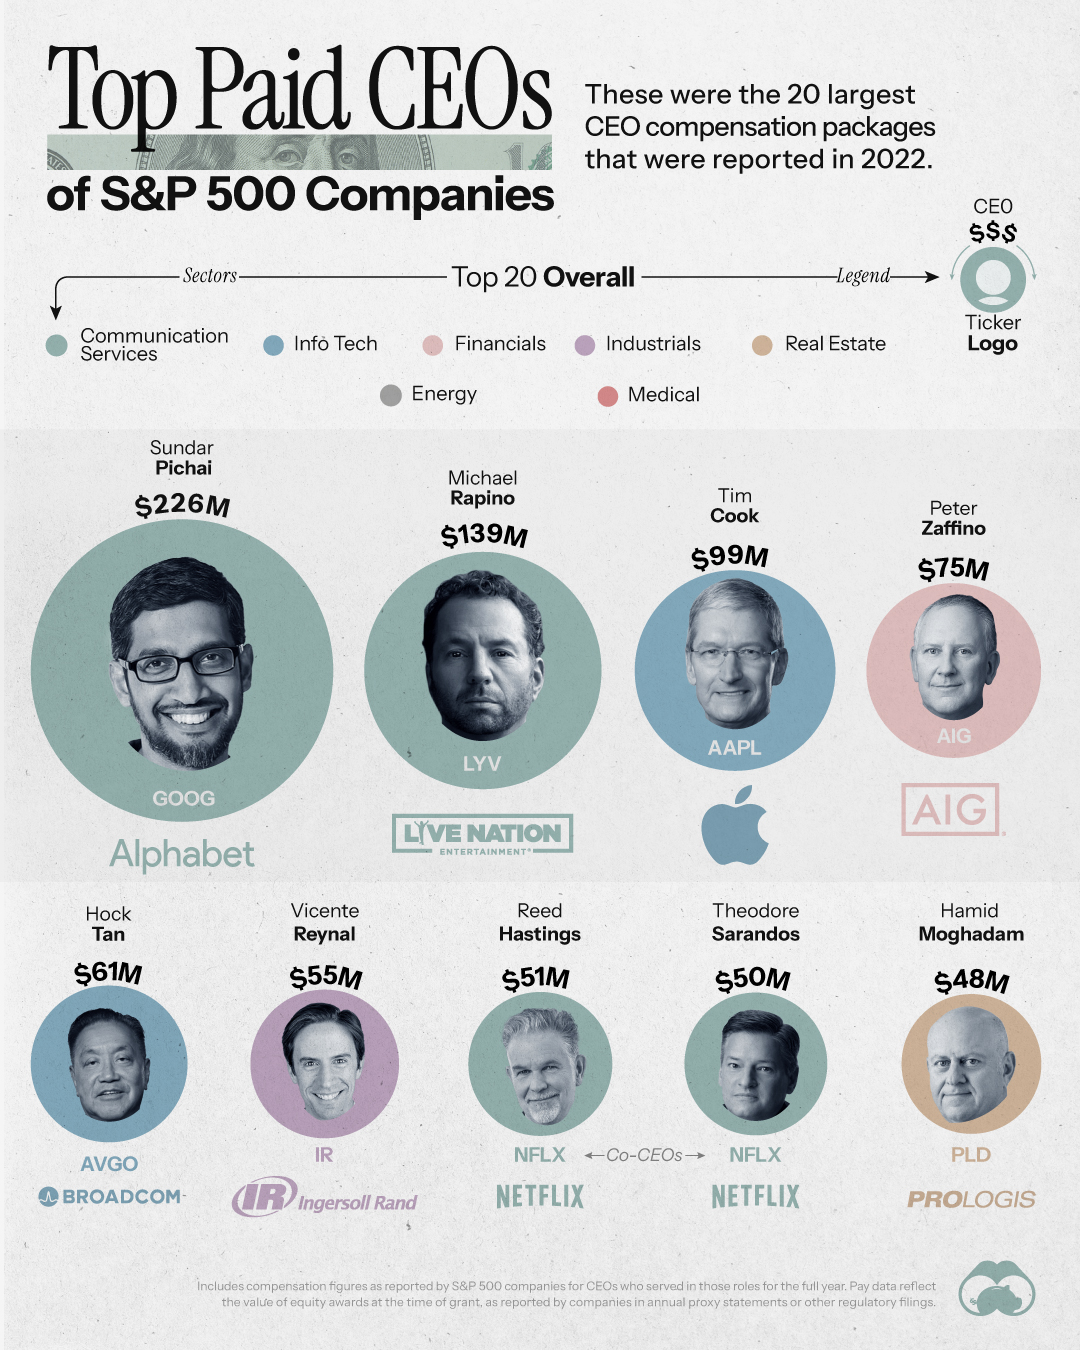
Here are the CEOs of S&P 500 companies that were awarded the highest pay packages last year, and the sectors they belong to.
| CEO | Company | Sector | Total Pay |
|---|---|---|---|
| Sundar Pichai | Alphabet | Communication Services | $226M |
| Michael Rapino | Live Nation Entertainment | Communication Services | $139M |
| Tim Cook | Apple | Info Tech | $99M |
| Peter Zaffino | American International Group | Financials | $75M |
| Hock Tan | Broadcom | Info Tech | $61M |
| Vicente Reynal | Ingersoll Rand | Industrials | $55M |
| Reed Hastings | Netflix | Communication Services | $51M |
| Theodore Sarandos | Netflix | Communication Services | $50M |
| Hamid Moghadam | Prologis | Real Estate | $48M |
| Stephen Squeri | American Express | Financials | $48M |
| James Gorman | Morgan Stanley | Financials | $39M |
| David Zaslav | Warner Bros. Discovery | Communication Services | $39M |
| William McDermott | ServiceNow | Info Tech | $39M |
| Mark Begor | Equifax | Industrials | $37M |
| Darren W. Woods | Exxon Mobil | Energy | $36M |
| David Simon | Simon Property Group | Real Estate | $36M |
| James Dimon | JPMorgan Chase | Financials | $35M |
| Julie Sweet | Accenture | Info Tech | $34M |
| Albert Bourla | Pfizer | Medical | $33M |
| Laurence Fink | BlackRock | Financials | $33M |
Sundar Pichai, CEO of Google’s parent company, Alphabet, topped the list with an awarded pay package valued at around $226 million, which was over 800 times Google’s median employee compensation. His pay package included his annual salary of $2 million, a sum of $6 million for his personal security and stock awards valued at $218 million.
Meanwhile, Live Nation Entertainment CEO Michael Rapino’s awarded pay package shot up to $139 million in 2022 from almost $14 million the previous year. This included stock awards initially valued at $116 million. Tech companies Apple and Broadcom were not far behind. While Apple CEO Tim Cook’s compensation package was valued at $99 million in 2022, Broadcom’s president and CEO Hock Tan was awarded $61 million.
Other CEOs that made it to the list include global insurance giant AIG’s CEO, Peter Zaffino, and Netflix’s co-CEOs Ted Sarandos and Reed Hastings. While Hastings received a $10 million hike last year, he stepped down from this role in January 2023.
Rising Median CEO Income Hits a Wall
Over the last decade, the median pay awarded to CEOs across S&P 500 companies has doubled.
| Year | Median Total Compensation for S&P 500 CEOs | Change (%) |
|---|---|---|
| 2010 | $7.68M | n/a |
| 2011 | $7.56M | -2% |
| 2012 | $6.96M | -8% |
| 2013 | $7.95M | 14% |
| 2014 | $9.35M | 18% |
| 2015 | $9.72M | 4% |
| 2016 | $9.93M | 2% |
| 2017 | $10.62M | 7% |
| 2018 | $11.81M | 11% |
| 2019 | $12.20M | 3% |
| 2020 | $13.43M | 10% |
| 2021 | $14.67M | 9% |
| 2022 | $14.50M | -1% |
In 2021, this number hit a high of $14.7 million.
However, in 2022, the median CEO compensation package hit a wall for the first time in a decade as it slightly fell to $14.5 million.
Compensation Actually Paid
A compensation package dependent on market valuation means that these CEOs may receive more or less than the pay they are slated to receive.
This is because most stock awards aren’t granted when announced, but instead vest over time, becoming subject to changes in share prices.
In 2022, the SEC introduced new disclosure rules for companies to report this realized value for executive pay packages, appropriately called “compensation actually paid.”
| CEO | Company | Total Pay | Compensation Paid |
|---|---|---|---|
| Sundar Pichai | Alphabet | $226M | $116M |
| Michael Rapino | Live Nation Entertainment | $139M | $36M |
| Tim Cook | Apple | $99M | N/A |
| Peter Zaffino | American International Group | $75M | $91M |
| Hock Tan | Broadcom | $61M | N/A |
| Vicente Reynal | Ingersoll Rand | $55M | $51M |
| Reed Hastings | Netflix | $51M | $50M |
| Theodore (Ted) Sarandos | Netflix | $50M | $50M |
| Hamid. Moghadam | Prologis | $48M | -$8M |
| Stephen Squeri | American Express | $48M | $43M |
| James Gorman | Morgan Stanley | $39M | $31M |
| David Zaslav | Warner Bros. Discovery | $39M | -$41M |
| William McDermott | ServiceNow | $39M | -$76M |
| Mark Begor | Equifax | $37M | -$19M |
| Darren Woods | Exxon Mobil | $36M | $90M |
| David Simon | Simon Property Group | $36M | $30M |
| James Dimon | JPMorgan Chase | $35M | $37M |
| Julie Sweet | Accenture | $34M | N/A |
| Albert Bourla | Pfizer | $33M | $6M |
| Laurence Fink | BlackRock | $33M | -$6M |
The Wall Street Journal report revealed that many of the top-paid S&P 500 CEOs in 2022 received much smaller pay packages due to market fluctuations.
For example, Sundar Pichai ended up receiving about $116 million as the value of Alphabet’s stock dropped at the time that his grants vested. Similarly, Michael Rapino was paid almost $36 million, though his stock awards will continue vesting for another five years.
Barring Pichai, many of the names of the highest paid S&P 500 CEOs were eclipsed by CEOs of several energy companies, like Exxon Mobil and Chevron, whose stock prices shot up in 2022.


Markets
The European Stock Market: Attractive Valuations Offer Opportunities
On average, the European stock market has valuations that are nearly 50% lower than U.S. valuations. But how can you access the market?


European Stock Market: Attractive Valuations Offer Opportunities
Europe is known for some established brands, from L’Oréal to Louis Vuitton. However, the European stock market offers additional opportunities that may be lesser known.
The above infographic, sponsored by STOXX, outlines why investors may want to consider European stocks.
Attractive Valuations
Compared to most North American and Asian markets, European stocks offer lower or comparable valuations.
| Index | Price-to-Earnings Ratio | Price-to-Book Ratio |
|---|---|---|
| EURO STOXX 50 | 14.9 | 2.2 |
| STOXX Europe 600 | 14.4 | 2 |
| U.S. | 25.9 | 4.7 |
| Canada | 16.1 | 1.8 |
| Japan | 15.4 | 1.6 |
| Asia Pacific ex. China | 17.1 | 1.8 |
Data as of February 29, 2024. See graphic for full index names. Ratios based on trailing 12 month financials. The price to earnings ratio excludes companies with negative earnings.
On average, European valuations are nearly 50% lower than U.S. valuations, potentially offering an affordable entry point for investors.
Research also shows that lower price ratios have historically led to higher long-term returns.
Market Movements Not Closely Connected
Over the last decade, the European stock market had low-to-moderate correlation with North American and Asian equities.
The below chart shows correlations from February 2014 to February 2024. A value closer to zero indicates low correlation, while a value of one would indicate that two regions are moving in perfect unison.
| EURO STOXX 50 | STOXX EUROPE 600 | U.S. | Canada | Japan | Asia Pacific ex. China |
|
|---|---|---|---|---|---|---|
| EURO STOXX 50 | 1.00 | 0.97 | 0.55 | 0.67 | 0.24 | 0.43 |
| STOXX EUROPE 600 | 1.00 | 0.56 | 0.71 | 0.28 | 0.48 | |
| U.S. | 1.00 | 0.73 | 0.12 | 0.25 | ||
| Canada | 1.00 | 0.22 | 0.40 | |||
| Japan | 1.00 | 0.88 | ||||
| Asia Pacific ex. China | 1.00 |
Data is based on daily USD returns.
European equities had relatively independent market movements from North American and Asian markets. One contributing factor could be the differing sector weights in each market. For instance, technology makes up a quarter of the U.S. market, but health care and industrials dominate the broader European market.
Ultimately, European equities can enhance portfolio diversification and have the potential to mitigate risk for investors.
Tracking the Market
For investors interested in European equities, STOXX offers a variety of flagship indices:
| Index | Description | Market Cap |
|---|---|---|
| STOXX Europe 600 | Pan-regional, broad market | €10.5T |
| STOXX Developed Europe | Pan-regional, broad-market | €9.9T |
| STOXX Europe 600 ESG-X | Pan-regional, broad market, sustainability focus | €9.7T |
| STOXX Europe 50 | Pan-regional, blue-chip | €5.1T |
| EURO STOXX 50 | Eurozone, blue-chip | €3.5T |
Data is as of February 29, 2024. Market cap is free float, which represents the shares that are readily available for public trading on stock exchanges.
The EURO STOXX 50 tracks the Eurozone’s biggest and most traded companies. It also underlies one of the world’s largest ranges of ETFs and mutual funds. As of November 2023, there were €27.3 billion in ETFs and €23.5B in mutual fund assets under management tracking the index.
“For the past 25 years, the EURO STOXX 50 has served as an accurate, reliable and tradable representation of the Eurozone equity market.”
— Axel Lomholt, General Manager at STOXX
Partnering with STOXX to Track the European Stock Market
Are you interested in European equities? STOXX can be a valuable partner:
- Comprehensive, liquid and investable ecosystem
- European heritage, global reach
- Highly sophisticated customization capabilities
- Open architecture approach to using data
- Close partnerships with clients
- Part of ISS STOXX and Deutsche Börse Group
With a full suite of indices, STOXX can help you benchmark against the European stock market.
Learn how STOXX’s European indices offer liquid and effective market access.

-

 Economy2 days ago
Economic Growth Forecasts for G7 and BRICS Countries in 2024
The IMF has released its economic growth forecasts for 2024. How do the G7 and BRICS countries compare?
-

 Markets1 week ago
U.S. Debt Interest Payments Reach $1 Trillion
U.S. debt interest payments have surged past the $1 trillion dollar mark, amid high interest rates and an ever-expanding debt burden.
-

 United States2 weeks ago
Ranked: The Largest U.S. Corporations by Number of Employees
We visualized the top U.S. companies by employees, revealing the massive scale of retailers like Walmart, Target, and Home Depot.
-

 Markets2 weeks ago
The Top 10 States by Real GDP Growth in 2023
This graphic shows the states with the highest real GDP growth rate in 2023, largely propelled by the oil and gas boom.
-

 Markets2 weeks ago
Ranked: The World’s Top Flight Routes, by Revenue
In this graphic, we show the highest earning flight routes globally as air travel continued to rebound in 2023.
-

 Markets2 weeks ago
Ranked: The Most Valuable Housing Markets in America
The U.S. residential real estate market is worth a staggering $47.5 trillion. Here are the most valuable housing markets in the country.

-

 Education1 week ago
How Hard Is It to Get Into an Ivy League School?
-

 Technology2 weeks ago
Ranked: Semiconductor Companies by Industry Revenue Share
-
Markets2 weeks ago
Ranked: The World’s Top Flight Routes, by Revenue
-

 Demographics2 weeks ago
Population Projections: The World’s 6 Largest Countries in 2075
-
Markets2 weeks ago
The Top 10 States by Real GDP Growth in 2023
-

 Demographics2 weeks ago
The Smallest Gender Wage Gaps in OECD Countries
-

 Economy2 weeks ago
Where U.S. Inflation Hit the Hardest in March 2024
-

 Environment2 weeks ago
Top Countries By Forest Growth Since 2001