Energy
Big Oil Profits Reached Record High Levels in 2022
Article/Editing:
Big Oil Profits Reached Record High Levels in 2022
Last year was a great year for oil companies.
Global crude oil prices had already escalated as global economies began recovering, and demand increased after the onset of the COVID-19 pandemic. Russia’s invasion of Ukraine shot these prices further up as fossil fuel trade fell under the microscope.
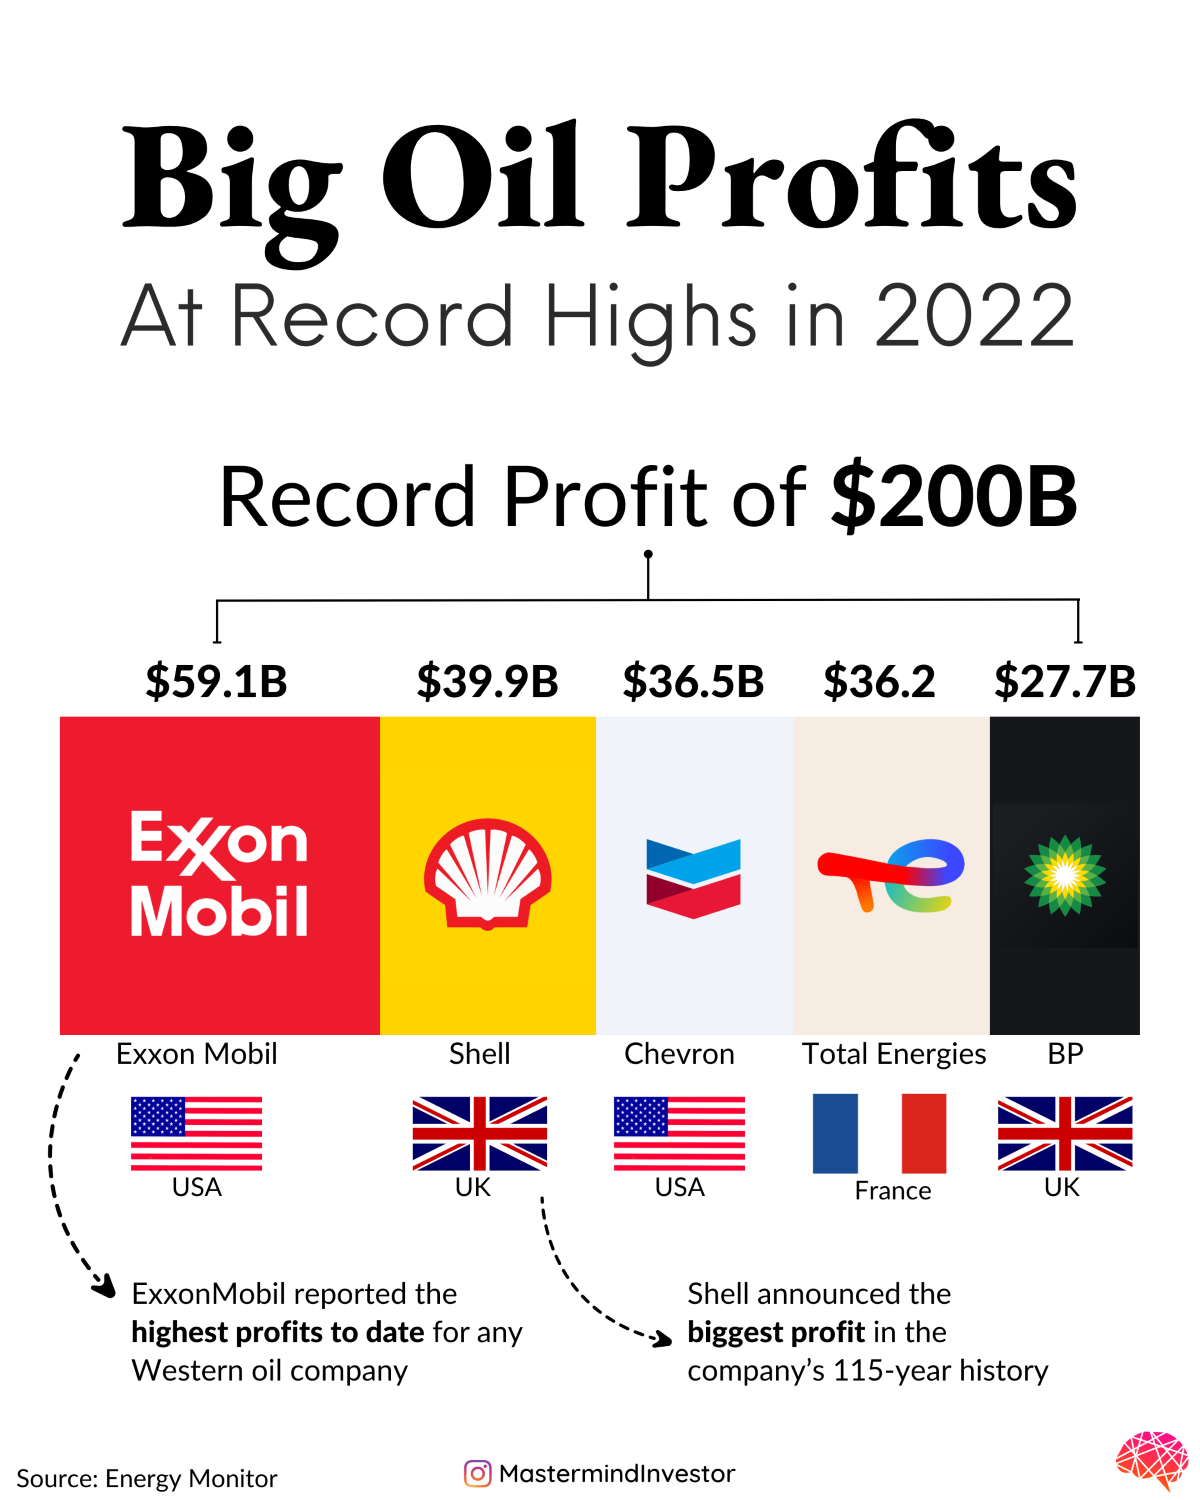
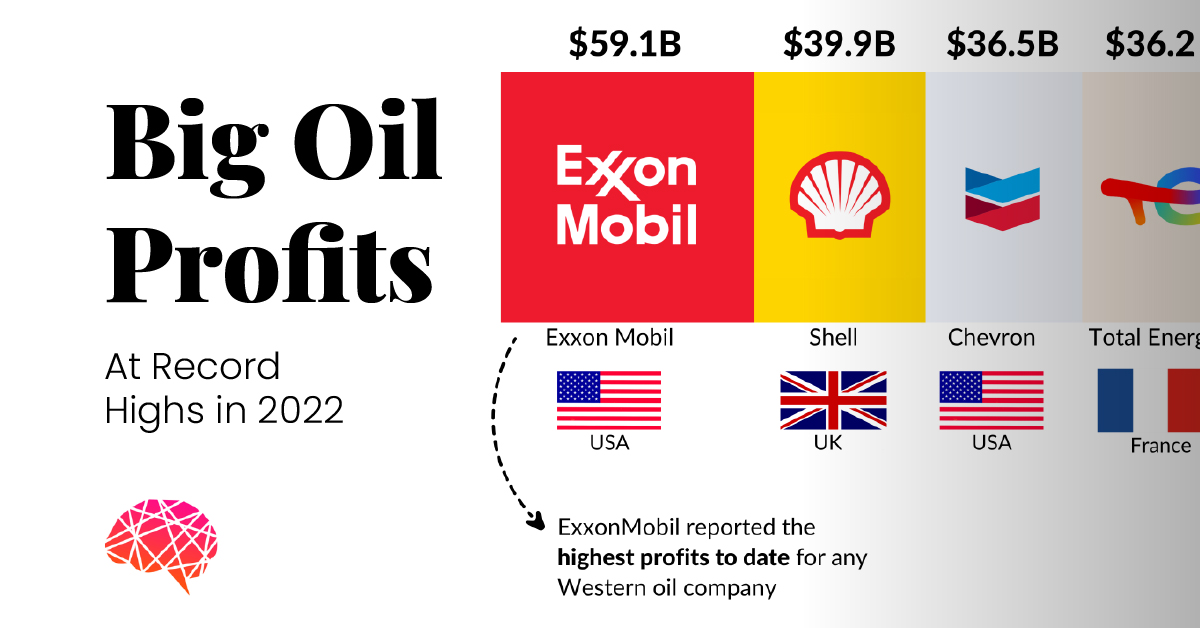
In this graphic, Vipul Sharma of Mastermind Investor uses accumulated earnings data from Energy Monitor to highlight the five companies that made a cumulative profit of over $200 billion in 2022.
The Five Big Oil Winners
Within the span of one year, the five Big Oil companies — ExxonMobil, Chevron, Shell, BP, and TotalEnergies — more than doubled their profits.
| Company | Profit 2021 | Profit 2022 |
|---|---|---|
| ExxonMobil | $23B | $59.1B |
| Shell | $19.3B | $39.9B |
| Chevron | $15.6B | $36.5B |
| TotalEnergies | $18.1B | $36.2B |
| BP | $12.8B | $27.7B |
Securing a total profit of $59.2 billion, U.S. oil giant ExxonMobil recorded the highest total of the lot. In 2021, the company’s profits were $23 billion or less than half of 2022’s haul.
It was joined by Chevron, whose profits rose by over 134% to $36.5 billion, and Shell, whose profit of $39.9 billion was the highest in the company’s 115-year history.
Where Will This Money Go?
One of the main focuses of the COP27 conference in Egypt last year was the global attempt to phase down fossil fuels and move to clean energy.
So far, these massive profits have largely gone to stock buybacks and reinvesting in shareholders. With lower oil prices so far in 2023, how will Big Oil react and spend moving forward?

This article was published as a part of Visual Capitalist's Creator Program, which features data-driven visuals from some of our favorite Creators around the world.


Lithium
Ranked: The Top 10 EV Battery Manufacturers in 2023
Asia dominates this ranking of the world’s largest EV battery manufacturers in 2023.


The Top 10 EV Battery Manufacturers in 2023
This was originally posted on our Voronoi app. Download the app for free on iOS or Android and discover incredible data-driven charts from a variety of trusted sources.
Despite efforts from the U.S. and EU to secure local domestic supply, all major EV battery manufacturers remain based in Asia.
In this graphic we rank the top 10 EV battery manufacturers by total battery deployment (measured in megawatt-hours) in 2023. The data is from EV Volumes.
Chinese Dominance
Contemporary Amperex Technology Co. Limited (CATL) has swiftly risen in less than a decade to claim the title of the largest global battery group.
The Chinese company now has a 34% share of the market and supplies batteries to a range of made-in-China vehicles, including the Tesla Model Y, SAIC’s MG4/Mulan, and various Li Auto models.
| Company | Country | 2023 Production (megawatt-hour) | Share of Total Production |
|---|---|---|---|
| CATL | 🇨🇳 China | 242,700 | 34% |
| BYD | 🇨🇳 China | 115,917 | 16% |
| LG Energy Solution | 🇰🇷 Korea | 108,487 | 15% |
| Panasonic | 🇯🇵 Japan | 56,560 | 8% |
| SK On | 🇰🇷 Korea | 40,711 | 6% |
| Samsung SDI | 🇰🇷 Korea | 35,703 | 5% |
| CALB | 🇨🇳 China | 23,493 | 3% |
| Farasis Energy | 🇨🇳 China | 16,527 | 2% |
| Envision AESC | 🇨🇳 China | 8,342 | 1% |
| Sunwoda | 🇨🇳 China | 6,979 | 1% |
| Other | - | 56,040 | 8% |
In 2023, BYD surpassed LG Energy Solution to claim second place. This was driven by demand from its own models and growth in third-party deals, including providing batteries for the made-in-Germany Tesla Model Y, Toyota bZ3, Changan UNI-V, Venucia V-Online, as well as several Haval and FAW models.
The top three battery makers (CATL, BYD, LG) collectively account for two-thirds (66%) of total battery deployment.
Once a leader in the EV battery business, Panasonic now holds the fourth position with an 8% market share, down from 9% last year. With its main client, Tesla, now sourcing batteries from multiple suppliers, the Japanese battery maker seems to be losing its competitive edge in the industry.
Overall, the global EV battery market size is projected to grow from $49 billion in 2022 to $98 billion by 2029, according to Fortune Business Insights.

-

 Mining1 week ago
Gold vs. S&P 500: Which Has Grown More Over Five Years?
-

 Markets2 weeks ago
Ranked: The Most Valuable Housing Markets in America
-

 Money2 weeks ago
Which States Have the Highest Minimum Wage in America?
-

 AI2 weeks ago
Ranked: Semiconductor Companies by Industry Revenue Share
-

 Markets2 weeks ago
Ranked: The World’s Top Flight Routes, by Revenue
-

 Countries2 weeks ago
Population Projections: The World’s 6 Largest Countries in 2075
-

 Markets2 weeks ago
The Top 10 States by Real GDP Growth in 2023
-

 Demographics2 weeks ago
The Smallest Gender Wage Gaps in OECD Countries